|
|
U.S. GEOLOGICAL SURVEY
QUALITY-ASSURANCE |
INTRODUCTION
The U.S. Environmental Protection Agency (1998) identifies sediment as the single most widespread pollutant affecting the beneficial uses of the Nation’s rivers and streams. Sediment is derived primarily from natural weathering of rock and is an assemblage of individual mineral grains that are then deposited by some physical agent, such as water, wind, ice, or gravity (Fetter, 1988).
The Federal Clean Water Act of 1972, Section 303(d), requires each State to determine a total maximum daily load (TMDL), which is an estimate of the maximum pollutant load during a specified time period from point and nonpoint sources, for impaired waters within their State. Restoration techniques can be implemented as part of a TMDL to meet water-quality standards for sediment. For example, in a watershed where elevated sediment loadings damage fish spawning habitats, a TMDL can establish sediment limits to restore the habitat. It is appropriate that the U.S. Geological Survey (USGS) be involved in the TMDL assessment process to aid in the collecting of sediment data and helping design suitable monitoring programs. Therefore, in February 1997 the USGS, Office of Water Quality issued Technical Memorandum No. 97.05, which directed the USGS to become involved in the TMDL assessment process (U. S. Geological Survey Office of Water Quality Technical Memorandum No. 97.05, 1997).
Because of these and other studies, the USGS samples
sediments and collects data on the amount of sediment in selected
waterways. Information needs for
sediment data are changing rapidly.
Historically, the USGS provided data and analyses regarding sediment
transport and geomorphology issues that dealt primarily with engineering
structures in the river environment.
Today, the most pressing sediment-related problems are associated with
environmental questions, such as the transport and fate of attached pollutants,
effects of sediment on aquatic biota and their habitats, and effects on
sediment transport from land-use changes.
Current (2000) sediment issues require that sediment studies address
multiple objectives in water-resources management (Koltun and others, 1997).
To support sediment research, the USGS operates laboratories for the analysis of the physical characteristics of sediment. Sediment laboratories producing data for the USGS have two principal functions: (1) the determination of suspended-sediment concentration in samples and (2) the determination of sediment particle size. The reliability of these determinations and the usefulness of the data are dependent on the accuracy and reliability of the laboratory analyses (Guy, 1969).
QUALITY ASSURANCE—A TOP PRIORITY
The reputation of the USGS rests on the quality of its data. In 1992, the USGS, Office of Surface Water, reviewed each of its 19 sediment laboratories to observe the quality of laboratory operations and determined the need for more rigorous quality assurance of laboratory processes and results. The review revealed that there were occasional departures from documented procedures, a lack of state-of-the-art equipment, few quantitative laboratory quality-assurance plans, and a need to document quality-control practices. To ensure that the physical sediment data produced or used by the USGS are of a known quality and are sufficient to provide long-term comparability and consistency, the USGS began the Sediment Laboratory Quality-Assurance (SLQA) project in August 1996 (U. S. Geological Survey Office of Surface Water Technical Memorandum No. 98.05, 1998). This project was developed to (1) evaluate the precision and bias of suspended-sediment concentration and sand/fine separations, and (2) evaluate sediment analyses on an ongoing basis in order to monitor intralaboratory (analyses comparison within each laboratory) and interlaboratory (analyses comparison between laboratories) precision and accuracy (U. S. Geological Survey Office of Surface Water Technical Memorandum No. 98.05, 1998).
DESCRIPTION OF THE QUALITY-ASSURANCE PROJECT
Reference Material Preparation
Two materials were used to represent naturally occurring sediments in streams and rivers. To represent the fine material portion of the sediment, AC Spark Plug1 dust was purchased from General Motors1 AC Spark Plug Division (https://www.bardyne.com/glossary.htm). This spark plug dust is actually Arizona road dust, which contains about 40 percent clay-size material and has a specific gravity of about 2.7. The AC Spark Plug dust was tested for dissolution in water, dried at 105oCelsius for a minimum of 24 hours, and sieved to less than 62 micrometers (mm). It was determined that about 1 percent of the Spark Plug dust was less than 0.45 mm. When the AC spark plug dust was added to deionized water, the size fraction that was less than 0.45 mm was considered dissolved. The sand used in the project was collected in South Dakota. It was also tested for dissolution in water, dried at 105oCelsius for a minimum of 24 hours, and then sieved to between 63 and 125 mm. The recovery of the sand-size material ranged from 99.6 to 100.3 percent, indicating that the sand-size material did not dissolve. The recovery of sand-size material that measured greater than 100 percent was attributed to a slight error in measurement (Gordon and others, 1999).
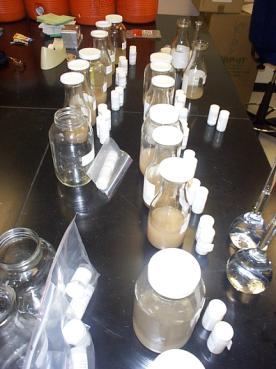
Standard reference sediment samples were prepared by adding both fine-size and sand-size material to deionized water. Samples were created in three broad sample classes to simulate the wide range of sediment concentration and sand- to fine-size material ratios found in the environment. The mass of the fine-size material added to each sample was determined gravimetrically in milligrams. The sand was then added to the fine-size material in an amount equal to between 5 and 32 percent of the fine-size material mass (table 1) (Gordon and others, 1999). Figures 1 and 2 depict the preparation of references samples used in the SLQA project.
1 The use of brand, trade or firm names in this report is for
identification
purposes only and do not constitute endorsement by the U.S. Geological Survey.
Table 1. Sample fine-size material mass and percent sand-size
material in each Sediment Laboratory Quality-Assurance study
between August 1996 and July 1999
Figure 1. Deionized water is added to the dry sediment sample. A meniscus line
is then drawn, showing the
top of the water level.
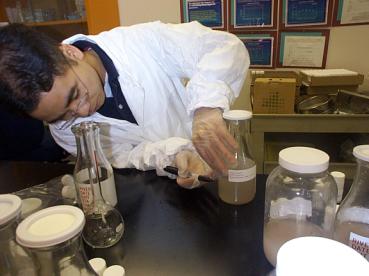
Figure 2. Samples are placed in pint-size and
quart-size bottles.
Study
Approach
The USGS, Branch of Quality Systems (BQS), currently
distributes 18 standard reference sediment samples annually in two separate sets
to each participating laboratory. A
total of nine samples—three from each sample class--are sent to each of the
laboratories (table 1). These samples
are referred to as single-blind samples because the samples’
sediment-concentration and particle-size distribution values are unknown to the
receiving laboratory. Each sample
mailed to the laboratories is identified as a quality-assurance sample. The laboratories report the sediment
concentration, the mass of sediment, and the percentage of sand-size and
fine-size material (sand/fine separations) (Gordon and others, 1999).
Upon completion of the analyses by the participating laboratories, the analytical results along with the methods of analysis are returned to the BQS. Analytical results from all sediment quality-control samples are compiled and statistically summarized by BQS personnel on an intra- and interlaboratory basis and entered into a national data base. Laboratories participating in the study and their customers can access their results, summary tables, graphs, control charts, and reports on the SLQA Web page, https://sedserv.cr.usgs.gov/. An example of a control chart is presented in figure 3. These control charts are prepared after each study using the median percent difference as the central tendency line and + 3 F-pseudosigma as the control limits. Refer to equation 1 for the determination of percent difference. The closer the percent difference is to zero, the more accurate the individual determination is considered to be.
Percent difference = x 100 . (1)
Refer to equation 2 for the determination of the F-pseudosigma. The smaller the F-pseudosigma, the more precise the overall results are considered to be.
F-pseudosigma = upper quartile – lower quartile . (2)
1.349
Laboratories
that produce data that falls outside the control limits are evaluated in a
follow-up study to resolve the source of the measurement discrepancies.
RESULTS OF THE FIRST SEVEN STUDIES
The percent differences for each laboratory were tabulated for the seven studies completed between August 1996 and July 1999. The percent differences were calculated using the known and reported values for sediment mass, suspended-sediment concentration, and sand/fine separations. The median differences between the reported and known values can be used as an indication of laboratory bias. If the median difference from all of the pooled data reported by the laboratories were zero, the median difference line for each control would also be zero. The fact that the median difference is consistently offset from zero indicates that the data for each of the physical sediment properties are biased (fig. 4).
Fine-size material mass is consistently negatively biased, whereas sand-size material mass is generally positively biased. The negative bias for fine-size material mass may be due in part to dissolution of a small amount of the fine-size material. The positive bias observed for sand-size material mass may be due in part to a small amount of fine-size material adhering to the sand-size grains, which increases the mass of sand-size material and decreases the apparent mass of fine-size material (Gordon and others, 1999). In addition, laboratories may be experiencing considerable difficulty separating the fine-size material from the sand-size material due to the high percentage of clay-size material (about 40 percent). It is also recognized that sieves used by the sediment laboratories to separate sediments into sand/fine separations do not grade particles entirely by size, but by shape as well. This is due in part to the fact that sediment has irregular-shaped particles that have nominal diameters much greater than the stated sieve openings. For example, an irregular- or oblong-shaped particle classified as fine-size material may or may not pass through a given sieve and consequently may be erroneously measured as sand-size material (Guy, 1969).
The overall median percent difference for suspended-sediment
concentration on an individual laboratory basis ranged from –6.80 to –0.34
percent for the 12 laboratories. Nine
of the 12 laboratories had an overall median percent difference for
suspended-sediment concentration that ranged from –2.63 to –0.34 percent. There was less variability in the median
difference for the measured mass of fine-size material than for sand-size
material. The overall median percent difference for the mass of fine-size
material ranged from –9.21 to –3.35 percent.
Except for one laboratory, the median percent difference for the mass of
fine-size material was within a fairly narrow range of –6.95 to –3.35 percent. The median percent difference for the mass of
sand-size material differed among laboratories more than any other physical
sediment property measured in the study.
The overall median percent difference for the mass of sand-size material
ranged from –0.92 to 28.93 percent.
Eight of the nine laboratories that determine sand/fine separations had
positive biases that ranged from 2.41 to 28.93 (fig. 4).
The best methods for making determinations of concentrations from suspended-sediment samples must be selected from numerous possible procedures. One of the laboratories in the study typically performed analyses for a wastewater-treatment facility. In the first three studies in which this laboratory participated, the analyses were done using the 19th edition of the “Standard Methods for the Examination of Water and Wastewater,”—2540B Total Solids Dried at 103-105oC and 2540D Total Suspended Solids Dried at 103-105oC (American Public Health Association, 1995). These two methods allow the sample to be subsampled. Beginning with study 98-2, the laboratory used the American Society for Testing and Materials (ASTM) designation D3977-80, “Standard Practice for Determining Suspended-Sediment Concentration in Water Samples” ( American Standards for Testing and Materials, 1980) which does not allow for subsampling. The initial discrepancy with the laboratory’s analyses centered on the difference between “solids” of a biological nature and “sediments” of a mineral nature, which are not defined separately by “Standard Methods for the Examination of Water and Wastewater” (American Public Health Association, 1995). When reviewing the quantitative data, it was determined that the methods for analyzing suspended solids, which allow subsampling, may not be applicable to suspended-sediment analyses because suspended inorganic particles in river water generally have a specific gravity around 2.65 for sand particles, and suspended organic matter generally has a specific gravity that ranges from 1.0 to 1.4 (Linsley and Franzini, 1972). When laboratory personnel subsampled the sediment samples, they consistently had a large negative bias; therefore, it was assumed that sediment settles too swiftly to be subsampled representatively. Figure 5 shows the difference between the first three studies (97-1, 97-2 and 98-1) where the suspended-solid methods were applied using a subsample method and the last two studies (98-2 and 99-1) where methods were applied using no subsampling to determine the quantity of sediment in the sample.
PROJECT EXPANSION
Follow-up
Investigations
Beginning in 1999, follow-up studies were performed when a laboratory returned a specified number of analyses that plotted outside statistically determined data-quality boundaries or for which substantial deficiencies in a laboratory’s methods were detected. The laboratory was then asked to process additional quality-control samples to determine if the deficiency had been corrected. The intent of the follow-up evaluation is to identify and eliminate the source of any discrepancies, increase the competence of the laboratory, and improve the data the laboratory produces (U.S. Geological Survey, Office of Surface Water Technical Memorandum No. 98.05, 1998). The laboratory under review, the USGS Office of Surface Water, and the BQS discuss the results of follow-up evaluations before the data is added to the national data base. Recommendations and any subsequent quality-assurance testing are based on the outcome of the follow-up evaluation (Gordon and others, 1999).
Expansion of the Program
Outside the USGS
In 1999, several non-USGS laboratories began participation in the SLQA program. The participation of sediment laboratories associated with other Federal agencies and laboratories in Canada facilitate transboundary sediment studies throughout North America. By participating, these laboratories provide an additional benchmark for assessing the performance of USGS laboratories.
Double-Blind
Study
A new double-blind study began in 1999. This study provides the capability for customers that submit environmental suspended-sediment samples to participating laboratories also to submit quality-control samples that are disguised as environmental samples. In the double-blind study, samples are processed and shipped from the collection site to provide information on bias and variance attributable to routine shipping, processing, and handling steps. The double-blind study also augments information on the bias, precision, and accuracy of suspended-sediment data provided by the single-blind studies (U.S. Geological Survey, Office of Surface Water Technical Memorandum No. 98.05, 1998).
SUMMARY
The U.S. Geological Survey (USGS) is the leading agency in assessing the Nation’s water quality. Sediment is the largest contaminant of surface water by weight and volume, and sediments and sedimentary processes along with human influences can have substantial long-term effects on the biological community’s aquatic habitats, such as spawning beds. Determining the prevailing hydrological conditions that lead to sediment erosion, transportation, or accumulation requires continuous monitoring and sampling. It is important for the USGS to have the ability to compute the suspended-sediment and total-sediment discharge and the probable volume and specific weight of exposed and submerged river and reservoir deposits. To be able to study sediment effectively, the USGS operates sediment laboratories that determine the suspended-sediment concentration and sand/fine separations of fluvial samples. In 1996 the USGS began the Sediment Laboratory Quality-Assurance (SLQA) project to provide information on the bias and variability of the data received from its sediment laboratories.
For each participating laboratory, percent differences
for suspended sediment concentration, mass of fine- and sand-size material, and
net sediment mass were tabulated for the seven studies completed between August
1996 and July 1999. The median
differences between the reported and known values can be used as an indication
of laboratory bias. For example, if a
laboratory showed no bias, then the median percent difference for that
laboratory would be zero. From the
first seven SLQA studies, the overall median percent difference for suspended-sediment
concentration on an individual laboratory basis showed a negative bias that
ranged from –6.80 to –0.34 percent.
There was less variability in the median difference for the measured
mass of fine-size material than for sand-size material. The overall median
percent difference for the mass of fine-size material ranged from –9.21 to
–3.35 percent, compared to the mass of sand-size material, which ranged from
–0.92 to 28.93 percent.
In 1999, the SLQA project was expanded to include transboundary studies and a new double-blind study. The participation of sediment laboratories associated with other Federal agencies and laboratories in Canada provide an additional benchmark for assessing the performance of USGS laboratories. The double-blind study was introduced to supplement information on the bias, precision, and accuracy of suspended-sediment data provided by the current single-blind studies.
REFERENCES
American Public Health Association, 1995, Standard Methods for the Examination of Water and Wastewater—2540B, Washington, D.C., p. 2-53-2-56.
American Standards for Testing and Materials (ASTM) Designation 2540D, 1980, Standard Practice for Determining Suspended-Sediment Concentration in Water Samples, Philadelphia, ASTM, v. 31, p. 1264-1272.
Fetter, C.W., 1988, Applied hydrogeology: New York, Macmillan Publishing Company, p. 576.
Gordon, John D.,
Newland, Carla A., and Gagliardi, Shane T., 1999, Laboratory performance in the
Sediment Laboratory Quality-Assurance Project, 1996-98: U.S. Geological Survey
Water-Resources Investigations Report 99-4189, p. 16-18, 32, 38, 123.
Guy, Harold P., 1969, Laboratory theory and methods for sediment analysis: U.S. Geological Survey Techniques of Water Resources Investigations, book 5, chap. C1, 58 p.
Koltun, G.F., Landers, M.N., Nolan, K.M., and Parker, R.S., 1997, Sediment transport and geomorphology issues in the Water Resources Division: Proceedings of the U.S. Geological Survey Sediment Workshop, Reston, Virginia, February 4-7, 1997, p. 1.
Linsley, R.K., and Franzini, J.B., 1972, Water-resources engineering: New York, McGraw-Hill, Inc., p. 444.
U.S. Environmental Protection Agency, 1998, Report of the Federal Advisory Committee on the Total Maximum Daily Load (TMDL) Program: The National Advisory Council for Environmental Policy and Technology, EPA 100-R-98-006, 97 p., 7 appendixes
U.S. Geological Survey, 1997, TMDL—Should USGS be doing something?: U.S. Geological Survey, Office of Water Quality Technical Memorandum No. 97.05, issued February 19, 1997, at URL https://water.usgs.gov/admin/memo/QW/qw97.05.txt
U.S. Geological Survey, 1998, A national quality
assurance project for sediment laboratories operated or used by the Water
Resource Division: U.S. Geological
Survey, Office of Surface Water Technical Memorandum No. 98.05, issued March 2,
1998, at URL https://water.usgs.gov/admin/memo/SW/sw98.05.txt
--John Gordon and Carla Newland
Information on technical reports and data related to the Sediment Laboratory Quality Assurance Project can be obtained from:
Natalie Latysh
Sediment Laboratory Quality Assurance Project Chief
U.S. Geological Survey
Denver Federal Center
Denver CO 80225
303/236-1874
The SLQA project is one component of a national program to
quality assure sediment data produced by laboratories operated
or used by the U.S. Geological Survey, Water Resources
Division (WRD). The other components are: training in laboratory operational
procedures, on-site laboratory evaluations and documentation of laboratory
quality-assurance plans and quality control procedures. Questions regarding the
other components of the national program to quality assure sediment data can be
addressed to :
John Gray
Sediment Specialist
U.S. Geological Survey, Office of Surface Water
415 National Center, 12201
Sunrise Valley Drive
Reston, VA 20192
703/648-5318

Fact Sheet FS-031-00