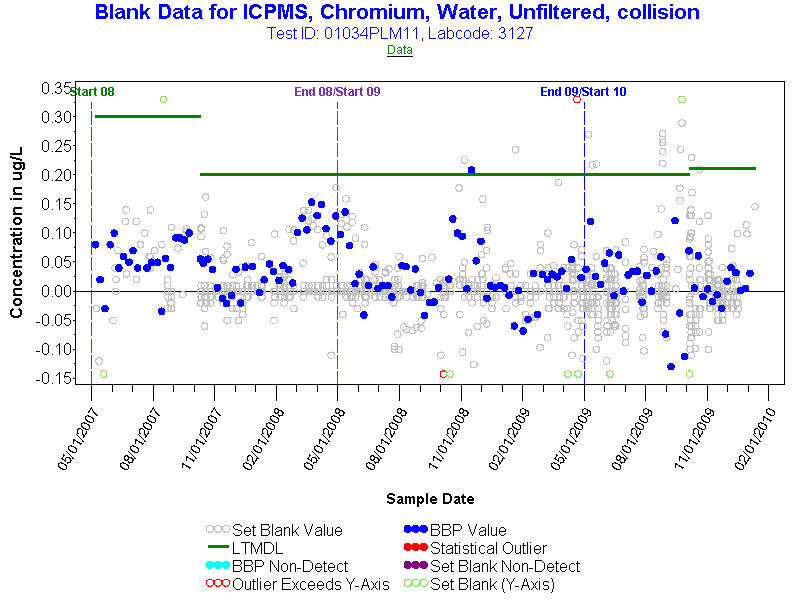
An explanatory scattergram that explains the various features of the blank data represented. Mouse-over the various items within the chart for the explanation.