Box plots display the distribution of data by using a rectangular box and whiskers. Whiskers are lines that indicate a data range outside of the box.
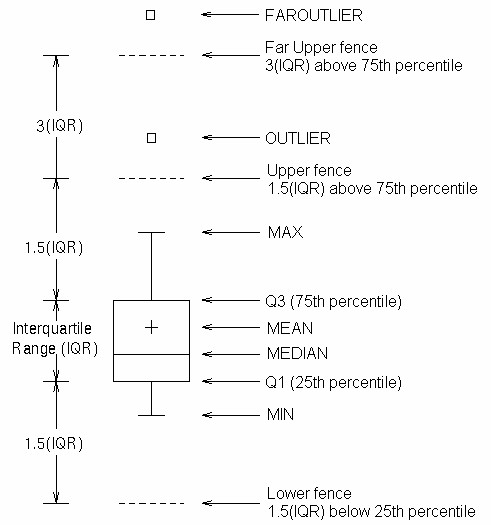
Image and description taken from SAS/Graph(R) 9.2: Statistical Graphics Porcedures Guide, Second Edition (https://support.sas.com/documentation/cdl/en/grstatproc/62603//HTML/default/viewer.htm#vbox-stmt.htm, accessed February, 24, 2017).

![]() U.S.
Department of the Interior | U.S. Geological Survey
U.S.
Department of the Interior | U.S. Geological Survey
Web Site Questions? Contact the listed Project Chief
