![]()
The Branch of Technical Development and Quality Systems (BTD&QS) operates the Blind Sample Project (BSP). One of the goals of the Blind Sample Project is to document variability and bias for the NWQL and Ocala QWSU through the use of double-blind quality-assurance samples. The quality-assurance results are stored in a SAS database, on the BTD&QS Windows NT under a program named "QADATA". This program is accessed via a DG/UX terminal and available to all WRD personnel. QADATA instructions are available on the BTD&QS home page.
The Blind Sample Project has not sent a QADATA summary
since April 1996 due to development &
programming of the new QADATA system. We apologize
for any inconvenience that this delay may have caused. Starting
with this summary the BSP intends to send the QADATA summary
bi-monthly.
The QADATA Summary is the Blind Sample Project's cursury review
of the NWQL and QWSU results on the quality assurance
samples. The data reviewed is for the time
period of 11/1/96 - 5/1/97, released from
the labs as of 5/20/97. For this 6-month time period, 96
determinations at the NWQL and 40 determinations
at the Ocala lab were quality assured. The
summary is intended to be a timely, initial review of the laboratories'
performance on blind quality- assurance samples.
District personnel can improve the quality of their data by requesting
reruns from the NWQL or QWSU; both labs provide free re-analysis
of determinations. WRD projects can document NWQL and QWSU variability
and bias by tailoring a QADATA retrieval to
parallel their project's sampling period.
This report was compiled by Amy Ludtke and Mark Woodworth.
The control plots, precision plots, and statistical
summaries used for the QADATA summary are
available on request. Please address any questions,
comments, or changes in distribution to:
Amy Ludtke
e-mail: asludtke@usgs.gov
phone: (303) 236-1870, ext. 314
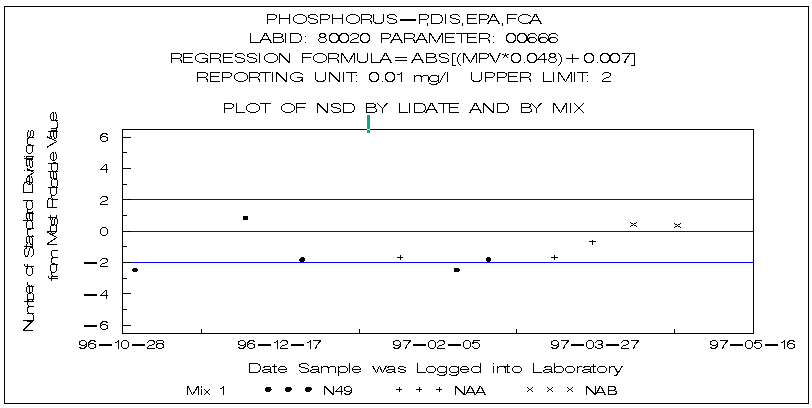
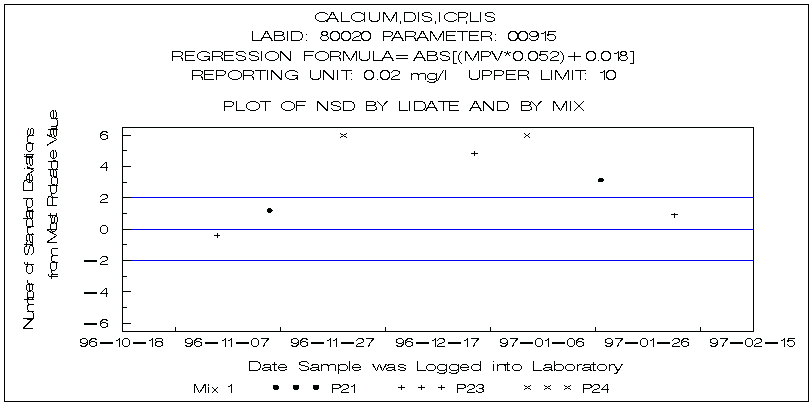
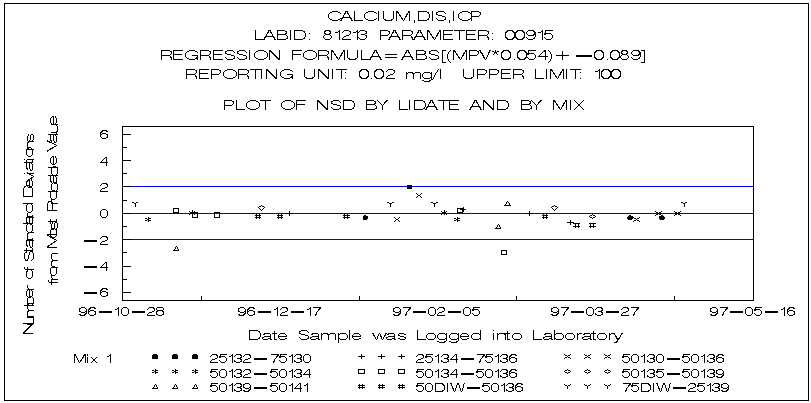
It appears that there could be a problem with the control
limits for calcium in P-24. Because of the limited amount of QC
available for these blind sample charts, it is difficult to do
a thorough evaluation at this time. In addition, the Plasma group
does not presently use the same QC samples submitted through the
blind QC program for the on-line ICP QC. However, to better evaluate
the blind QC submitted. the Plasma group will start accumulating
data for the same QC submitted for the blind QC program. See the
Mn response for rationale.
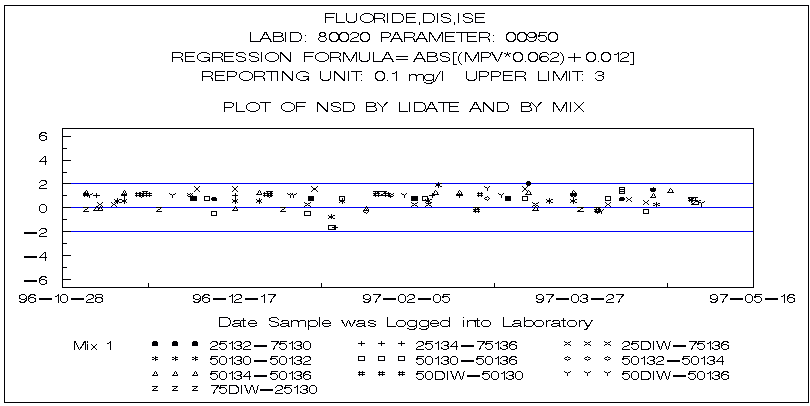
Problems with the fluoride ion selective electrode meter were
resolved in April, 1996. The fluoride system has been running
well since that time.
Troubleshooting efforts have been on-going since November
1996 to determine the cause of the bias and variability shown
by arsenic analysis at the NWQL. Sample results have not been
released unless data for all of the on-line QC samples were within
acceptance limits. We are exerting considerable effort to transfer
the arsenic analysis to the graphite furnance atomic absorption
method, which is much more precise and reliable.
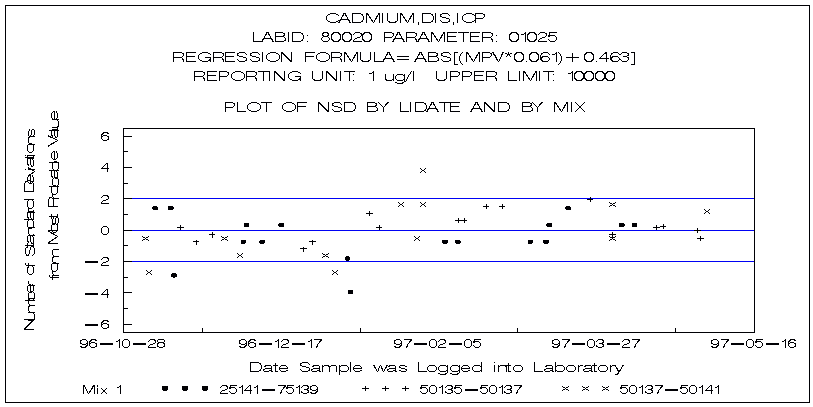
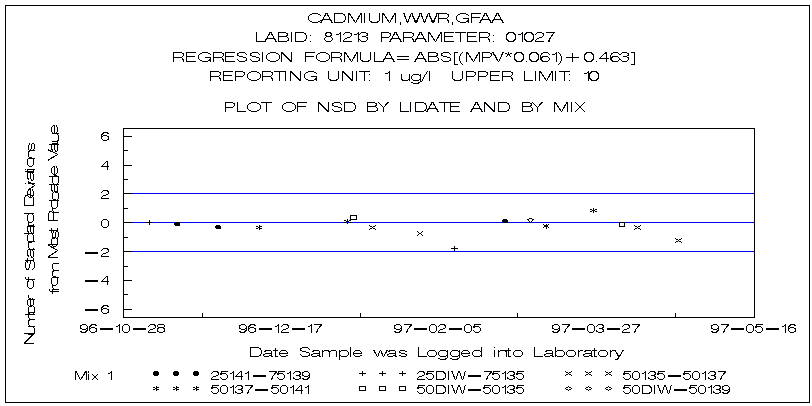
The variation shown is the level of precision typically demonstrated
by the ICP-OES technique. Most blind samples submitted have concentrations
and limits that are too tight for the ICP-OES technique and are
more applicable to the ICP-MS or GFAA techniques. This can be
demonstrated by the results for Mix #50135-50137, which includes
SRWS T-135 which has a cadmium concentration more than five times
greater than the other SRWS's shown on the chart. These data for
Mix #50135-50137 have no points outside of +/- 2 standard deviations.
The ICP-OES chart demonstrates similar precision in past BTD&QS
charts.
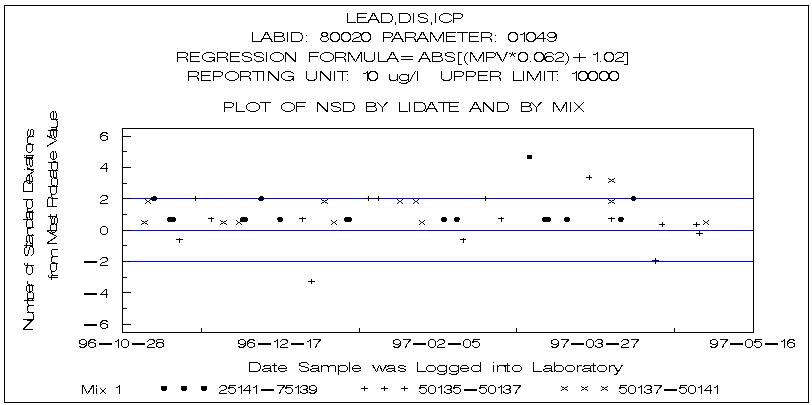
The variation shown is the level of precision typically demonstrated
by the ICP-OES technique. The limits and concentrations submitted
for Pb determination by ICP are too tight for ICP-OES: the control
limits appearto be biased by the more precise analytical systems
for Pb such as GFAA and ICP-MS. The ICP-OES chart demonstrates
similar precision compared to past BTD&QS charts.
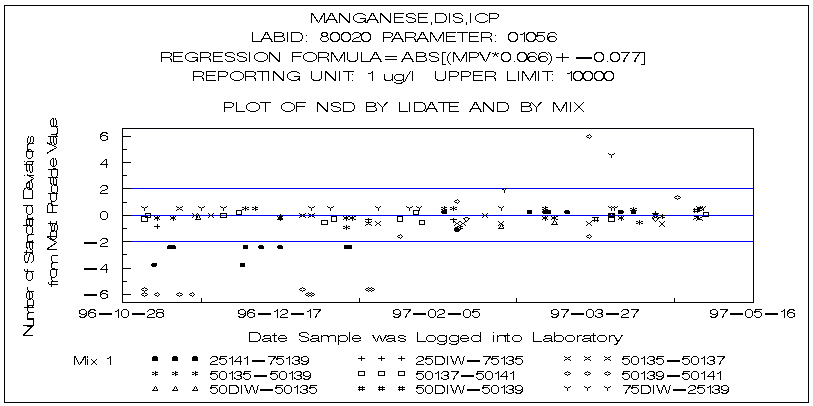
All of the results outside of minus two standard deviations
are from amix that includes SRWS T-141. This SRWS has demonstrated
erratic behavior for manganese and therefore cannot be considered
when assessing analytical control for manganese. Documentation
regarding this problem was recently sent to BTD&QS. It is
recommended that a mix containing SRWS T-141 not be used for the
QA of Mn.
The BSP will discuss this issue at an upcoming NWQL Inorganic
Quality Assurance meeting. At issue will be why these same mixes
came back into control beginning in Jan. 1997. The results of
any findings will be posted in an upcoming QADATA summary.
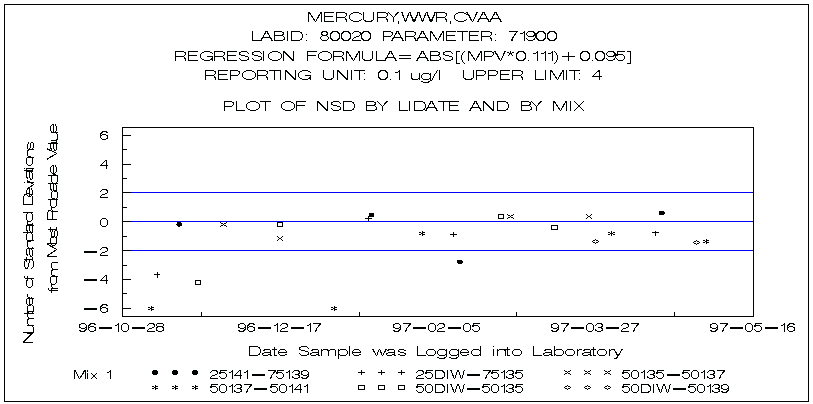
Values that were outside the 2-sigma control limits were due
to transcription errors. The present manual data transfer program
for WWR mercury determinations automatically enters default values
for all the samples and then the analyst must edit the default
values. We are in the process of revising the data entry program.
This new procedure will prompt the analyst to enter all values
twice as performed in other manual data entry processes. This
will minimize data entry errors.
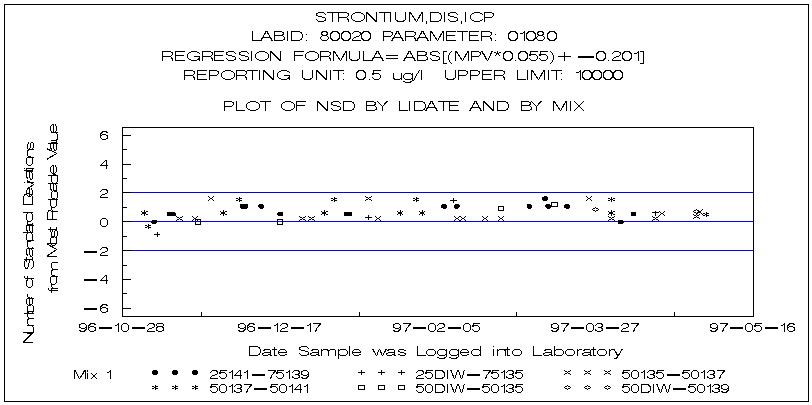
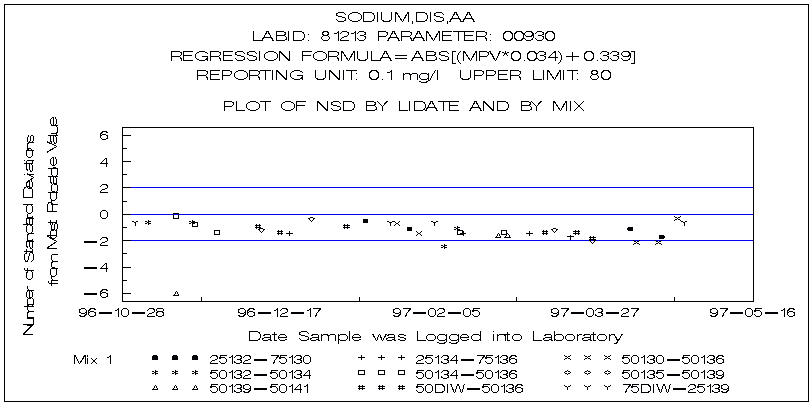
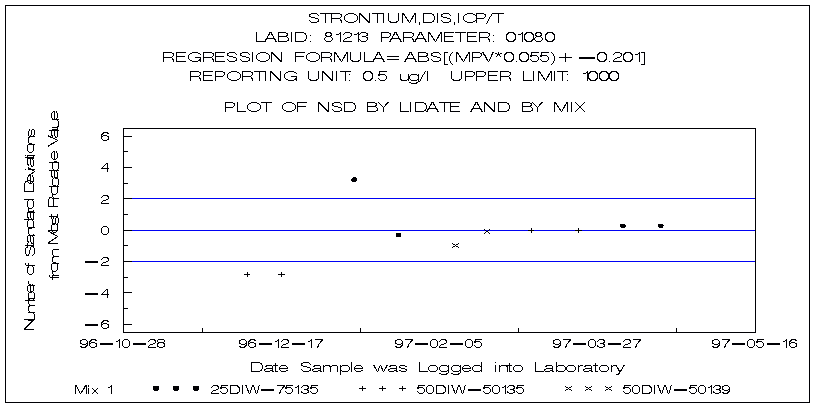
Around October-November 1996, strontium determinations by ICP-OES began to exhibit a slightly high bias but within the control limits. Action was taken at that time which seemed to shift the overall results for strontium slightly downward. The actions taken did not have the results anticipated, therefore, the matter is still under investigation and will continue to be until the control charts demonstrate a more acceptable bias or no bias at all.
We are currently checking our stock standards. Our internal
control charts show a slight high bias. This could also be a problem
with the computer program that integrates the chromatograms.
New commercial stock standards were ordered. When new working
standards were made, the bias was no longer there. The working
standards will be made more often.
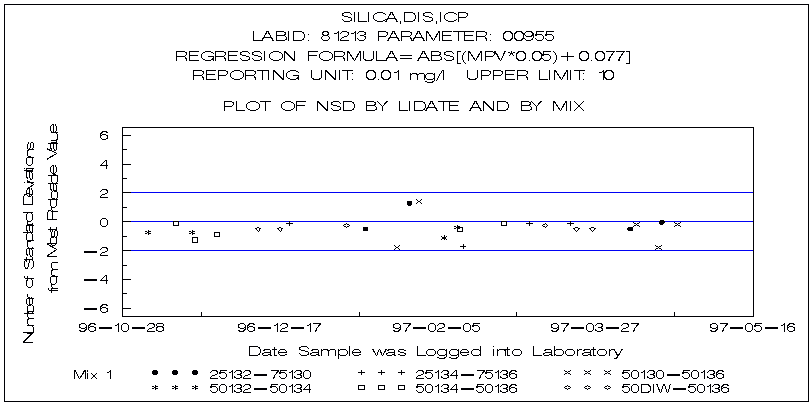
Our internal control charts do not show a low bias for silica. The low bias seen in the blind samples could be due to the dilution when they are acidified. Most are less than 2% below the MPV. We will check this further.
The variance in the strontium data was due to the rounding algorithm used on our computer system. The raw data did not show any significant variance. When the algorithm was changed, the variance improved.
![]()
![]() Return
to the QADATA Summary Listing
Return
to the QADATA Summary Listing
![]() Return
to BTD&QS Home Page
Return
to BTD&QS Home Page