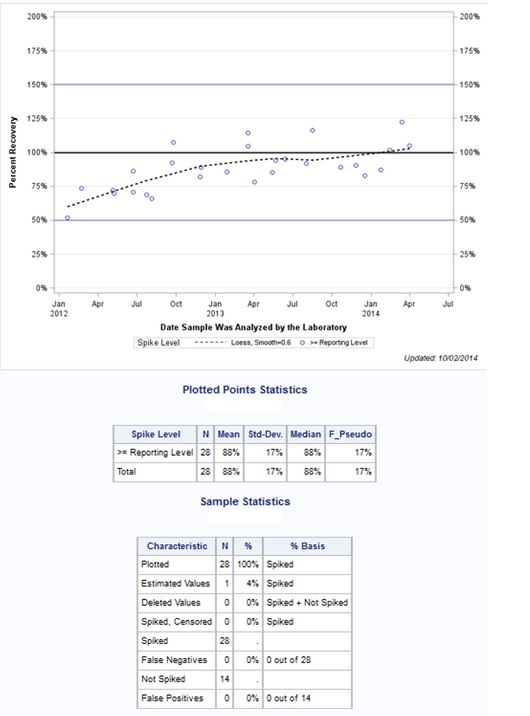
The Time Series Charts
The charts provide OBSP recovery information for every analyte at different concentrations for every schedule
OBSP assesses. The charts exhibit a Locally Weighted Scatterplot Smoothing (LOWESS) line.
This line is used to help observe patterns and trends of the data over time. The time series charts also show bias
and variability of the OSBP data. The most current time series charts in the table below will be overwritten periodically and will contain data that is currently being reviewed.
All data is provisional and may change if the OBSP deems necessary.
There are two tables provided at the bottom of every time series chart that show statistical summaries.
Plotted Points Statistics Table
Description of the OBSP QA recoveries grouped by concentration level. The statistics in the table: mean, median, standard deviation and F-pseudosigma
define bias and variability of the OBSP recoveries.
Sample Statistics Table
Counts (N) - The quantity of the variety of items.
Plotted - This number equals the total number in the above table.
Estimated Values - There are a number of reasons the laboratory will
estimate (E) a result.
If there are 100% of the results estimated the analyte is identified as a permanently estimated compound (analyte name in time series chart will be red).
Deleted Values - The laboratory may delete an entire sample or a single analyte for a number of reasons.
Spiked, Censored - A term for those samples that were spiked and correctly reported as less than a reporting level (possibly a raised reporting level) - the
expected concentration was at a lower concentration than the censored result provided by the laboratory.
Spiked - The number of times the OBSP has submitted this analyte to the NWQL.
False Negative - The number of times the laboratory reports this analyte as not present in the sample when it is there.
Not Spiked - The number of times the OBSP has submitted a sample to the appropriate schedule, without this analyte.
False Positive - The number of times the laboratory reports this analyte as present when it is not in the sample.
Note: If an analyte of interest is not seen in the method listing, there is no OBSP data available for that analyte