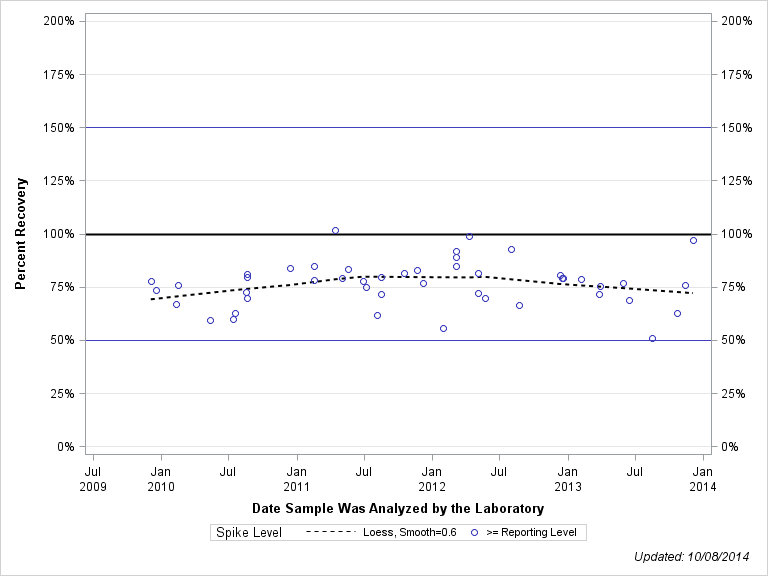
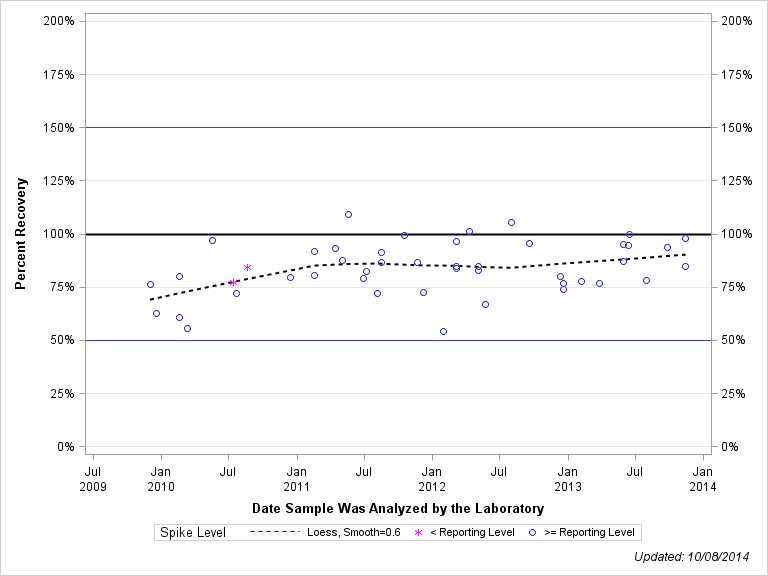
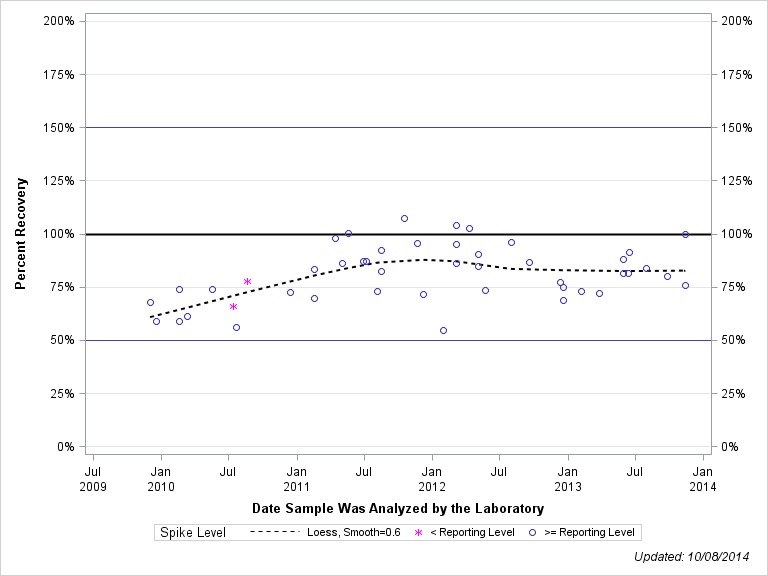
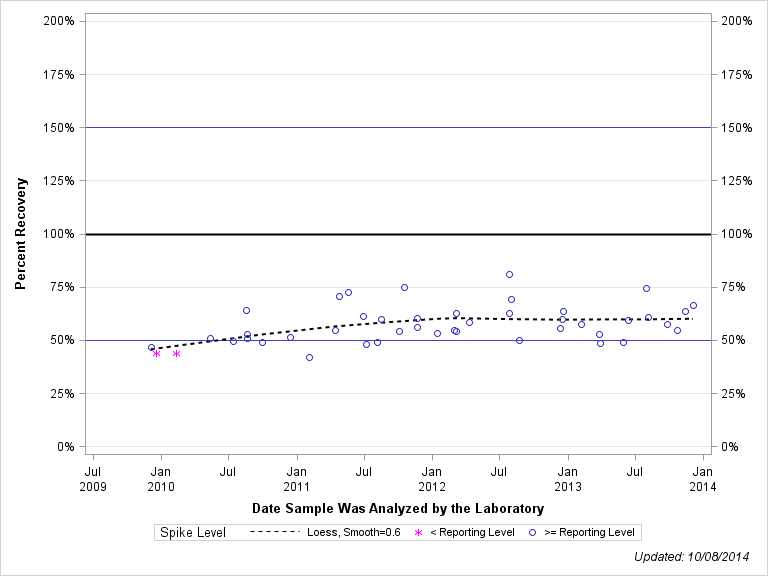
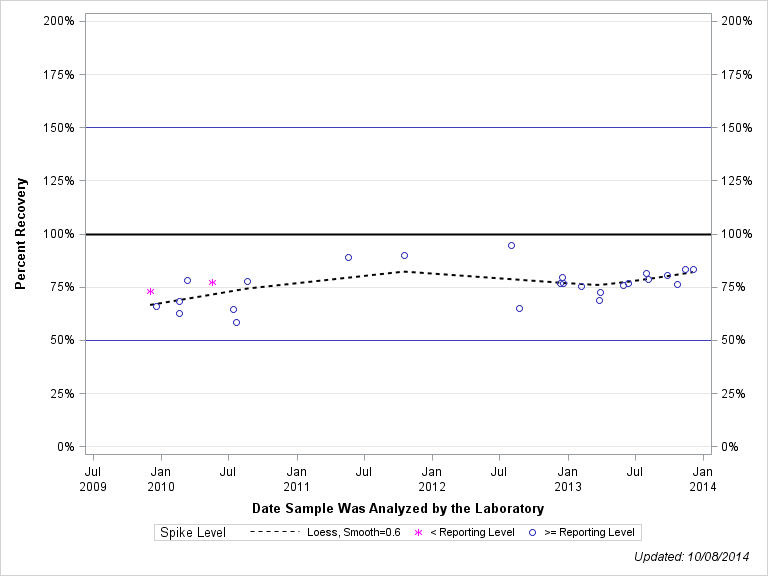
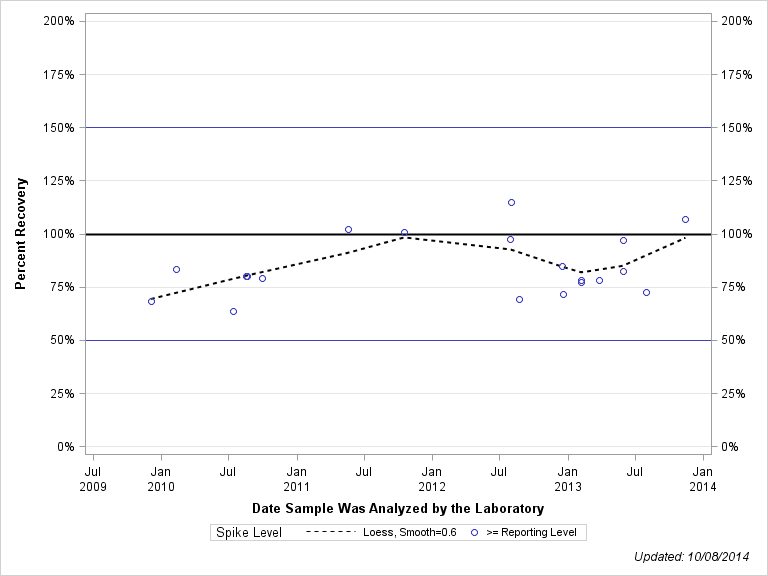
| BQS OBSP Determination: |
| 1,4-DICHLOROBENZENE |
| SCHEDULE: 4433 , TESTIDCODE: 34571GCM99 |
| Open Data Set |
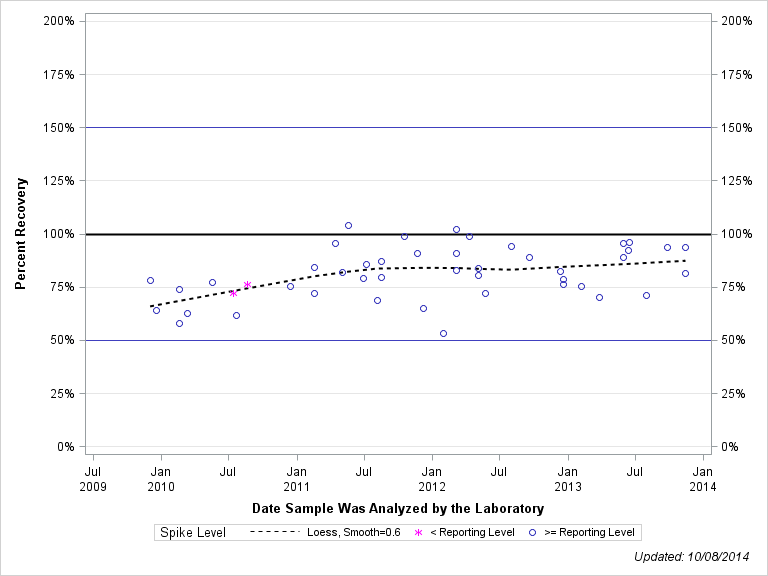
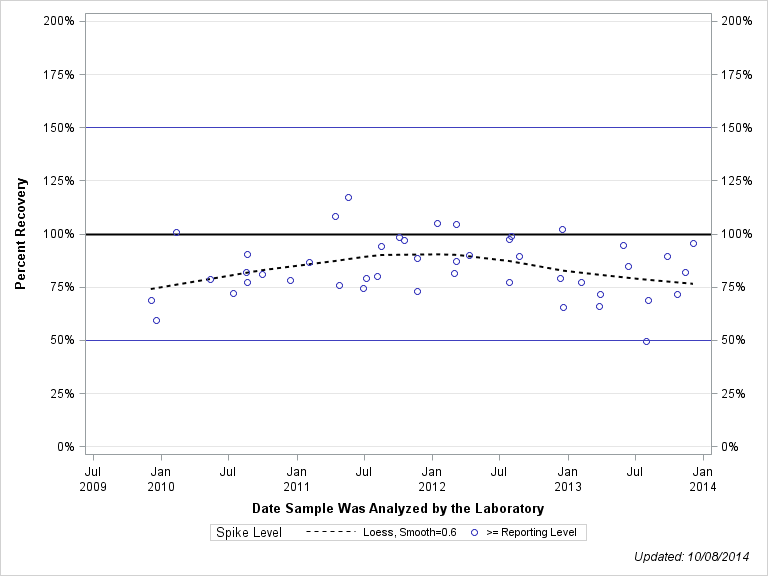
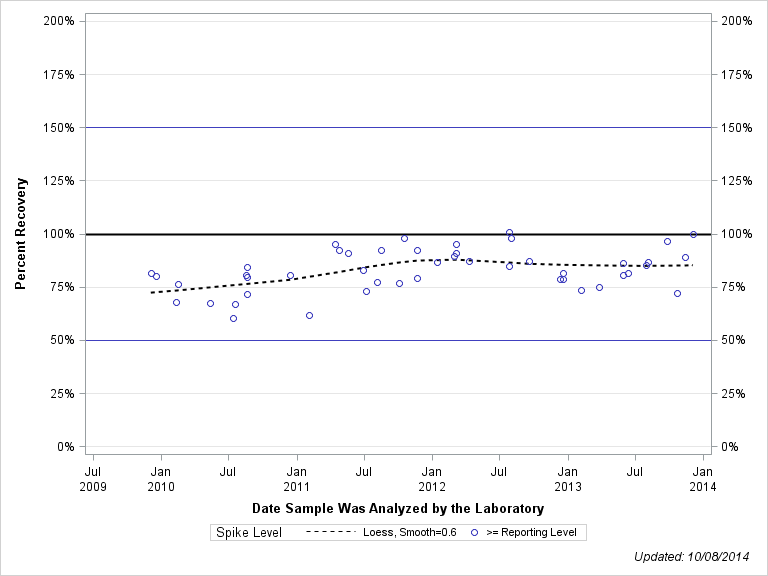
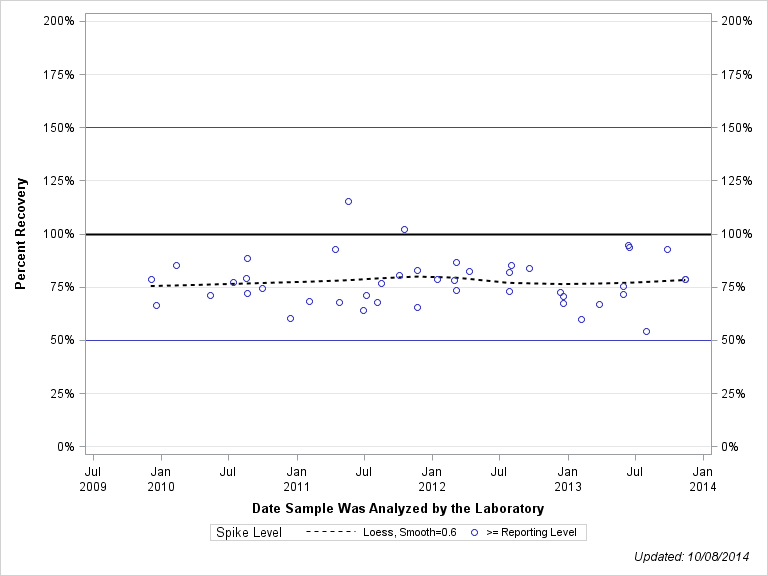
| Plotted Points Statistics |
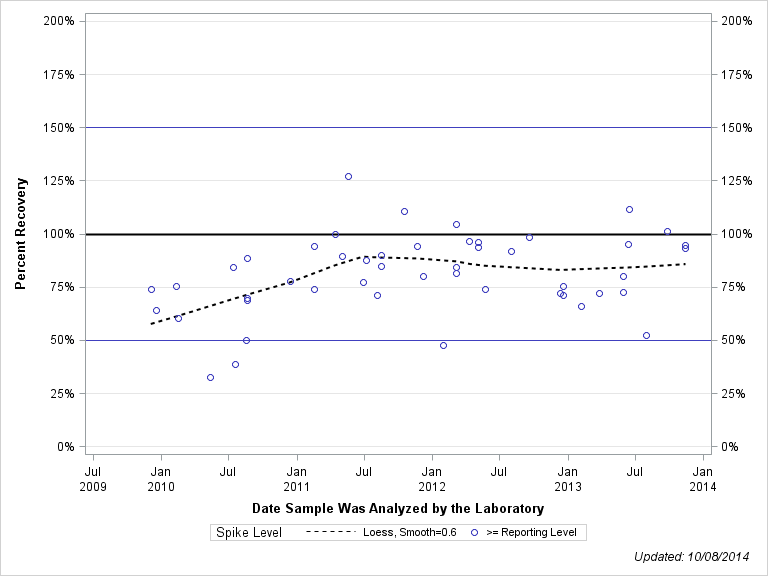
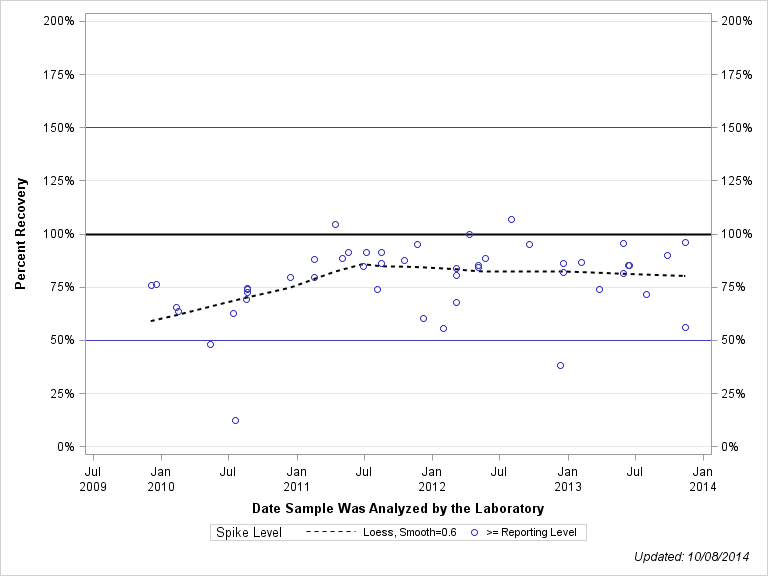
| 1,4-DICHLOROBENZENE |
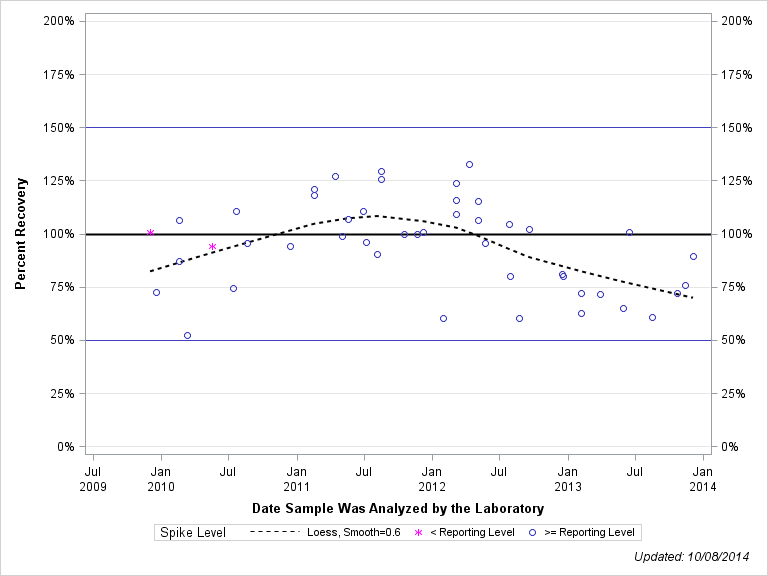
| Spike Level | N | Mean | Std-Dev. | Median | F_Pseudo |
|---|---|---|---|---|---|
| < Reporting Level | 2 | 75% | 3% | 75% | 3% |
| >= Reporting Level | 25 | 76% | 9% | 77% | 9% |
| Total | 27 | 76% | 9% | 77% | 9% |
| Sample Statistics |
| 1,4-DICHLOROBENZENE |
| Characteristic | N | % | % Basis |
|---|---|---|---|
| Plotted | 27 | 100% | Spiked |
| Estimated Values | 2 | 7% | Spiked |
| Deleted Values | 1 | 1% | Spiked + Not Spiked |
| Spiked, Censored | 0 | 0% | Spiked |
| Spiked | 27 | . | |
| False Negatives | 0 | 0% | 0 out of 27 |
| Not Spiked | 64 | . | |
| False Positives | 0 | 0% | 0 out of 63 |
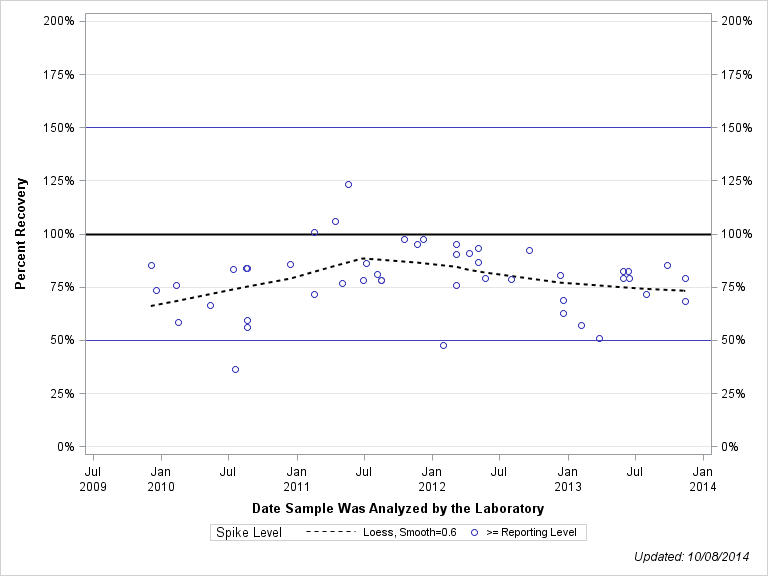
| Plotted Points Statistics |
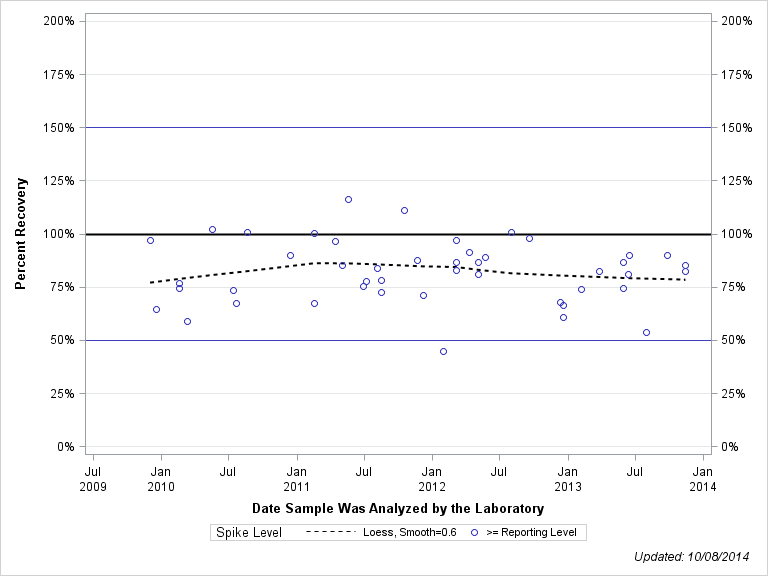
| 1-METHYLNAPHTHALENE |
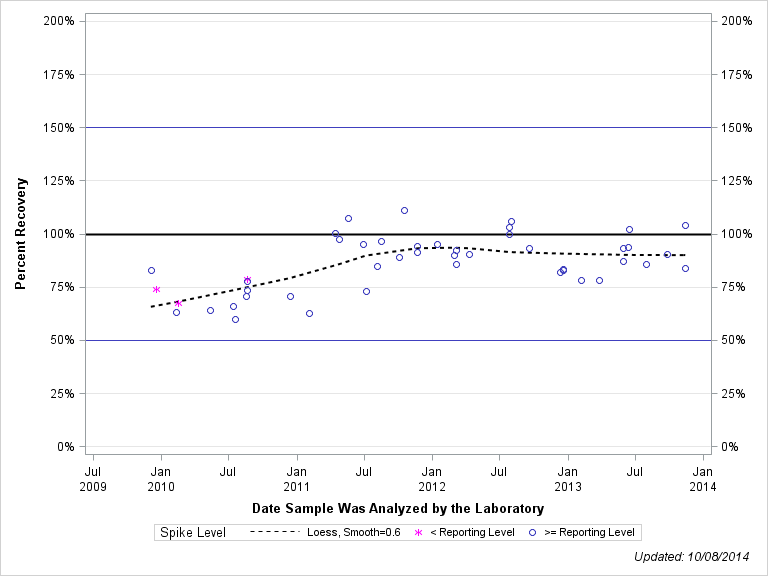
| Spike Level | N | Mean | Std-Dev. | Median | F_Pseudo |
|---|---|---|---|---|---|
| < Reporting Level | 3 | 73% | 6% | 74% | 8% |
| >= Reporting Level | 43 | 87% | 13% | 89% | 13% |
| Total | 46 | 86% | 13% | 87% | 13% |
| Sample Statistics |
| 1-METHYLNAPHTHALENE |
| Characteristic | N | % | % Basis |
|---|---|---|---|
| Plotted | 46 | 100% | Spiked |
| Estimated Values | 8 | 17% | Spiked |
| Deleted Values | 1 | 1% | Spiked + Not Spiked |
| Spiked, Censored | 0 | 0% | Spiked |
| Spiked | 47 | . | |
| False Negatives | 0 | 0% | 0 out of 46 |
| Not Spiked | 44 | . | |
| False Positives | 5 | 11% | 5 out of 44 |
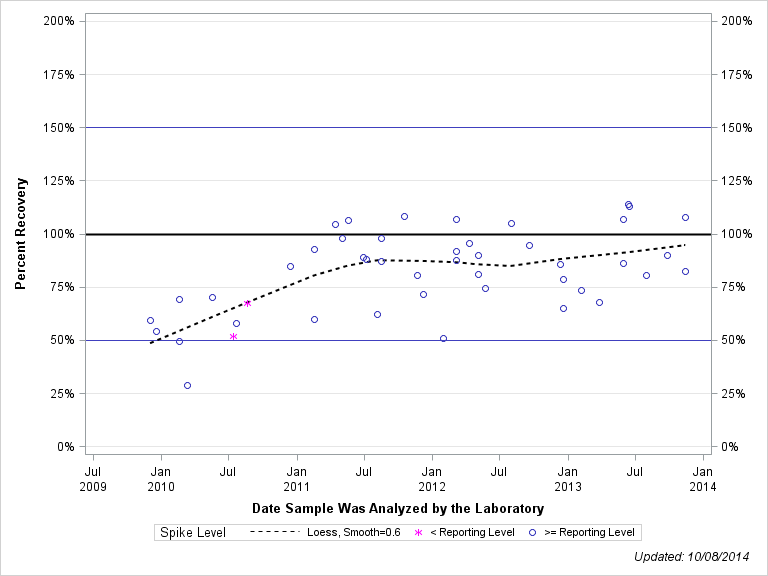
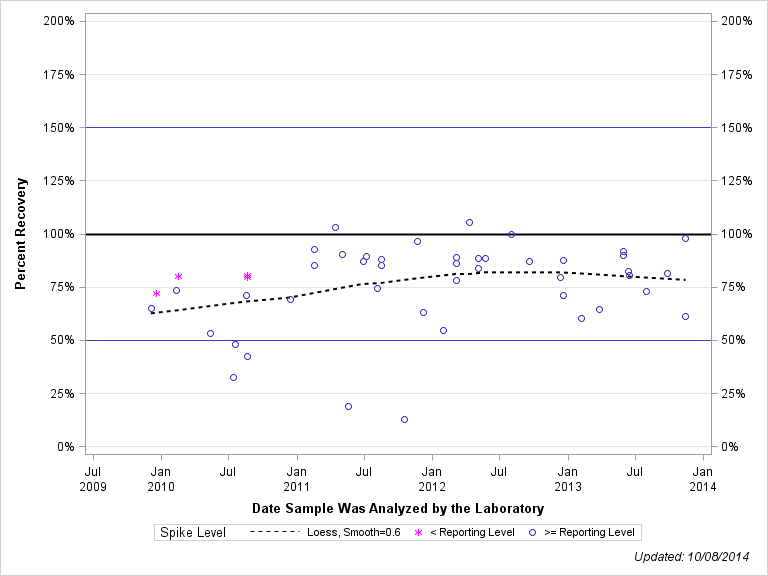
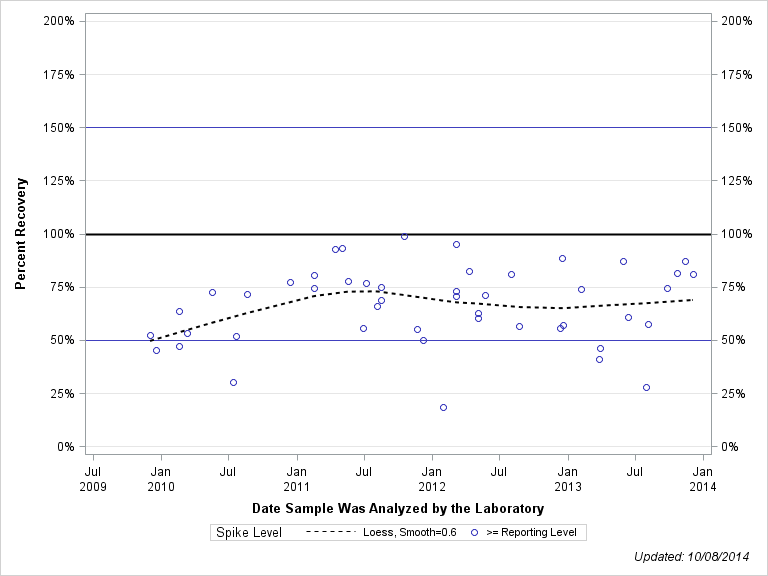
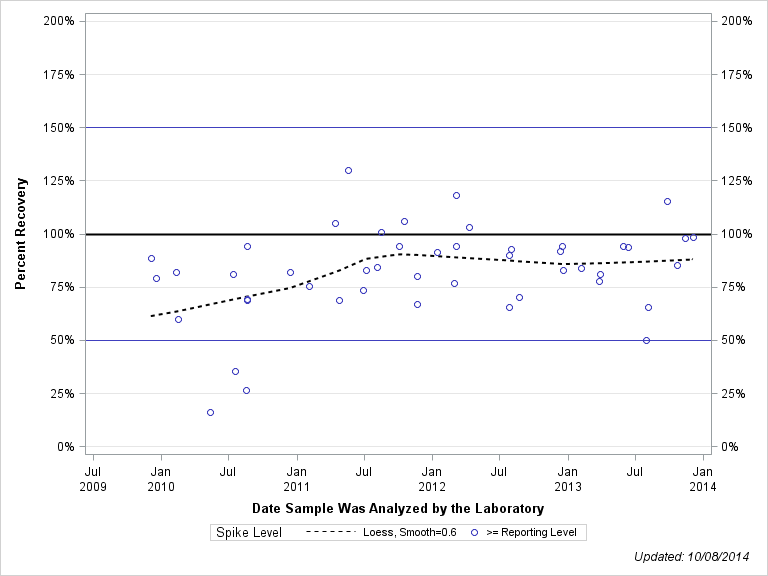
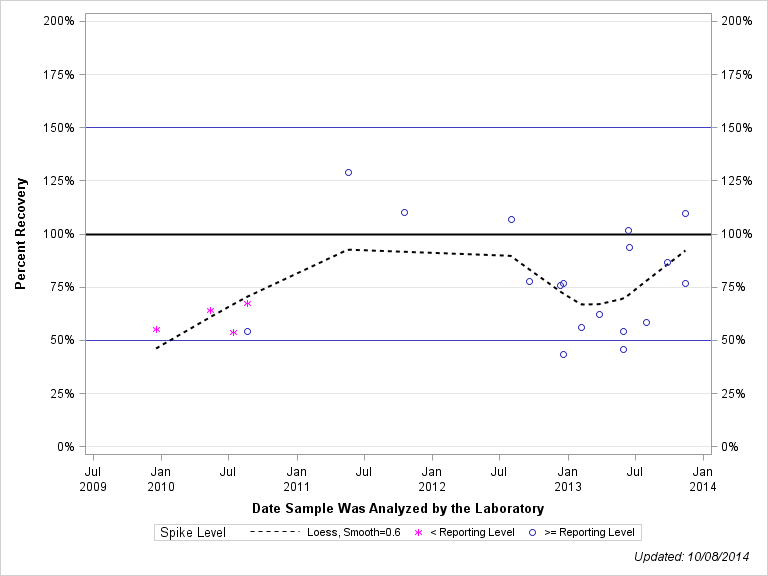
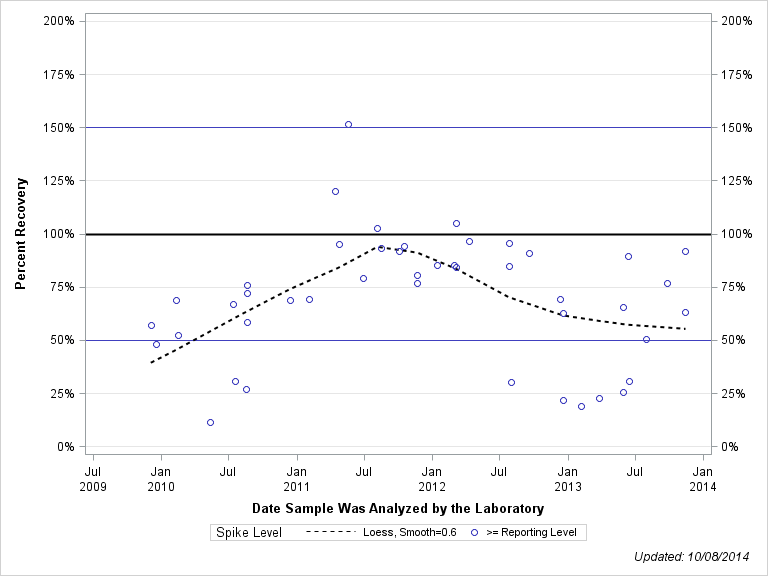
| BQS OBSP Determination: |
| 2,2',4,4'-TETRABROMODIPHENYLETHER (PBDE 47) |
| SCHEDULE: 4433 , TESTIDCODE: 63147GCM99 |
| Open Data Set |
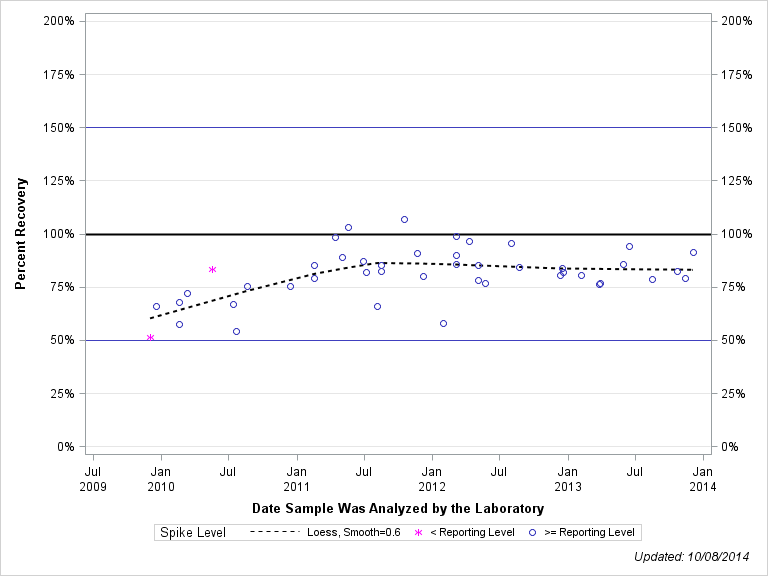
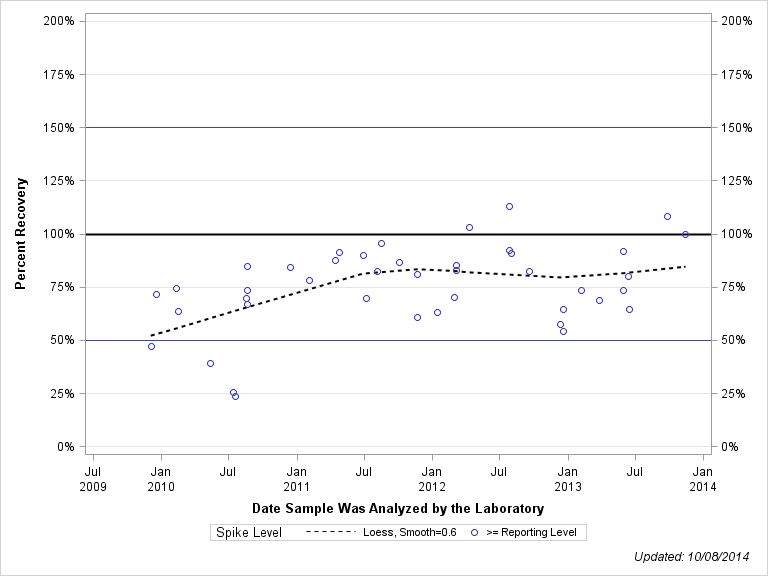
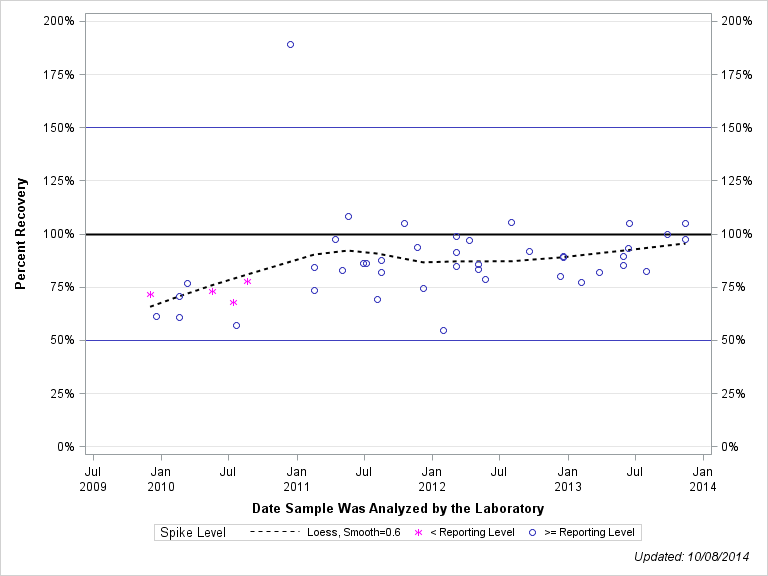
| Plotted Points Statistics |
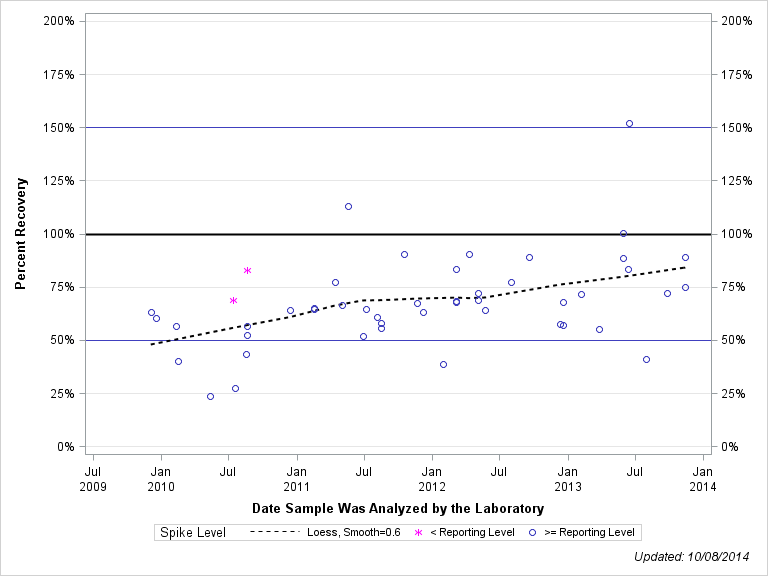
| 2,2',4,4'-TETRABROMODIPHENYLETHER (PBDE 47) |
| Spike Level | N | Mean | Std-Dev. | Median | F_Pseudo |
|---|---|---|---|---|---|
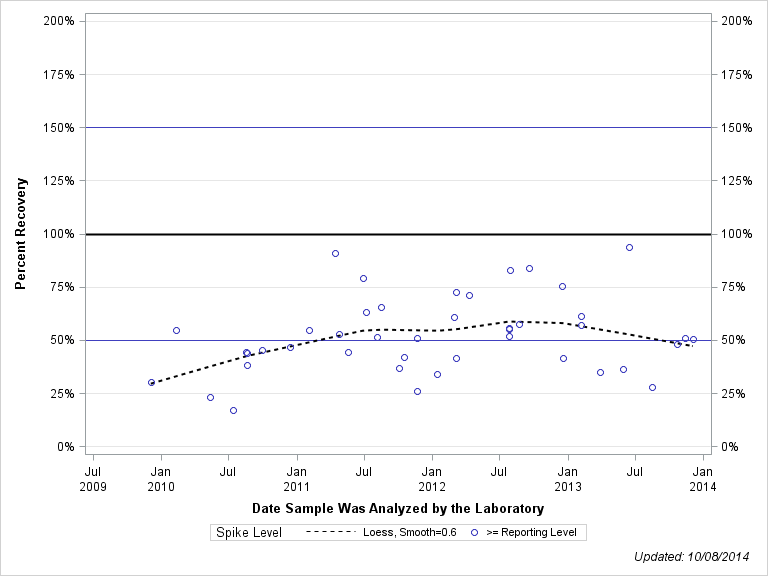
| < Reporting Level | 4 | 60% | 7% | 60% | 9% |
| >= Reporting Level | 18 | 79% | 25% | 77% | 34% |
| Total | 22 | 75% | 24% | 72% | 29% |
| Sample Statistics |
| 2,2',4,4'-TETRABROMODIPHENYLETHER (PBDE 47) |
| Characteristic | N | % | % Basis |
|---|---|---|---|
| Plotted | 22 | 100% | Spiked |
| Estimated Values | 22 | 100% | Spiked |
| Deleted Values | 1 | 1% | Spiked + Not Spiked |
| Spiked, Censored | 0 | 0% | Spiked |
| Spiked | 23 | . | |
| False Negatives | 0 | 0% | 0 out of 22 |
| Not Spiked | 68 | . | |
| False Positives | 0 | 0% | 0 out of 68 |
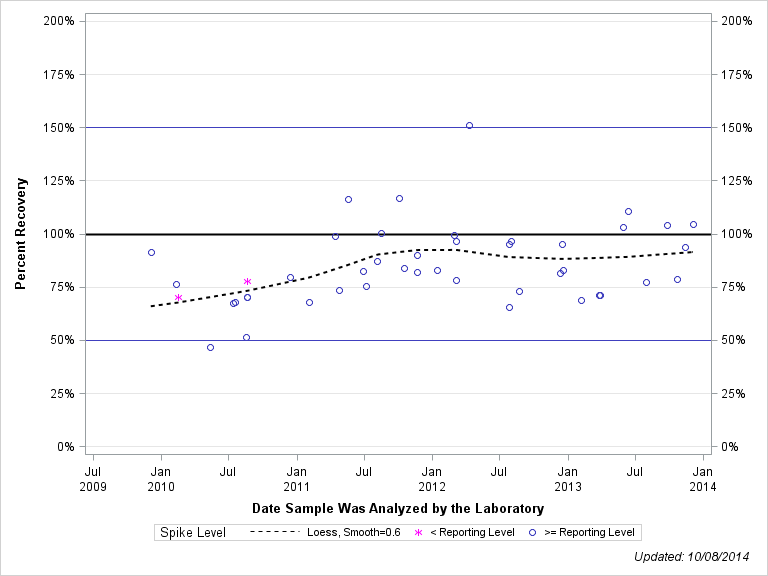
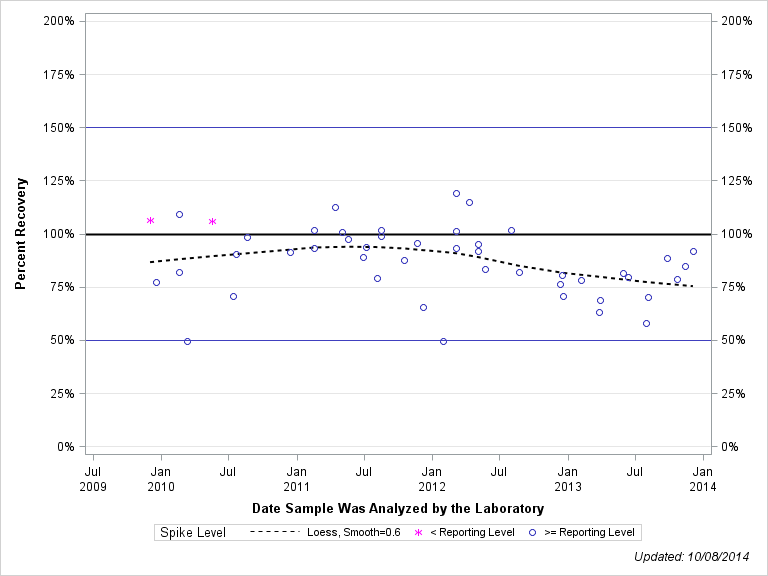
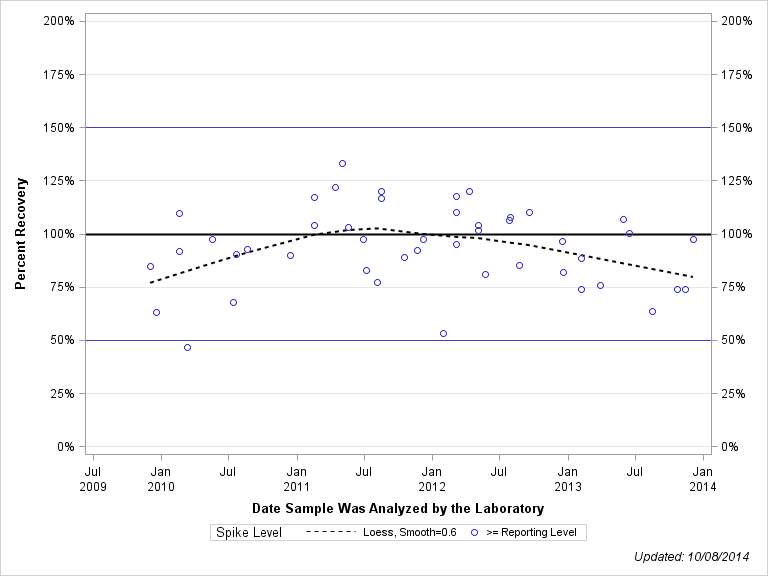
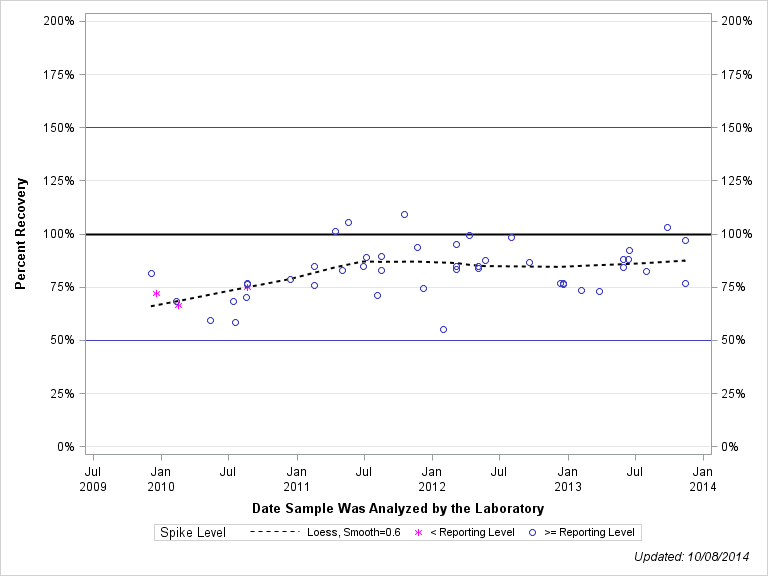
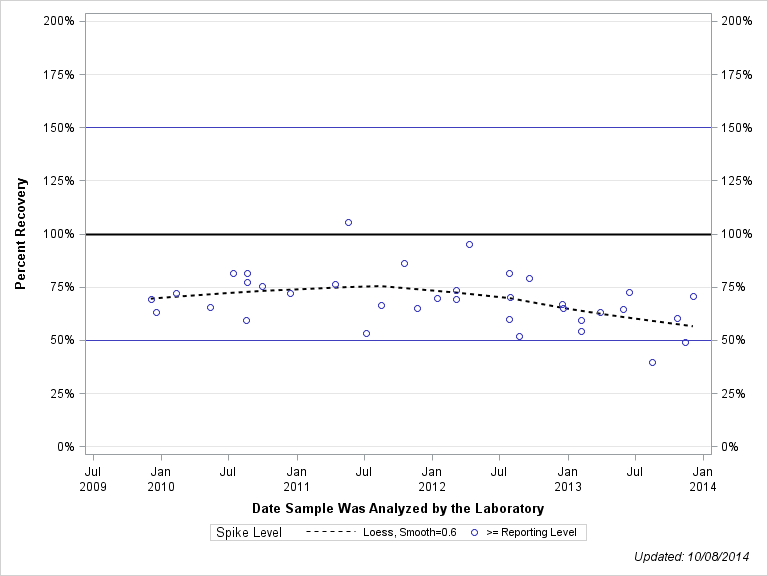
| BQS OBSP Determination: |
| 2,6-DIMETHYLNAPHTHALENE |
| SCHEDULE: 4433 , TESTIDCODE: 62805GCM99 |
| Open Data Set |
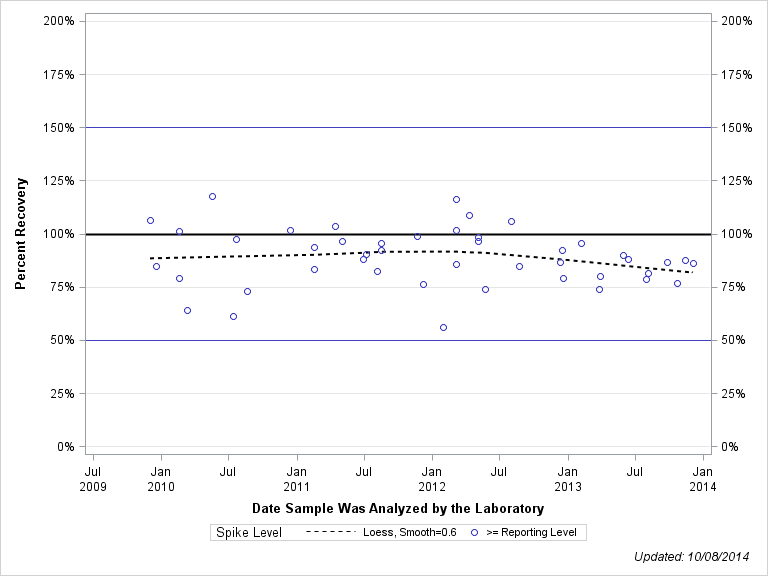
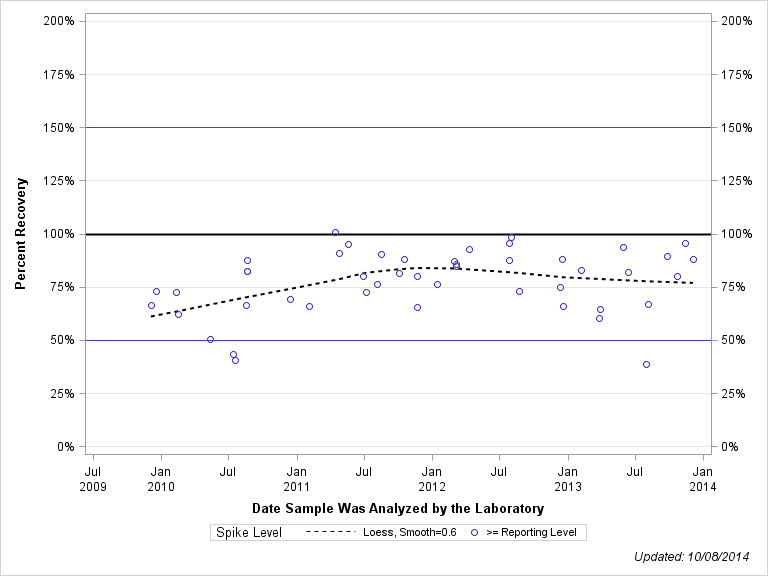
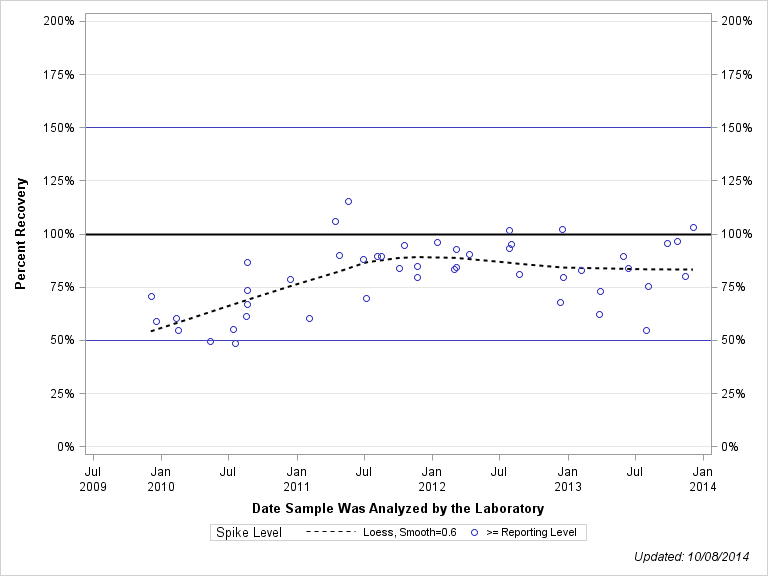
| Plotted Points Statistics |
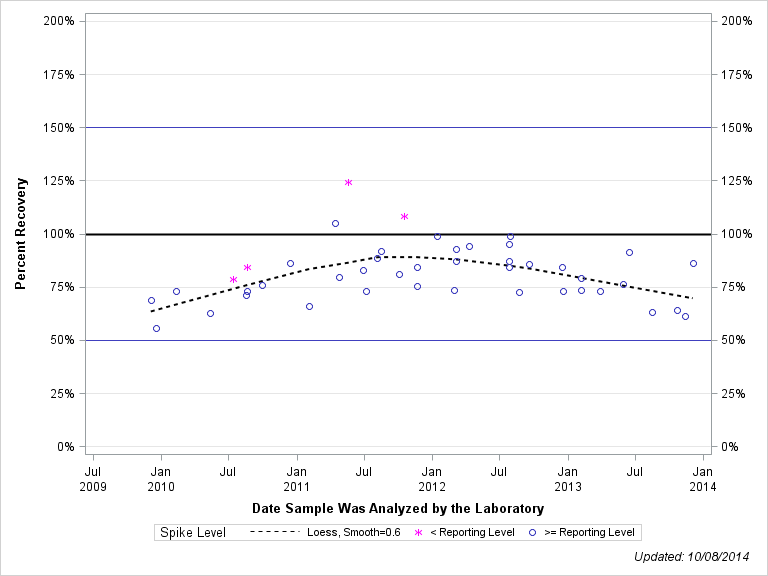
| 2,6-DIMETHYLNAPHTHALENE |
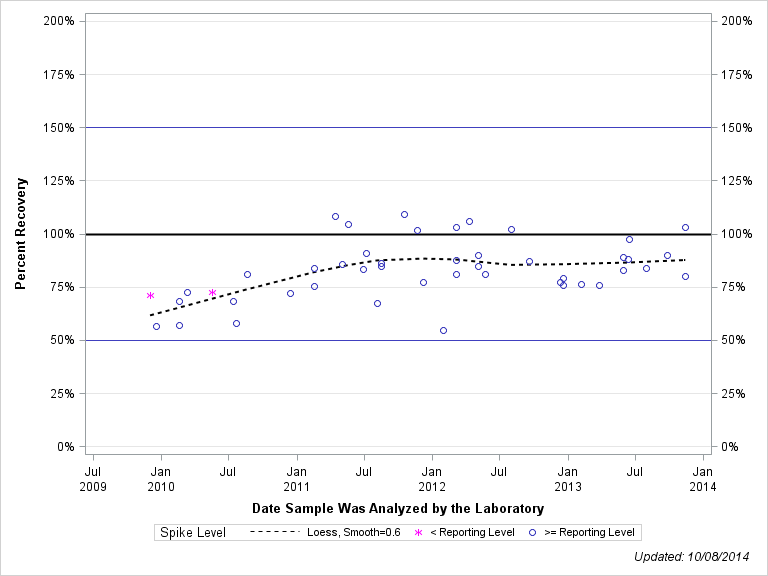
| Spike Level | N | Mean | Std-Dev. | Median | F_Pseudo |
|---|---|---|---|---|---|
| < Reporting Level | 3 | 71% | 4% | 72% | 6% |
| >= Reporting Level | 45 | 83% | 12% | 83% | 10% |
| Total | 48 | 82% | 12% | 83% | 10% |
| Sample Statistics |
| 2,6-DIMETHYLNAPHTHALENE |
| Characteristic | N | % | % Basis |
|---|---|---|---|
| Plotted | 48 | 100% | Spiked |
| Estimated Values | 10 | 21% | Spiked |
| Deleted Values | 1 | 1% | Spiked + Not Spiked |
| Spiked, Censored | 0 | 0% | Spiked |
| Spiked | 49 | . | |
| False Negatives | 0 | 0% | 0 out of 48 |
| Not Spiked | 42 | . | |
| False Positives | 0 | 0% | 0 out of 42 |
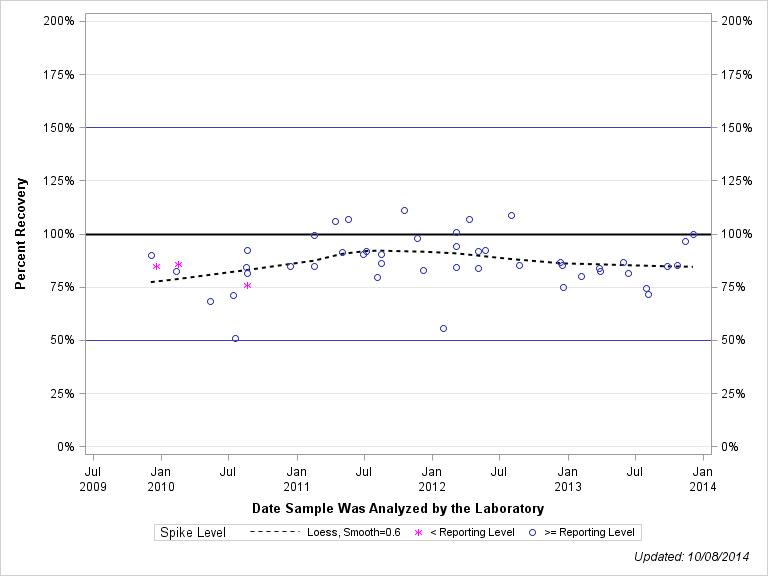
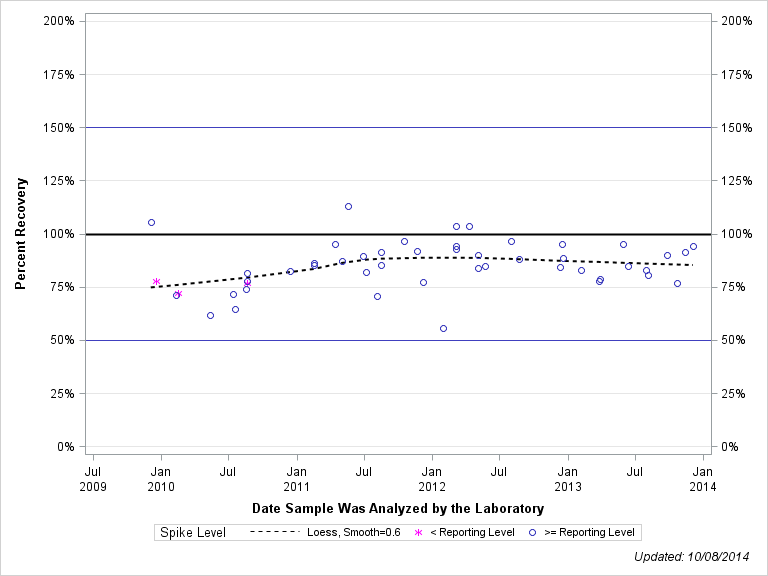
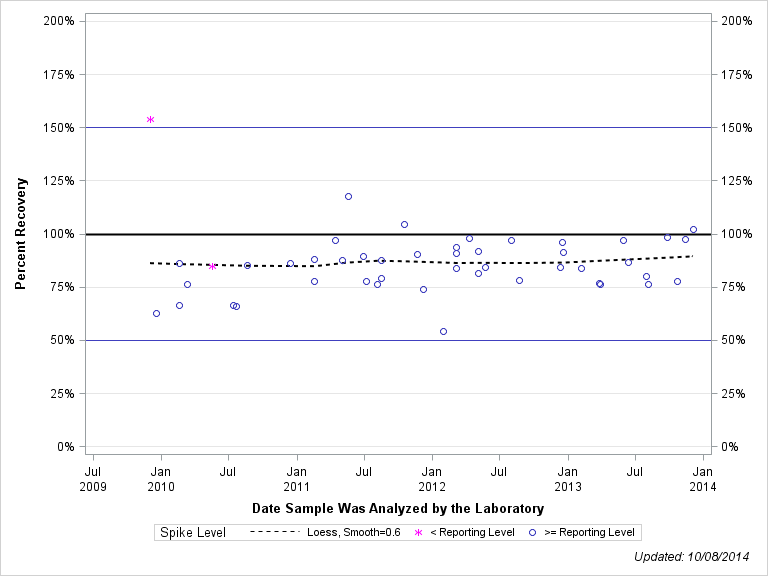
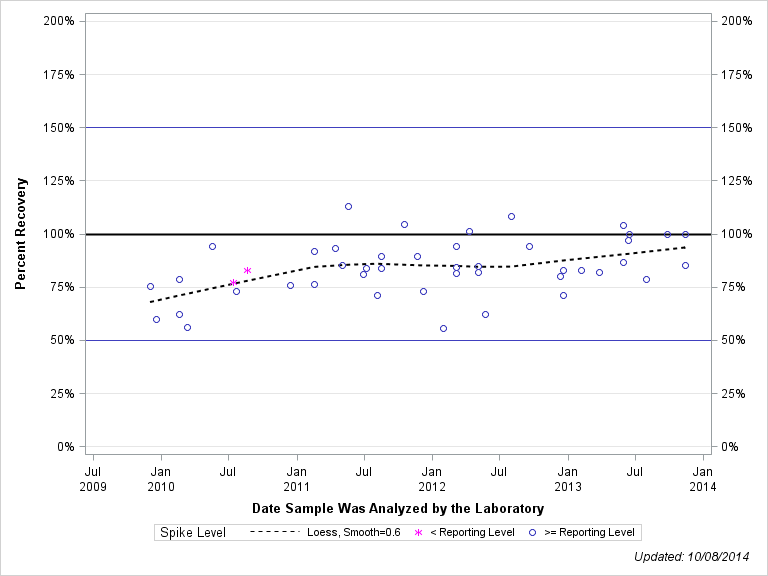
| Plotted Points Statistics |
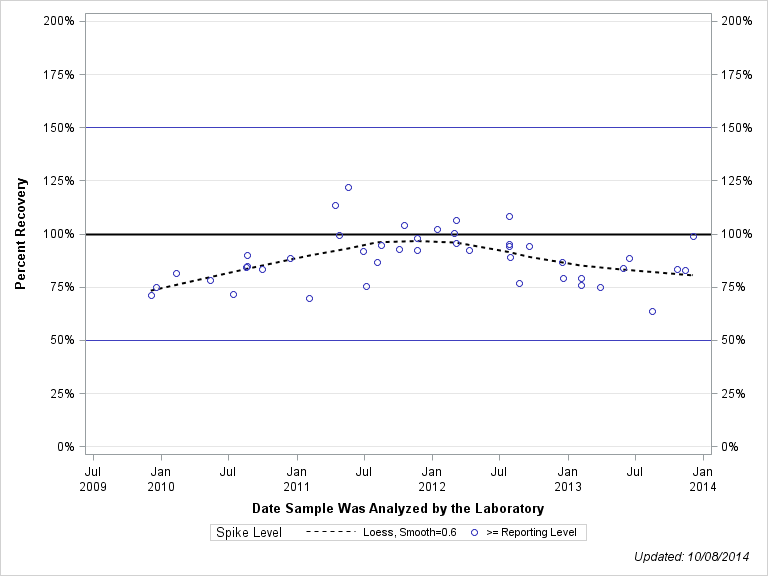
| 2-METHYLNAPHTHALENE |
| Spike Level | N | Mean | Std-Dev. | Median | F_Pseudo |
|---|---|---|---|---|---|
| < Reporting Level | 2 | 72% | 1% | 72% | 1% |
| >= Reporting Level | 44 | 83% | 14% | 83% | 10% |
| Total | 46 | 83% | 14% | 83% | 11% |
| Sample Statistics |
| 2-METHYLNAPHTHALENE |
| Characteristic | N | % | % Basis |
|---|---|---|---|
| Plotted | 46 | 100% | Spiked |
| Estimated Values | 5 | 11% | Spiked |
| Deleted Values | 1 | 1% | Spiked + Not Spiked |
| Spiked, Censored | 0 | 0% | Spiked |
| Spiked | 47 | . | |
| False Negatives | 0 | 0% | 0 out of 46 |
| Not Spiked | 44 | . | |
| False Positives | 1 | 2% | 1 out of 44 |
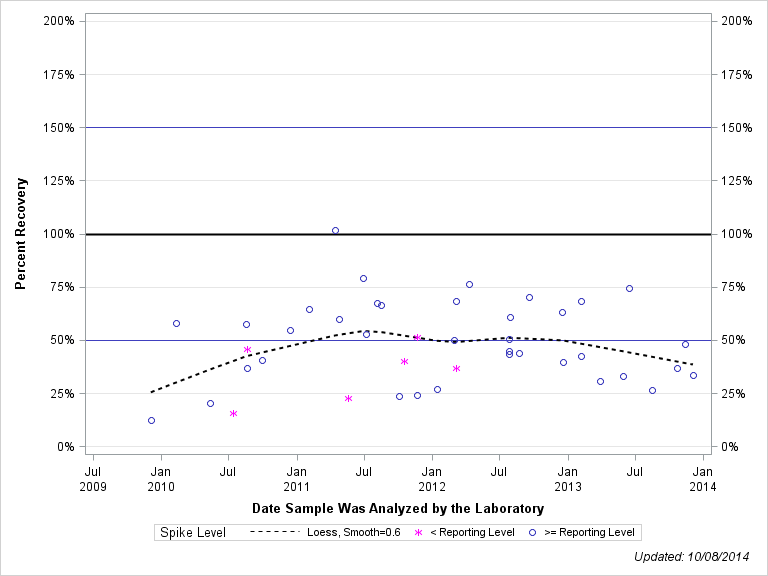
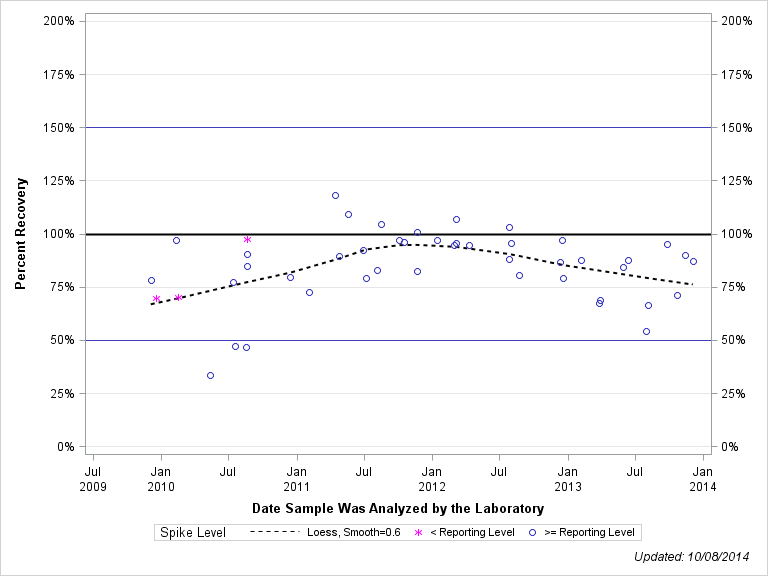
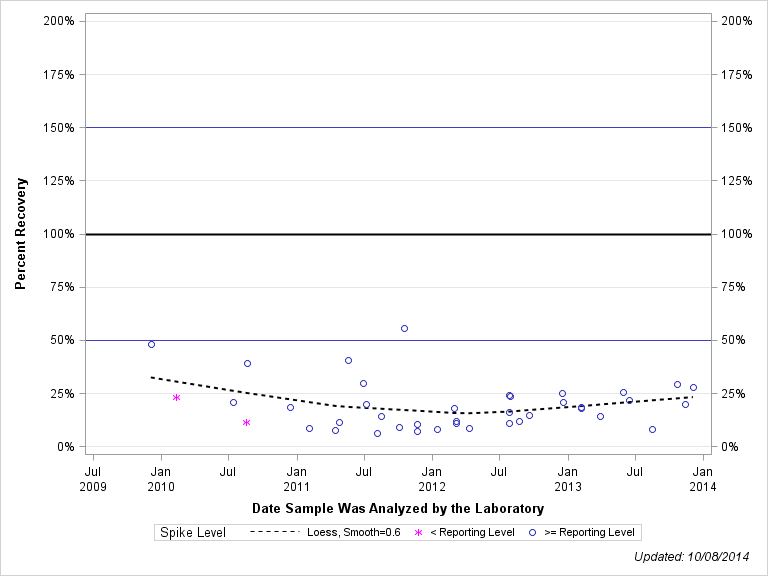
| BQS OBSP Determination: |
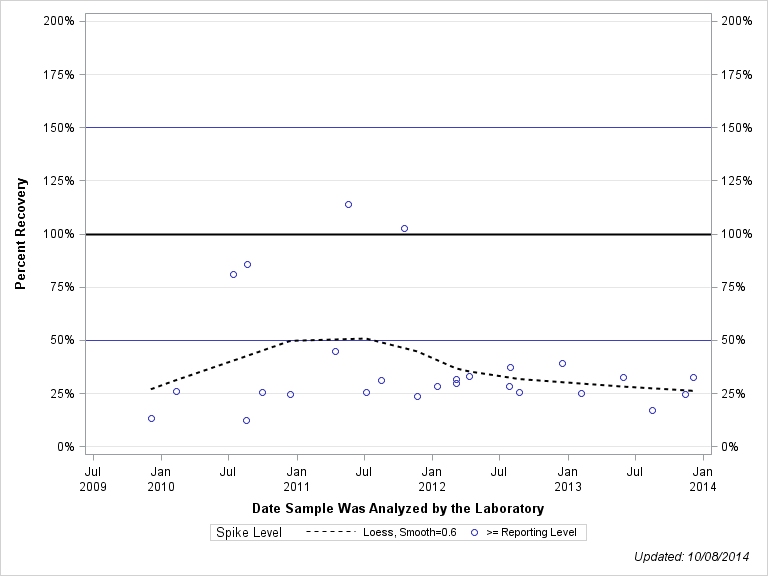
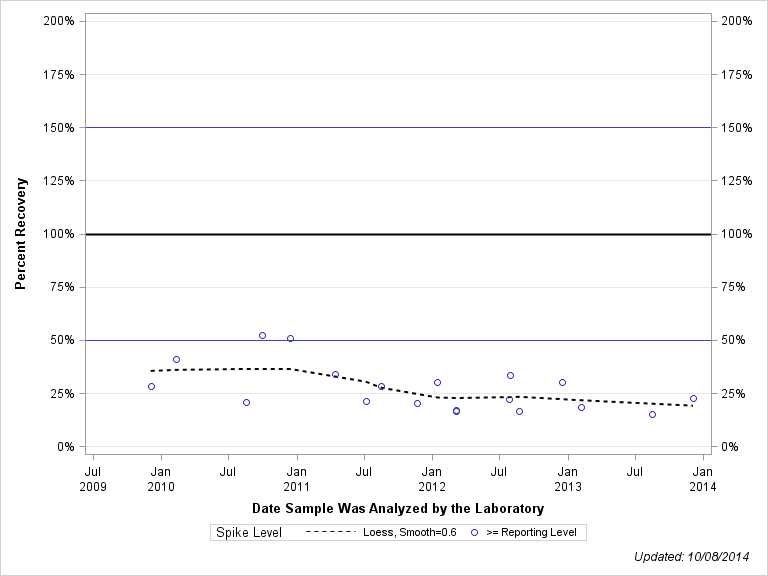
| 3,4-DICHLOROPHENYL ISOCYANATE |
| SCHEDULE: 4433 , TESTIDCODE: 63145GCM99 |
| Open Data Set |
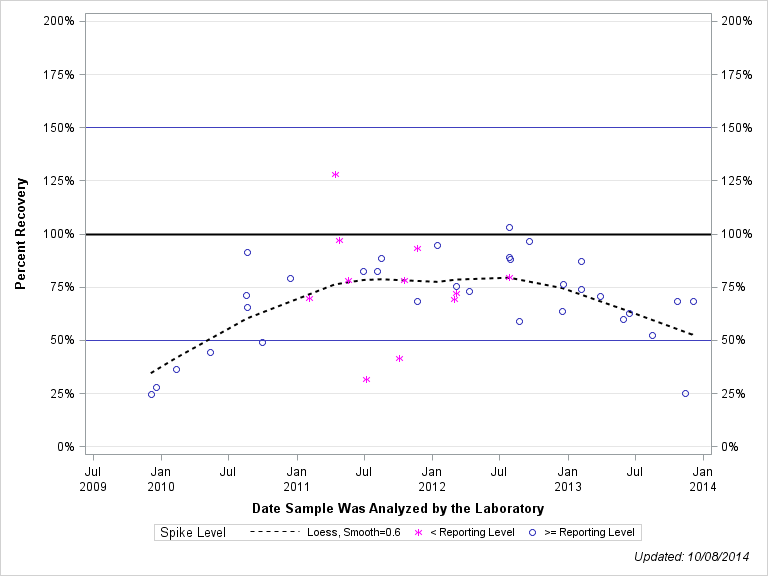
| Plotted Points Statistics |
| 3,4-DICHLOROPHENYL ISOCYANATE |
| Spike Level | N | Mean | Std-Dev. | Median | F_Pseudo |
|---|---|---|---|---|---|
| < Reporting Level | 2 | 17% | 8% | 17% | 9% |
| >= Reporting Level | 38 | 19% | 12% | 18% | 10% |
| Total | 40 | 19% | 11% | 18% | 10% |
| Sample Statistics |
| 3,4-DICHLOROPHENYL ISOCYANATE |
| Characteristic | N | % | % Basis |
|---|---|---|---|
| Plotted | 40 | 98% | Spiked |
| Estimated Values | 40 | 98% | Spiked |
| Deleted Values | 1 | 1% | Spiked + Not Spiked |
| Spiked, Censored | 1 | 2% | Spiked |
| Spiked | 42 | . | |
| False Negatives | 0 | 0% | 0 out of 41 |
| Not Spiked | 49 | . | |
| False Positives | 1 | 2% | 1 out of 49 |
| Plotted Points Statistics |
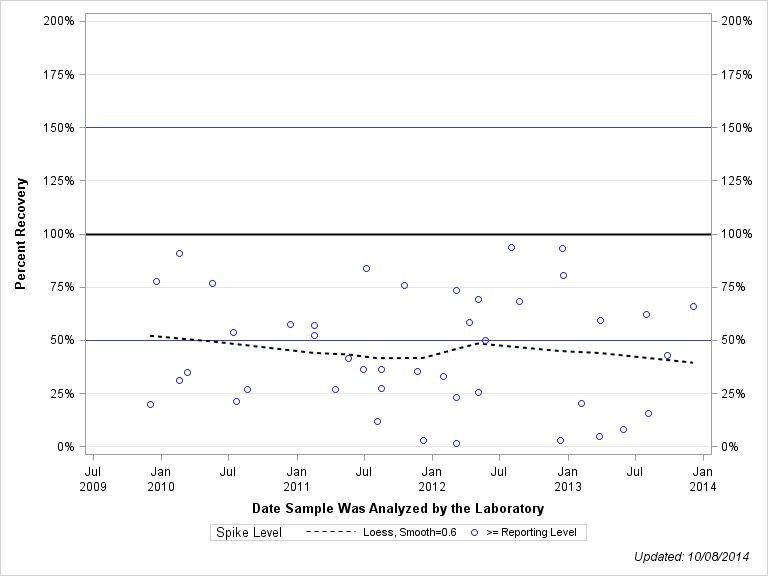
| 3-BETA-COPROSTANOL |
| Spike Level | N | Mean | Std-Dev. | Median | F_Pseudo |
|---|---|---|---|---|---|
| >= Reporting Level | 43 | 52% | 18% | 51% | 15% |
| Total | 43 | 52% | 18% | 51% | 15% |
| Sample Statistics |
| 3-BETA-COPROSTANOL |
| Characteristic | N | % | % Basis |
|---|---|---|---|
| Plotted | 43 | 98% | Spiked |
| Estimated Values | 43 | 98% | Spiked |
| Deleted Values | 1 | 1% | Spiked + Not Spiked |
| Spiked, Censored | 0 | 0% | Spiked |
| Spiked | 45 | . | |
| False Negatives | 1 | 2% | 1 out of 44 |
| Not Spiked | 46 | . | |
| False Positives | 0 | 0% | 0 out of 46 |
| BQS OBSP Determination: |
| 3-METHYL-1(H)-INDOLE (SKATOLE) |
| SCHEDULE: 4433 , TESTIDCODE: 62807GCM99 |
| Open Data Set |
| Plotted Points Statistics |
| 3-METHYL-1(H)-INDOLE (SKATOLE) |
| Spike Level | N | Mean | Std-Dev. | Median | F_Pseudo |
|---|---|---|---|---|---|
| >= Reporting Level | 48 | 79% | 17% | 83% | 12% |
| Total | 48 | 79% | 17% | 83% | 12% |
| Sample Statistics |
| 3-METHYL-1(H)-INDOLE (SKATOLE) |
| Characteristic | N | % | % Basis |
|---|---|---|---|
| Plotted | 48 | 100% | Spiked |
| Estimated Values | 6 | 13% | Spiked |
| Deleted Values | 1 | 1% | Spiked + Not Spiked |
| Spiked, Censored | 0 | 0% | Spiked |
| Spiked | 49 | . | |
| False Negatives | 0 | 0% | 0 out of 48 |
| Not Spiked | 42 | . | |
| False Positives | 0 | 0% | 0 out of 42 |
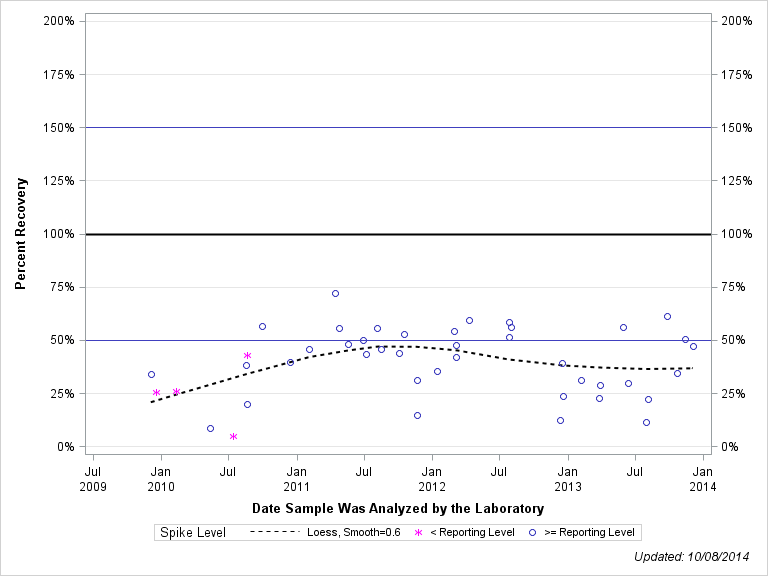
| BQS OBSP Determination: |
| 3-TERT-BUTYL-4-HYDROXY ANISOLE (BHA) |
| SCHEDULE: 4433 , TESTIDCODE: 61702GCM99 |
| Open Data Set |
| Plotted Points Statistics |
| 3-TERT-BUTYL-4-HYDROXY ANISOLE (BHA) |
| Spike Level | N | Mean | Std-Dev. | Median | F_Pseudo |
|---|---|---|---|---|---|
| >= Reporting Level | 43 | 45% | 27% | 41% | 33% |
| Total | 43 | 45% | 27% | 41% | 33% |
| Sample Statistics |
| 3-TERT-BUTYL-4-HYDROXY ANISOLE (BHA) |
| Characteristic | N | % | % Basis |
|---|---|---|---|
| Plotted | 43 | 98% | Spiked |
| Estimated Values | 43 | 98% | Spiked |
| Deleted Values | 3 | 3% | Spiked + Not Spiked |
| Spiked, Censored | 0 | 0% | Spiked |
| Spiked | 44 | . | |
| False Negatives | 1 | 2% | 1 out of 44 |
| Not Spiked | 47 | . | |
| False Positives | 0 | 0% | 0 out of 44 |
| Plotted Points Statistics |
| 4-CUMYLPHENOL |
| Spike Level | N | Mean | Std-Dev. | Median | F_Pseudo |
|---|---|---|---|---|---|
| >= Reporting Level | 48 | 81% | 19% | 81% | 17% |
| Total | 48 | 81% | 19% | 81% | 17% |
| Sample Statistics |
| 4-CUMYLPHENOL |
| Characteristic | N | % | % Basis |
|---|---|---|---|
| Plotted | 48 | 100% | Spiked |
| Estimated Values | 8 | 17% | Spiked |
| Deleted Values | 1 | 1% | Spiked + Not Spiked |
| Spiked, Censored | 0 | 0% | Spiked |
| Spiked | 49 | . | |
| False Negatives | 0 | 0% | 0 out of 48 |
| Not Spiked | 42 | . | |
| False Positives | 0 | 0% | 0 out of 42 |
| Plotted Points Statistics |
| 4-N-OCTYLPHENOL |
| Spike Level | N | Mean | Std-Dev. | Median | F_Pseudo |
|---|---|---|---|---|---|
| < Reporting Level | 2 | 76% | 10% | 76% | 11% |
| >= Reporting Level | 46 | 68% | 22% | 65% | 15% |
| Total | 48 | 68% | 21% | 66% | 15% |
| Sample Statistics |
| 4-N-OCTYLPHENOL |
| Characteristic | N | % | % Basis |
|---|---|---|---|
| Plotted | 48 | 100% | Spiked |
| Estimated Values | 48 | 100% | Spiked |
| Deleted Values | 1 | 1% | Spiked + Not Spiked |
| Spiked, Censored | 0 | 0% | Spiked |
| Spiked | 49 | . | |
| False Negatives | 0 | 0% | 0 out of 48 |
| Not Spiked | 42 | . | |
| False Positives | 1 | 2% | 1 out of 42 |
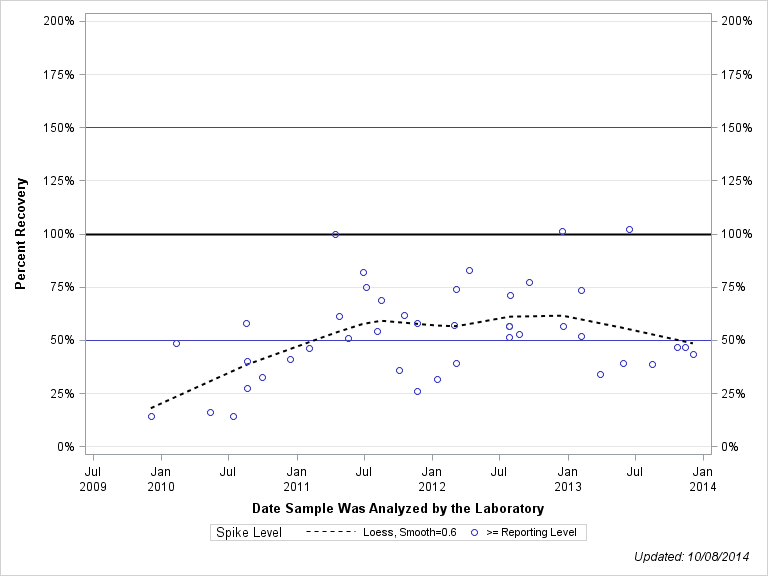
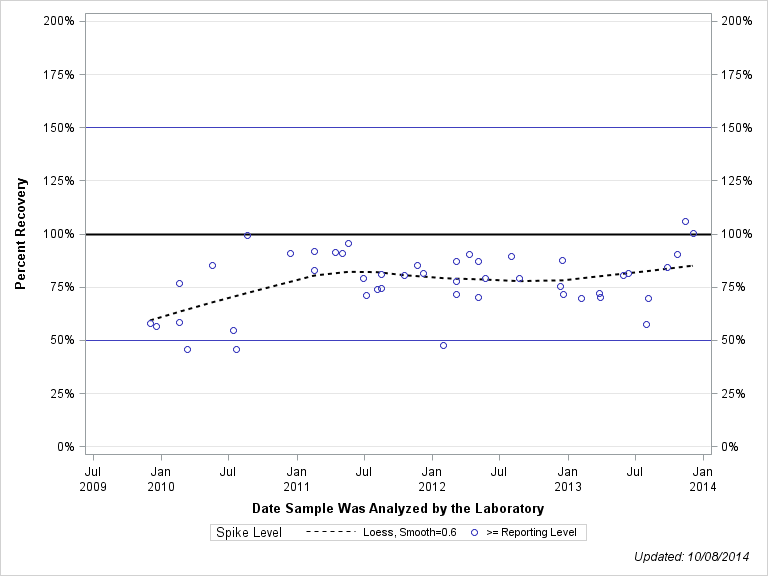
| BQS OBSP Determination: |
| 4-NONYLPHENOL DIETHOXYLATE, TOTAL (NPEO2) |
| SCHEDULE: 4433 , TESTIDCODE: 61703GCM99 |
| Open Data Set |
| Plotted Points Statistics |
| 4-NONYLPHENOL DIETHOXYLATE, TOTAL (NPEO2) |
| Spike Level | N | Mean | Std-Dev. | Median | F_Pseudo |
|---|---|---|---|---|---|
| >= Reporting Level | 26 | 38% | 27% | 29% | 9% |
| Total | 26 | 38% | 27% | 29% | 9% |
| Sample Statistics |
| 4-NONYLPHENOL DIETHOXYLATE, TOTAL (NPEO2) |
| Characteristic | N | % | % Basis |
|---|---|---|---|
| Plotted | 26 | 100% | Spiked |
| Estimated Values | 26 | 100% | Spiked |
| Deleted Values | 1 | 1% | Spiked + Not Spiked |
| Spiked, Censored | 0 | 0% | Spiked |
| Spiked | 26 | . | |
| False Negatives | 0 | 0% | 0 out of 26 |
| Not Spiked | 65 | . | |
| False Positives | 0 | 0% | 0 out of 64 |
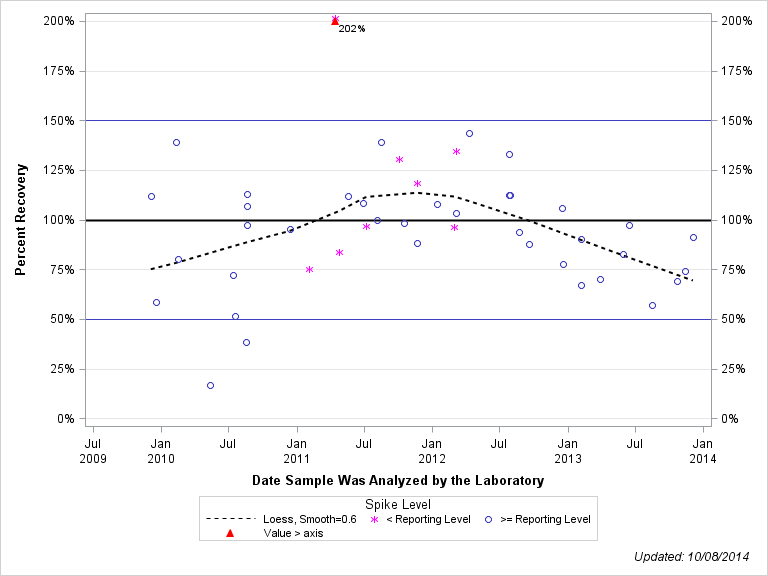
| BQS OBSP Determination: |
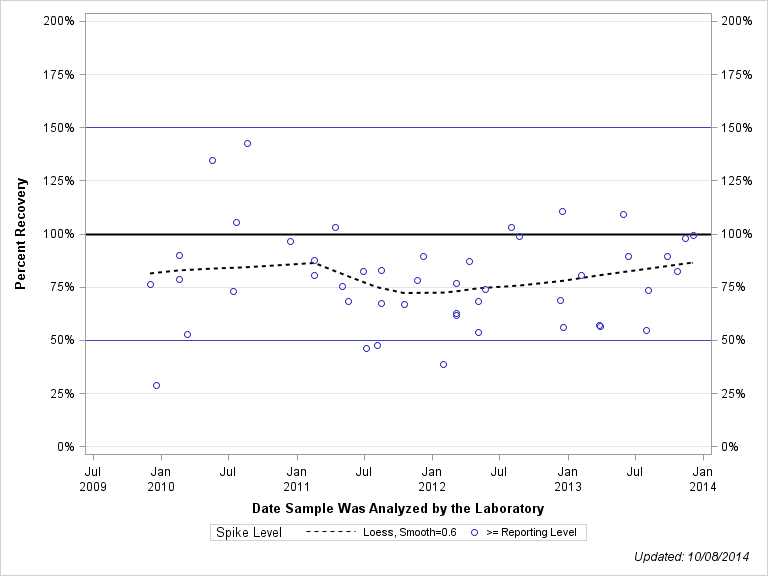
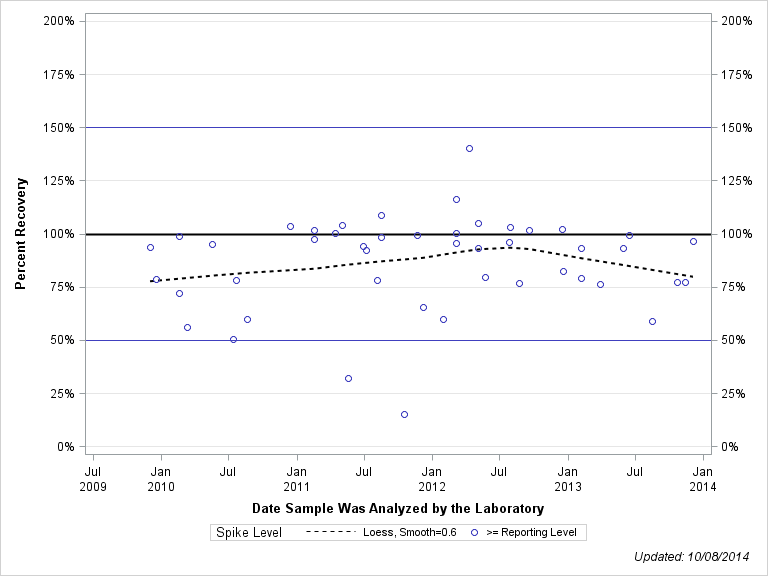
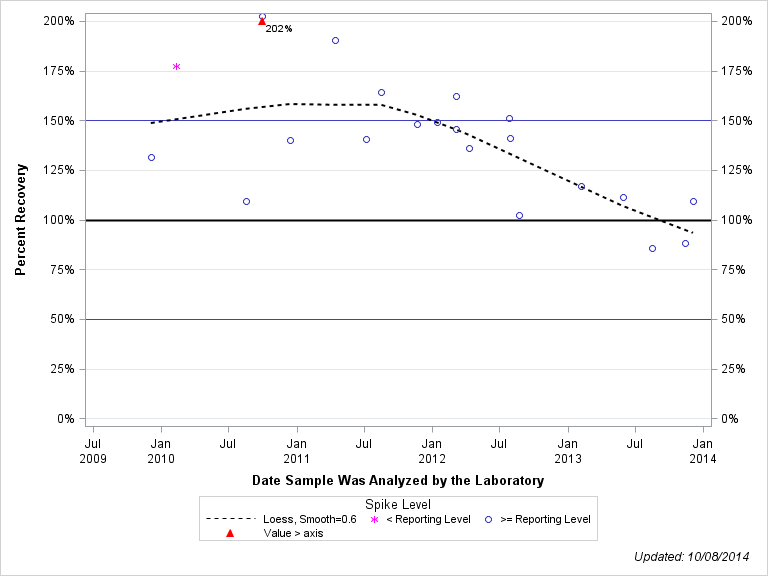
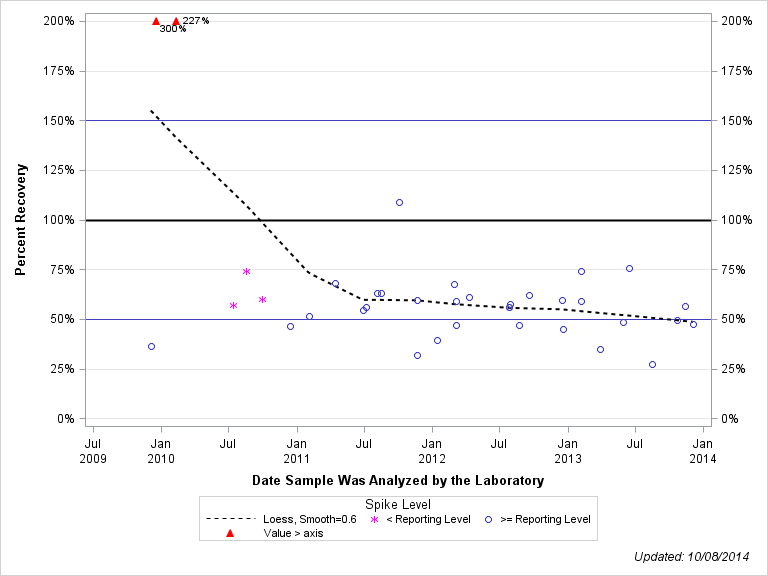
| 4-NONYLPHENOL MONOETHOXYLATE |
| SCHEDULE: 4433 , TESTIDCODE: 61704GCM99 |
| Open Data Set |
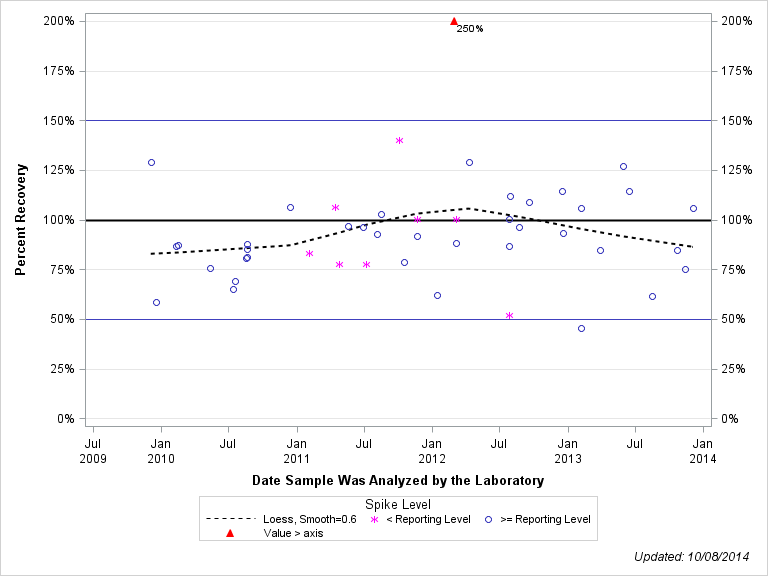
| Plotted Points Statistics |
| 4-NONYLPHENOL MONOETHOXYLATE |
| Spike Level | N | Mean | Std-Dev. | Median | F_Pseudo |
|---|---|---|---|---|---|
| < Reporting Level | 1 | 178% | . | 178% | 0% |
| >= Reporting Level | 20 | 136% | 31% | 140% | 29% |
| Total | 21 | 138% | 31% | 140% | 30% |
| Sample Statistics |
| 4-NONYLPHENOL MONOETHOXYLATE |
| Characteristic | N | % | % Basis |
|---|---|---|---|
| Plotted | 21 | 95% | Spiked |
| Estimated Values | 21 | 95% | Spiked |
| Deleted Values | 1 | 1% | Spiked + Not Spiked |
| Spiked, Censored | 0 | 0% | Spiked |
| Spiked | 22 | . | |
| False Negatives | 1 | 5% | 1 out of 22 |
| Not Spiked | 69 | . | |
| False Positives | 6 | 9% | 6 out of 68 |
| Plotted Points Statistics |
| 4-TERT-OCTYLPHENOL |
| Spike Level | N | Mean | Std-Dev. | Median | F_Pseudo |
|---|---|---|---|---|---|
| < Reporting Level | 4 | 99% | 21% | 96% | 26% |
| >= Reporting Level | 40 | 80% | 12% | 79% | 10% |
| Total | 44 | 81% | 13% | 80% | 11% |
| Sample Statistics |
| 4-TERT-OCTYLPHENOL |
| Characteristic | N | % | % Basis |
|---|---|---|---|
| Plotted | 44 | 100% | Spiked |
| Estimated Values | 44 | 100% | Spiked |
| Deleted Values | 1 | 1% | Spiked + Not Spiked |
| Spiked, Censored | 0 | 0% | Spiked |
| Spiked | 45 | . | |
| False Negatives | 0 | 0% | 0 out of 44 |
| Not Spiked | 46 | . | |
| False Positives | 0 | 0% | 0 out of 46 |
| BQS OBSP Determination: |
| 4-TERT-OCTYLPHENOL DIETHOXYLATES, TOTAL (OPEO2) |
| SCHEDULE: 4433 , TESTIDCODE: 62486GCM99 |
| Open Data Set |
| Plotted Points Statistics |
| 4-TERT-OCTYLPHENOL DIETHOXYLATES, TOTAL (OPEO2) |
| Spike Level | N | Mean | Std-Dev. | Median | F_Pseudo |
|---|---|---|---|---|---|
| >= Reporting Level | 19 | 27% | 11% | 23% | 11% |
| Total | 19 | 27% | 11% | 23% | 11% |
| Sample Statistics |
| 4-TERT-OCTYLPHENOL DIETHOXYLATES, TOTAL (OPEO2) |
| Characteristic | N | % | % Basis |
|---|---|---|---|
| Plotted | 19 | 86% | Spiked |
| Estimated Values | 19 | 86% | Spiked |
| Deleted Values | 1 | 1% | Spiked + Not Spiked |
| Spiked, Censored | 0 | 0% | Spiked |
| Spiked | 22 | . | |
| False Negatives | 3 | 14% | 3 out of 22 |
| Not Spiked | 67 | . | |
| False Positives | 2 | 3% | 2 out of 66 |
| BQS OBSP Determination: |
| 4-Tert-Octylphenol monoethoxylates, total |
| SCHEDULE: 4433 , TESTIDCODE: 62485GCM99 |
| Open Data Set |

| Sample Statistics |
| 4-Tert-Octylphenol monoethoxylates, total |
| Characteristic | N | % | % Basis |
|---|---|---|---|
| Plotted | 0 | . | Spiked |
| Estimated Values | 0 | . | Spiked |
| Deleted Values | 1 | 1% | Spiked + Not Spiked |
| Spiked, Censored | 0 | . | Spiked |
| Spiked | 0 | . | |
| False Negatives | 0 | . | 0 out of 0 |
| Not Spiked | 91 | . | |
| False Positives | 27 | 30% | 27 out of 90 |
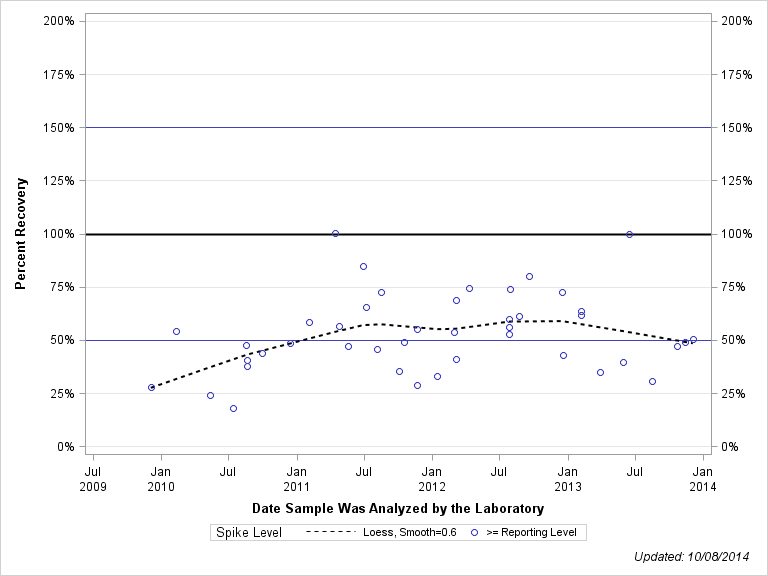
| BQS OBSP Determination: |
| 5-METHYL-1H-BENZOTRIAZOLE |
| SCHEDULE: 4433 , TESTIDCODE: 61944GCM99 |
| Open Data Set |
| Plotted Points Statistics |
| 5-METHYL-1H-BENZOTRIAZOLE |
| Spike Level | N | Mean | Std-Dev. | Median | F_Pseudo |
|---|---|---|---|---|---|
| >= Reporting Level | 43 | 56% | 21% | 56% | 19% |
| Total | 43 | 56% | 21% | 56% | 19% |
| Sample Statistics |
| 5-METHYL-1H-BENZOTRIAZOLE |
| Characteristic | N | % | % Basis |
|---|---|---|---|
| Plotted | 43 | 98% | Spiked |
| Estimated Values | 43 | 98% | Spiked |
| Deleted Values | 5 | 5% | Spiked + Not Spiked |
| Spiked, Censored | 0 | 0% | Spiked |
| Spiked | 45 | . | |
| False Negatives | 1 | 2% | 1 out of 44 |
| Not Spiked | 46 | . | |
| False Positives | 1 | 2% | 1 out of 42 |
| Plotted Points Statistics |
| ACETOPHENONE |
| Spike Level | N | Mean | Std-Dev. | Median | F_Pseudo |
|---|---|---|---|---|---|
| >= Reporting Level | 44 | 89% | 12% | 88% | 12% |
| Total | 44 | 89% | 12% | 88% | 12% |
| Sample Statistics |
| ACETOPHENONE |
| Characteristic | N | % | % Basis |
|---|---|---|---|
| Plotted | 44 | 100% | Spiked |
| Estimated Values | 4 | 9% | Spiked |
| Deleted Values | 1 | 1% | Spiked + Not Spiked |
| Spiked, Censored | 0 | 0% | Spiked |
| Spiked | 45 | . | |
| False Negatives | 0 | 0% | 0 out of 44 |
| Not Spiked | 46 | . | |
| False Positives | 0 | 0% | 0 out of 46 |
| BQS OBSP Determination: |
| ACETYL HEXAMETHYL TETRAHYDRONAPHTHALENE (AHTN) |
| SCHEDULE: 4433 , TESTIDCODE: 62812GCM99 |
| Open Data Set |
| Plotted Points Statistics |
| ACETYL HEXAMETHYL TETRAHYDRONAPHTHALENE (AHTN) |
| Spike Level | N | Mean | Std-Dev. | Median | F_Pseudo |
|---|---|---|---|---|---|
| >= Reporting Level | 30 | 82% | 15% | 81% | 11% |
| Total | 30 | 82% | 15% | 81% | 11% |
| Sample Statistics |
| ACETYL HEXAMETHYL TETRAHYDRONAPHTHALENE (AHTN) |
| Characteristic | N | % | % Basis |
|---|---|---|---|
| Plotted | 30 | 100% | Spiked |
| Estimated Values | 1 | 3% | Spiked |
| Deleted Values | 1 | 1% | Spiked + Not Spiked |
| Spiked, Censored | 0 | 0% | Spiked |
| Spiked | 31 | . | |
| False Negatives | 0 | 0% | 0 out of 30 |
| Not Spiked | 60 | . | |
| False Positives | 0 | 0% | 0 out of 60 |
| Plotted Points Statistics |
| ANTHRACENE |
| Spike Level | N | Mean | Std-Dev. | Median | F_Pseudo |
|---|---|---|---|---|---|
| < Reporting Level | 2 | 74% | 3% | 74% | 3% |
| >= Reporting Level | 44 | 82% | 12% | 82% | 14% |
| Total | 46 | 81% | 12% | 81% | 14% |
| Sample Statistics |
| ANTHRACENE |
| Characteristic | N | % | % Basis |
|---|---|---|---|
| Plotted | 46 | 100% | Spiked |
| Estimated Values | 5 | 11% | Spiked |
| Deleted Values | 1 | 1% | Spiked + Not Spiked |
| Spiked, Censored | 0 | 0% | Spiked |
| Spiked | 47 | . | |
| False Negatives | 0 | 0% | 0 out of 46 |
| Not Spiked | 34 | . | |
| False Positives | 1 | 3% | 1 out of 34 |
| Plotted Points Statistics |
| ANTHRAQUINONE |
| Spike Level | N | Mean | Std-Dev. | Median | F_Pseudo |
|---|---|---|---|---|---|
| >= Reporting Level | 48 | 79% | 16% | 79% | 11% |
| Total | 48 | 79% | 16% | 79% | 11% |
| Sample Statistics |
| ANTHRAQUINONE |
| Characteristic | N | % | % Basis |
|---|---|---|---|
| Plotted | 48 | 100% | Spiked |
| Estimated Values | 48 | 100% | Spiked |
| Deleted Values | 1 | 1% | Spiked + Not Spiked |
| Spiked, Censored | 0 | 0% | Spiked |
| Spiked | 49 | . | |
| False Negatives | 0 | 0% | 0 out of 48 |
| Not Spiked | 42 | . | |
| False Positives | 0 | 0% | 0 out of 42 |
| Plotted Points Statistics |
| ATRAZINE |
| Spike Level | N | Mean | Std-Dev. | Median | F_Pseudo |
|---|---|---|---|---|---|
| >= Reporting Level | 45 | 89% | 13% | 88% | 13% |
| Total | 45 | 89% | 13% | 88% | 13% |
| Sample Statistics |
| ATRAZINE |
| Characteristic | N | % | % Basis |
|---|---|---|---|
| Plotted | 45 | 100% | Spiked |
| Estimated Values | 2 | 4% | Spiked |
| Deleted Values | 1 | 1% | Spiked + Not Spiked |
| Spiked, Censored | 0 | 0% | Spiked |
| Spiked | 45 | . | |
| False Negatives | 0 | 0% | 0 out of 45 |
| Not Spiked | 46 | . | |
| False Positives | 1 | 2% | 1 out of 45 |
| Plotted Points Statistics |
| BENZOPHENONE |
| Spike Level | N | Mean | Std-Dev. | Median | F_Pseudo |
|---|---|---|---|---|---|
| < Reporting Level | 3 | 82% | 5% | 85% | 7% |
| >= Reporting Level | 46 | 87% | 12% | 85% | 7% |
| Total | 49 | 87% | 12% | 85% | 7% |
| Sample Statistics |
| BENZOPHENONE |
| Characteristic | N | % | % Basis |
|---|---|---|---|
| Plotted | 49 | 100% | Spiked |
| Estimated Values | 9 | 18% | Spiked |
| Deleted Values | 1 | 1% | Spiked + Not Spiked |
| Spiked, Censored | 0 | 0% | Spiked |
| Spiked | 49 | . | |
| False Negatives | 0 | 0% | 0 out of 49 |
| Not Spiked | 42 | . | |
| False Positives | 1 | 2% | 1 out of 41 |
| Plotted Points Statistics |
| BENZO[A]PYRENE |
| Spike Level | N | Mean | Std-Dev. | Median | F_Pseudo |
|---|---|---|---|---|---|
| < Reporting Level | 2 | 60% | 11% | 60% | 11% |
| >= Reporting Level | 44 | 83% | 19% | 86% | 20% |
| Total | 46 | 82% | 20% | 85% | 20% |
| Sample Statistics |
| BENZO[A]PYRENE |
| Characteristic | N | % | % Basis |
|---|---|---|---|
| Plotted | 46 | 100% | Spiked |
| Estimated Values | 7 | 15% | Spiked |
| Deleted Values | 1 | 1% | Spiked + Not Spiked |
| Spiked, Censored | 0 | 0% | Spiked |
| Spiked | 47 | . | |
| False Negatives | 0 | 0% | 0 out of 46 |
| Not Spiked | 44 | . | |
| False Positives | 1 | 2% | 1 out of 44 |
| Plotted Points Statistics |
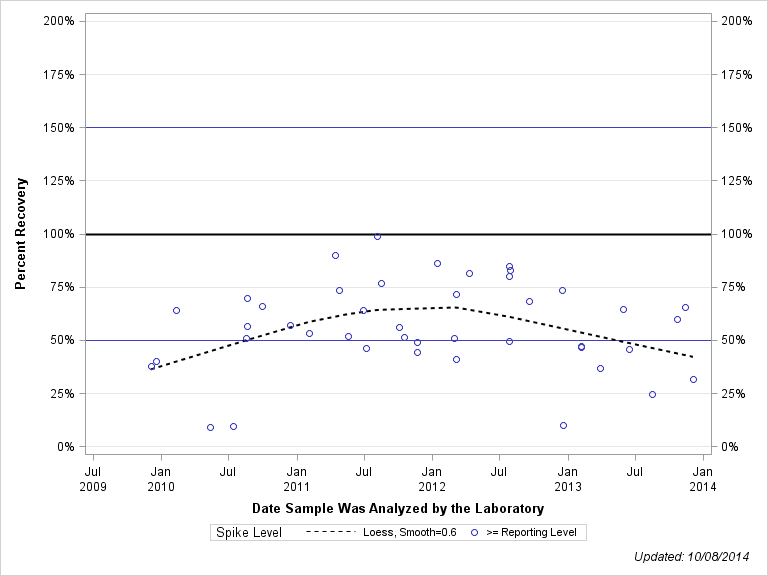
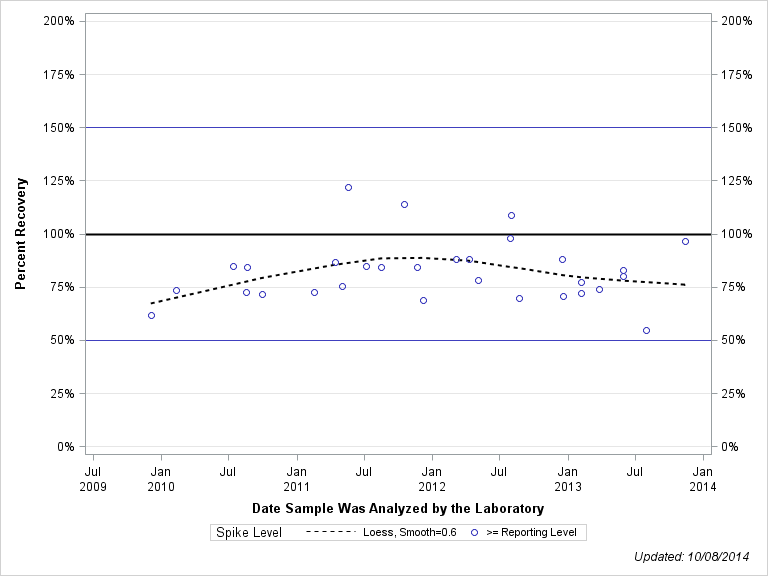
| BETA-SITOSTEROL |
| Spike Level | N | Mean | Std-Dev. | Median | F_Pseudo |
|---|---|---|---|---|---|
| >= Reporting Level | 43 | 53% | 22% | 52% | 22% |
| Total | 43 | 53% | 22% | 52% | 22% |
| Sample Statistics |
| BETA-SITOSTEROL |
| Characteristic | N | % | % Basis |
|---|---|---|---|
| Plotted | 43 | 98% | Spiked |
| Estimated Values | 43 | 98% | Spiked |
| Deleted Values | 2 | 2% | Spiked + Not Spiked |
| Spiked, Censored | 0 | 0% | Spiked |
| Spiked | 45 | . | |
| False Negatives | 1 | 2% | 1 out of 44 |
| Not Spiked | 46 | . | |
| False Positives | 0 | 0% | 0 out of 45 |
| Plotted Points Statistics |
| BETA-STIGMASTANOL |
| Spike Level | N | Mean | Std-Dev. | Median | F_Pseudo |
|---|---|---|---|---|---|
| < Reporting Level | 6 | 35% | 14% | 38% | 17% |
| >= Reporting Level | 37 | 50% | 19% | 50% | 21% |
| Total | 43 | 48% | 19% | 46% | 22% |
| Sample Statistics |
| BETA-STIGMASTANOL |
| Characteristic | N | % | % Basis |
|---|---|---|---|
| Plotted | 43 | 100% | Spiked |
| Estimated Values | 43 | 100% | Spiked |
| Deleted Values | 4 | 4% | Spiked + Not Spiked |
| Spiked, Censored | 0 | 0% | Spiked |
| Spiked | 45 | . | |
| False Negatives | 0 | 0% | 0 out of 43 |
| Not Spiked | 46 | . | |
| False Positives | 0 | 0% | 0 out of 44 |
| BQS OBSP Determination: |
| BIS(2-ETHYLHEXYL) PHTHALATE |
| SCHEDULE: 4433 , TESTIDCODE: 39100GCM99 |
| Open Data Set |
| Plotted Points Statistics |
| BIS(2-ETHYLHEXYL) PHTHALATE |
| Spike Level | N | Mean | Std-Dev. | Median | F_Pseudo |
|---|---|---|---|---|---|
| < Reporting Level | 5 | 143% | 112% | 74% | 124% |
| >= Reporting Level | 32 | 55% | 15% | 56% | 11% |
| Total | 37 | 67% | 50% | 57% | 12% |
| Sample Statistics |
| BIS(2-ETHYLHEXYL) PHTHALATE |
| Characteristic | N | % | % Basis |
|---|---|---|---|
| Plotted | 37 | 86% | Spiked |
| Estimated Values | 12 | 28% | Spiked |
| Deleted Values | 2 | 2% | Spiked + Not Spiked |
| Spiked, Censored | 4 | 9% | Spiked |
| Spiked | 45 | . | |
| False Negatives | 2 | 5% | 2 out of 43 |
| Not Spiked | 46 | . | |
| False Positives | 5 | 11% | 5 out of 46 |
| Plotted Points Statistics |
| BISPHENOL A |
| Spike Level | N | Mean | Std-Dev. | Median | F_Pseudo |
|---|---|---|---|---|---|
| < Reporting Level | 2 | 81% | 10% | 81% | 10% |
| >= Reporting Level | 42 | 83% | 21% | 82% | 17% |
| Total | 44 | 83% | 21% | 82% | 16% |
| Sample Statistics |
| BISPHENOL A |
| Characteristic | N | % | % Basis |
|---|---|---|---|
| Plotted | 44 | 100% | Spiked |
| Estimated Values | 8 | 18% | Spiked |
| Deleted Values | 1 | 1% | Spiked + Not Spiked |
| Spiked, Censored | 0 | 0% | Spiked |
| Spiked | 45 | . | |
| False Negatives | 0 | 0% | 0 out of 44 |
| Not Spiked | 46 | . | |
| False Positives | 1 | 2% | 1 out of 46 |
| Plotted Points Statistics |
| BROMACIL |
| Spike Level | N | Mean | Std-Dev. | Median | F_Pseudo |
|---|---|---|---|---|---|
| >= Reporting Level | 45 | 84% | 14% | 82% | 14% |
| Total | 45 | 84% | 14% | 82% | 14% |
| Sample Statistics |
| BROMACIL |
| Characteristic | N | % | % Basis |
|---|---|---|---|
| Plotted | 45 | 100% | Spiked |
| Estimated Values | 5 | 11% | Spiked |
| Deleted Values | 1 | 1% | Spiked + Not Spiked |
| Spiked, Censored | 0 | 0% | Spiked |
| Spiked | 45 | . | |
| False Negatives | 0 | 0% | 0 out of 45 |
| Not Spiked | 46 | . | |
| False Positives | 0 | 0% | 0 out of 45 |
| Plotted Points Statistics |
| BROMOFORM |
| Spike Level | N | Mean | Std-Dev. | Median | F_Pseudo |
|---|---|---|---|---|---|
| < Reporting Level | 2 | 67% | 22% | 67% | 24% |
| >= Reporting Level | 43 | 82% | 12% | 82% | 9% |
| Total | 45 | 81% | 12% | 82% | 8% |
| Sample Statistics |
| BROMOFORM |
| Characteristic | N | % | % Basis |
|---|---|---|---|
| Plotted | 45 | 100% | Spiked |
| Estimated Values | 7 | 16% | Spiked |
| Deleted Values | 1 | 1% | Spiked + Not Spiked |
| Spiked, Censored | 0 | 0% | Spiked |
| Spiked | 46 | . | |
| False Negatives | 0 | 0% | 0 out of 45 |
| Not Spiked | 45 | . | |
| False Positives | 0 | 0% | 0 out of 45 |
| Plotted Points Statistics |
| CAFFEINE |
| Spike Level | N | Mean | Std-Dev. | Median | F_Pseudo |
|---|---|---|---|---|---|
| >= Reporting Level | 47 | 77% | 15% | 80% | 16% |
| Total | 47 | 77% | 15% | 80% | 16% |
| Sample Statistics |
| CAFFEINE |
| Characteristic | N | % | % Basis |
|---|---|---|---|
| Plotted | 47 | 100% | Spiked |
| Estimated Values | 1 | 2% | Spiked |
| Deleted Values | 1 | 1% | Spiked + Not Spiked |
| Spiked, Censored | 0 | 0% | Spiked |
| Spiked | 47 | . | |
| False Negatives | 0 | 0% | 0 out of 47 |
| Not Spiked | 44 | . | |
| False Positives | 1 | 2% | 1 out of 43 |
| Plotted Points Statistics |
| CAMPHOR |
| Spike Level | N | Mean | Std-Dev. | Median | F_Pseudo |
|---|---|---|---|---|---|
| < Reporting Level | 3 | 75% | 3% | 77% | 4% |
| >= Reporting Level | 46 | 86% | 11% | 85% | 11% |
| Total | 49 | 85% | 11% | 85% | 11% |
| Sample Statistics |
| CAMPHOR |
| Characteristic | N | % | % Basis |
|---|---|---|---|
| Plotted | 49 | 100% | Spiked |
| Estimated Values | 8 | 16% | Spiked |
| Deleted Values | 1 | 1% | Spiked + Not Spiked |
| Spiked, Censored | 0 | 0% | Spiked |
| Spiked | 49 | . | |
| False Negatives | 0 | 0% | 0 out of 49 |
| Not Spiked | 42 | . | |
| False Positives | 0 | 0% | 0 out of 41 |
| Plotted Points Statistics |
| CARBARYL |
| Spike Level | N | Mean | Std-Dev. | Median | F_Pseudo |
|---|---|---|---|---|---|
| >= Reporting Level | 47 | 79% | 23% | 78% | 20% |
| Total | 47 | 79% | 23% | 78% | 20% |
| Sample Statistics |
| CARBARYL |
| Characteristic | N | % | % Basis |
|---|---|---|---|
| Plotted | 47 | 100% | Spiked |
| Estimated Values | 47 | 100% | Spiked |
| Deleted Values | 1 | 1% | Spiked + Not Spiked |
| Spiked, Censored | 0 | 0% | Spiked |
| Spiked | 47 | . | |
| False Negatives | 0 | 0% | 0 out of 47 |
| Not Spiked | 44 | . | |
| False Positives | 1 | 2% | 1 out of 43 |
| Plotted Points Statistics |
| CARBAZOLE |
| Spike Level | N | Mean | Std-Dev. | Median | F_Pseudo |
|---|---|---|---|---|---|
| < Reporting Level | 2 | 81% | 9% | 81% | 9% |
| >= Reporting Level | 44 | 84% | 16% | 86% | 17% |
| Total | 46 | 83% | 16% | 86% | 16% |
| Sample Statistics |
| CARBAZOLE |
| Characteristic | N | % | % Basis |
|---|---|---|---|
| Plotted | 46 | 100% | Spiked |
| Estimated Values | 4 | 9% | Spiked |
| Deleted Values | 1 | 1% | Spiked + Not Spiked |
| Spiked, Censored | 0 | 0% | Spiked |
| Spiked | 47 | . | |
| False Negatives | 0 | 0% | 0 out of 46 |
| Not Spiked | 43 | . | |
| False Positives | 2 | 5% | 2 out of 43 |
| Plotted Points Statistics |
| CHLORPYRIFOS |
| Spike Level | N | Mean | Std-Dev. | Median | F_Pseudo |
|---|---|---|---|---|---|
| >= Reporting Level | 47 | 86% | 12% | 88% | 9% |
| Total | 47 | 86% | 12% | 88% | 9% |
| Sample Statistics |
| CHLORPYRIFOS |
| Characteristic | N | % | % Basis |
|---|---|---|---|
| Plotted | 47 | 100% | Spiked |
| Estimated Values | 3 | 6% | Spiked |
| Deleted Values | 1 | 1% | Spiked + Not Spiked |
| Spiked, Censored | 0 | 0% | Spiked |
| Spiked | 47 | . | |
| False Negatives | 0 | 0% | 0 out of 47 |
| Not Spiked | 44 | . | |
| False Positives | 1 | 2% | 1 out of 43 |
| Plotted Points Statistics |
| CHOLESTEROL |
| Spike Level | N | Mean | Std-Dev. | Median | F_Pseudo |
|---|---|---|---|---|---|
| >= Reporting Level | 43 | 53% | 19% | 50% | 17% |
| Total | 43 | 53% | 19% | 50% | 17% |
| Sample Statistics |
| CHOLESTEROL |
| Characteristic | N | % | % Basis |
|---|---|---|---|
| Plotted | 43 | 98% | Spiked |
| Estimated Values | 43 | 98% | Spiked |
| Deleted Values | 1 | 1% | Spiked + Not Spiked |
| Spiked, Censored | 0 | 0% | Spiked |
| Spiked | 45 | . | |
| False Negatives | 1 | 2% | 1 out of 44 |
| Not Spiked | 46 | . | |
| False Positives | 0 | 0% | 0 out of 46 |
| Plotted Points Statistics |
| COTININE |
| Spike Level | N | Mean | Std-Dev. | Median | F_Pseudo |
|---|---|---|---|---|---|
| < Reporting Level | 4 | 25% | 16% | 26% | 14% |
| >= Reporting Level | 40 | 41% | 16% | 44% | 17% |
| Total | 44 | 39% | 16% | 43% | 18% |
| Sample Statistics |
| COTININE |
| Characteristic | N | % | % Basis |
|---|---|---|---|
| Plotted | 44 | 98% | Spiked |
| Estimated Values | 44 | 98% | Spiked |
| Deleted Values | 6 | 7% | Spiked + Not Spiked |
| Spiked, Censored | 0 | 0% | Spiked |
| Spiked | 45 | . | |
| False Negatives | 1 | 2% | 1 out of 45 |
| Not Spiked | 46 | . | |
| False Positives | 1 | 3% | 1 out of 40 |
| Plotted Points Statistics |
| D-LIMONENE |
| Spike Level | N | Mean | Std-Dev. | Median | F_Pseudo |
|---|---|---|---|---|---|
| >= Reporting Level | 47 | 76% | 11% | 78% | 9% |
| Total | 47 | 76% | 11% | 78% | 9% |
| Sample Statistics |
| D-LIMONENE |
| Characteristic | N | % | % Basis |
|---|---|---|---|
| Plotted | 47 | 100% | Spiked |
| Estimated Values | 47 | 100% | Spiked |
| Deleted Values | 1 | 1% | Spiked + Not Spiked |
| Spiked, Censored | 0 | 0% | Spiked |
| Spiked | 48 | . | |
| False Negatives | 0 | 0% | 0 out of 47 |
| Not Spiked | 43 | . | |
| False Positives | 0 | 0% | 0 out of 43 |
| Plotted Points Statistics |
| DIAZINON |
| Spike Level | N | Mean | Std-Dev. | Median | F_Pseudo |
|---|---|---|---|---|---|
| >= Reporting Level | 46 | 86% | 22% | 93% | 17% |
| Total | 46 | 86% | 22% | 93% | 17% |
| Sample Statistics |
| DIAZINON |
| Characteristic | N | % | % Basis |
|---|---|---|---|
| Plotted | 46 | 100% | Spiked |
| Estimated Values | 2 | 4% | Spiked |
| Deleted Values | 1 | 1% | Spiked + Not Spiked |
| Spiked, Censored | 0 | 0% | Spiked |
| Spiked | 47 | . | |
| False Negatives | 0 | 0% | 0 out of 46 |
| Not Spiked | 44 | . | |
| False Positives | 1 | 2% | 1 out of 44 |
| Plotted Points Statistics |
| DICHLORVOS |
| Spike Level | N | Mean | Std-Dev. | Median | F_Pseudo |
|---|---|---|---|---|---|
| >= Reporting Level | 47 | 78% | 14% | 79% | 13% |
| Total | 47 | 78% | 14% | 79% | 13% |
| Sample Statistics |
| DICHLORVOS |
| Characteristic | N | % | % Basis |
|---|---|---|---|
| Plotted | 47 | 100% | Spiked |
| Estimated Values | 3 | 6% | Spiked |
| Deleted Values | 1 | 1% | Spiked + Not Spiked |
| Spiked, Censored | 0 | 0% | Spiked |
| Spiked | 47 | . | |
| False Negatives | 0 | 0% | 0 out of 47 |
| Not Spiked | 44 | . | |
| False Positives | 0 | 0% | 0 out of 43 |
| Plotted Points Statistics |
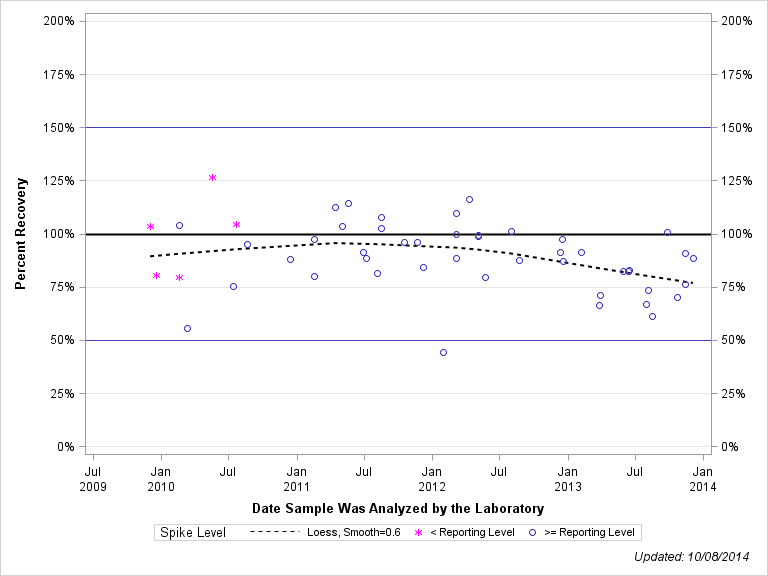
| DIETHYL PHTHALATE |
| Spike Level | N | Mean | Std-Dev. | Median | F_Pseudo |
|---|---|---|---|---|---|
| < Reporting Level | 2 | 130% | 2% | 130% | 2% |
| >= Reporting Level | 43 | 87% | 17% | 89% | 17% |
| Total | 45 | 89% | 18% | 89% | 16% |
| Sample Statistics |
| DIETHYL PHTHALATE |
| Characteristic | N | % | % Basis |
|---|---|---|---|
| Plotted | 45 | 98% | Spiked |
| Estimated Values | 6 | 13% | Spiked |
| Deleted Values | 1 | 1% | Spiked + Not Spiked |
| Spiked, Censored | 1 | 2% | Spiked |
| Spiked | 47 | . | |
| False Negatives | 0 | 0% | 0 out of 46 |
| Not Spiked | 40 | . | |
| False Positives | 4 | 10% | 4 out of 40 |
| Plotted Points Statistics |
| FLUORANTHENE |
| Spike Level | N | Mean | Std-Dev. | Median | F_Pseudo |
|---|---|---|---|---|---|
| < Reporting Level | 2 | 81% | 5% | 81% | 6% |
| >= Reporting Level | 44 | 84% | 13% | 84% | 13% |
| Total | 46 | 84% | 12% | 84% | 12% |
| Sample Statistics |
| FLUORANTHENE |
| Characteristic | N | % | % Basis |
|---|---|---|---|
| Plotted | 46 | 100% | Spiked |
| Estimated Values | 3 | 7% | Spiked |
| Deleted Values | 1 | 1% | Spiked + Not Spiked |
| Spiked, Censored | 0 | 0% | Spiked |
| Spiked | 47 | . | |
| False Negatives | 0 | 0% | 0 out of 46 |
| Not Spiked | 44 | . | |
| False Positives | 1 | 2% | 1 out of 44 |
| BQS OBSP Determination: |
| HEXAHYDROHEXAMETHYLCYCLOPENTABENZOPYRAN (HHCB) |
| SCHEDULE: 4433 , TESTIDCODE: 62823GCM99 |
| Open Data Set |
| Plotted Points Statistics |
| HEXAHYDROHEXAMETHYLCYCLOPENTABENZOPYRAN (HHCB) |
| Spike Level | N | Mean | Std-Dev. | Median | F_Pseudo |
|---|---|---|---|---|---|
| >= Reporting Level | 20 | 84% | 14% | 80% | 17% |
| Total | 20 | 84% | 14% | 80% | 17% |
| Sample Statistics |
| HEXAHYDROHEXAMETHYLCYCLOPENTABENZOPYRAN (HHCB) |
| Characteristic | N | % | % Basis |
|---|---|---|---|
| Plotted | 20 | 100% | Spiked |
| Estimated Values | 2 | 10% | Spiked |
| Deleted Values | 1 | 1% | Spiked + Not Spiked |
| Spiked, Censored | 0 | 0% | Spiked |
| Spiked | 21 | . | |
| False Negatives | 0 | 0% | 0 out of 20 |
| Not Spiked | 70 | . | |
| False Positives | 2 | 3% | 2 out of 70 |
| Plotted Points Statistics |
| INDOLE |
| Spike Level | N | Mean | Std-Dev. | Median | F_Pseudo |
|---|---|---|---|---|---|
| < Reporting Level | 4 | 78% | 4% | 80% | 3% |
| >= Reporting Level | 44 | 76% | 21% | 82% | 18% |
| Total | 48 | 76% | 20% | 81% | 16% |
| Sample Statistics |
| INDOLE |
| Characteristic | N | % | % Basis |
|---|---|---|---|
| Plotted | 48 | 100% | Spiked |
| Estimated Values | 11 | 23% | Spiked |
| Deleted Values | 1 | 1% | Spiked + Not Spiked |
| Spiked, Censored | 0 | 0% | Spiked |
| Spiked | 49 | . | |
| False Negatives | 0 | 0% | 0 out of 48 |
| Not Spiked | 42 | . | |
| False Positives | 0 | 0% | 0 out of 42 |
| Plotted Points Statistics |
| ISOBORNEOL |
| Spike Level | N | Mean | Std-Dev. | Median | F_Pseudo |
|---|---|---|---|---|---|
| < Reporting Level | 2 | 74% | 5% | 74% | 6% |
| >= Reporting Level | 43 | 85% | 19% | 82% | 19% |
| Total | 45 | 85% | 19% | 82% | 19% |
| Sample Statistics |
| ISOBORNEOL |
| Characteristic | N | % | % Basis |
|---|---|---|---|
| Plotted | 45 | 96% | Spiked |
| Estimated Values | 8 | 17% | Spiked |
| Deleted Values | 1 | 1% | Spiked + Not Spiked |
| Spiked, Censored | 1 | 2% | Spiked |
| Spiked | 47 | . | |
| False Negatives | 1 | 2% | 1 out of 47 |
| Not Spiked | 44 | . | |
| False Positives | 0 | 0% | 0 out of 43 |
| Plotted Points Statistics |
| ISOPHORONE |
| Spike Level | N | Mean | Std-Dev. | Median | F_Pseudo |
|---|---|---|---|---|---|
| < Reporting Level | 2 | 119% | 49% | 119% | 51% |
| >= Reporting Level | 45 | 85% | 12% | 85% | 11% |
| Total | 47 | 86% | 15% | 85% | 12% |
| Sample Statistics |
| ISOPHORONE |
| Characteristic | N | % | % Basis |
|---|---|---|---|
| Plotted | 47 | 100% | Spiked |
| Estimated Values | 3 | 6% | Spiked |
| Deleted Values | 1 | 1% | Spiked + Not Spiked |
| Spiked, Censored | 0 | 0% | Spiked |
| Spiked | 47 | . | |
| False Negatives | 0 | 0% | 0 out of 47 |
| Not Spiked | 44 | . | |
| False Positives | 0 | 0% | 0 out of 43 |
| Plotted Points Statistics |
| ISOPROPYLBENZENE |
| Spike Level | N | Mean | Std-Dev. | Median | F_Pseudo |
|---|---|---|---|---|---|
| >= Reporting Level | 47 | 83% | 10% | 82% | 10% |
| Total | 47 | 83% | 10% | 82% | 10% |
| Sample Statistics |
| ISOPROPYLBENZENE |
| Characteristic | N | % | % Basis |
|---|---|---|---|
| Plotted | 47 | 100% | Spiked |
| Estimated Values | 47 | 100% | Spiked |
| Deleted Values | 1 | 1% | Spiked + Not Spiked |
| Spiked, Censored | 0 | 0% | Spiked |
| Spiked | 47 | . | |
| False Negatives | 0 | 0% | 0 out of 47 |
| Not Spiked | 44 | . | |
| False Positives | 1 | 2% | 1 out of 43 |
| Plotted Points Statistics |
| ISOQUINOLINE |
| Spike Level | N | Mean | Std-Dev. | Median | F_Pseudo |
|---|---|---|---|---|---|
| >= Reporting Level | 42 | 75% | 19% | 76% | 17% |
| Total | 42 | 75% | 19% | 76% | 17% |
| Sample Statistics |
| ISOQUINOLINE |
| Characteristic | N | % | % Basis |
|---|---|---|---|
| Plotted | 42 | 100% | Spiked |
| Estimated Values | 5 | 12% | Spiked |
| Deleted Values | 1 | 1% | Spiked + Not Spiked |
| Spiked, Censored | 0 | 0% | Spiked |
| Spiked | 42 | . | |
| False Negatives | 0 | 0% | 0 out of 42 |
| Not Spiked | 49 | . | |
| False Positives | 1 | 2% | 1 out of 48 |
| Plotted Points Statistics |
| MENTHOL |
| Spike Level | N | Mean | Std-Dev. | Median | F_Pseudo |
|---|---|---|---|---|---|
| < Reporting Level | 9 | 110% | 58% | 100% | 21% |
| >= Reporting Level | 37 | 91% | 20% | 88% | 19% |
| Total | 46 | 95% | 31% | 90% | 20% |
| Sample Statistics |
| MENTHOL |
| Characteristic | N | % | % Basis |
|---|---|---|---|
| Plotted | 46 | 100% | Spiked |
| Estimated Values | 8 | 17% | Spiked |
| Deleted Values | 1 | 1% | Spiked + Not Spiked |
| Spiked, Censored | 0 | 0% | Spiked |
| Spiked | 47 | . | |
| False Negatives | 0 | 0% | 0 out of 46 |
| Not Spiked | 44 | . | |
| False Positives | 0 | 0% | 0 out of 44 |
| Plotted Points Statistics |
| METALAXYL |
| Spike Level | N | Mean | Std-Dev. | Median | F_Pseudo |
|---|---|---|---|---|---|
| < Reporting Level | 5 | 99% | 20% | 104% | 18% |
| >= Reporting Level | 45 | 88% | 16% | 89% | 14% |
| Total | 50 | 90% | 16% | 90% | 15% |
| Sample Statistics |
| METALAXYL |
| Characteristic | N | % | % Basis |
|---|---|---|---|
| Plotted | 50 | 100% | Spiked |
| Estimated Values | 8 | 16% | Spiked |
| Deleted Values | 1 | 1% | Spiked + Not Spiked |
| Spiked, Censored | 0 | 0% | Spiked |
| Spiked | 51 | . | |
| False Negatives | 0 | 0% | 0 out of 50 |
| Not Spiked | 40 | . | |
| False Positives | 1 | 3% | 1 out of 40 |
| Plotted Points Statistics |
| METHYL SALICYLATE |
| Spike Level | N | Mean | Std-Dev. | Median | F_Pseudo |
|---|---|---|---|---|---|
| >= Reporting Level | 47 | 81% | 13% | 82% | 14% |
| Total | 47 | 81% | 13% | 82% | 14% |
| Sample Statistics |
| METHYL SALICYLATE |
| Characteristic | N | % | % Basis |
|---|---|---|---|
| Plotted | 47 | 100% | Spiked |
| Estimated Values | 2 | 4% | Spiked |
| Deleted Values | 1 | 1% | Spiked + Not Spiked |
| Spiked, Censored | 0 | 0% | Spiked |
| Spiked | 47 | . | |
| False Negatives | 0 | 0% | 0 out of 47 |
| Not Spiked | 44 | . | |
| False Positives | 0 | 0% | 0 out of 43 |
| Plotted Points Statistics |
| METOLACHLOR |
| Spike Level | N | Mean | Std-Dev. | Median | F_Pseudo |
|---|---|---|---|---|---|
| >= Reporting Level | 44 | 77% | 12% | 77% | 11% |
| Total | 44 | 77% | 12% | 77% | 11% |
| Sample Statistics |
| METOLACHLOR |
| Characteristic | N | % | % Basis |
|---|---|---|---|
| Plotted | 44 | 100% | Spiked |
| Estimated Values | 4 | 9% | Spiked |
| Deleted Values | 1 | 1% | Spiked + Not Spiked |
| Spiked, Censored | 0 | 0% | Spiked |
| Spiked | 45 | . | |
| False Negatives | 0 | 0% | 0 out of 44 |
| Not Spiked | 46 | . | |
| False Positives | 2 | 4% | 2 out of 46 |
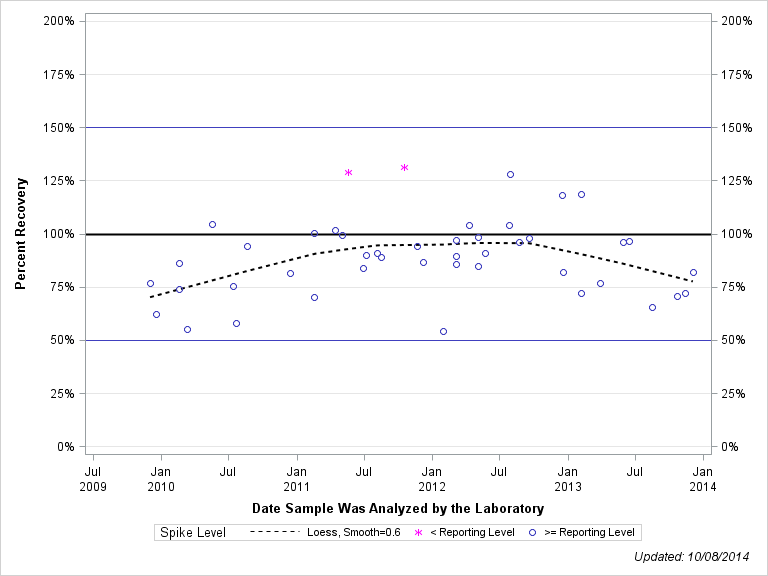
| BQS OBSP Determination: |
| N,N-DIETHYL-META-TOLUAMIDE (DEET) |
| SCHEDULE: 4433 , TESTIDCODE: 61947GCM99 |
| Open Data Set |
| Plotted Points Statistics |
| N,N-DIETHYL-META-TOLUAMIDE (DEET) |
| Spike Level | N | Mean | Std-Dev. | Median | F_Pseudo |
|---|---|---|---|---|---|
| >= Reporting Level | 46 | 82% | 15% | 83% | 12% |
| Total | 46 | 82% | 15% | 83% | 12% |
| Sample Statistics |
| N,N-DIETHYL-META-TOLUAMIDE (DEET) |
| Characteristic | N | % | % Basis |
|---|---|---|---|
| Plotted | 46 | 100% | Spiked |
| Estimated Values | 6 | 13% | Spiked |
| Deleted Values | 1 | 1% | Spiked + Not Spiked |
| Spiked, Censored | 0 | 0% | Spiked |
| Spiked | 47 | . | |
| False Negatives | 0 | 0% | 0 out of 46 |
| Not Spiked | 44 | . | |
| False Positives | 2 | 5% | 2 out of 44 |
| Plotted Points Statistics |
| NAPHTHALENE |
| Spike Level | N | Mean | Std-Dev. | Median | F_Pseudo |
|---|---|---|---|---|---|
| < Reporting Level | 4 | 73% | 4% | 72% | 4% |
| >= Reporting Level | 42 | 88% | 21% | 86% | 14% |
| Total | 46 | 87% | 20% | 85% | 12% |
| Sample Statistics |
| NAPHTHALENE |
| Characteristic | N | % | % Basis |
|---|---|---|---|
| Plotted | 46 | 100% | Spiked |
| Estimated Values | 8 | 17% | Spiked |
| Deleted Values | 1 | 1% | Spiked + Not Spiked |
| Spiked, Censored | 0 | 0% | Spiked |
| Spiked | 47 | . | |
| False Negatives | 0 | 0% | 0 out of 46 |
| Not Spiked | 44 | . | |
| False Positives | 0 | 0% | 0 out of 44 |
| Plotted Points Statistics |
| P-CRESOL |
| Spike Level | N | Mean | Std-Dev. | Median | F_Pseudo |
|---|---|---|---|---|---|
| >= Reporting Level | 47 | 80% | 16% | 83% | 18% |
| Total | 47 | 80% | 16% | 83% | 18% |
| Sample Statistics |
| P-CRESOL |
| Characteristic | N | % | % Basis |
|---|---|---|---|
| Plotted | 47 | 100% | Spiked |
| Estimated Values | 4 | 9% | Spiked |
| Deleted Values | 1 | 1% | Spiked + Not Spiked |
| Spiked, Censored | 0 | 0% | Spiked |
| Spiked | 47 | . | |
| False Negatives | 0 | 0% | 0 out of 47 |
| Not Spiked | 44 | . | |
| False Positives | 0 | 0% | 0 out of 43 |
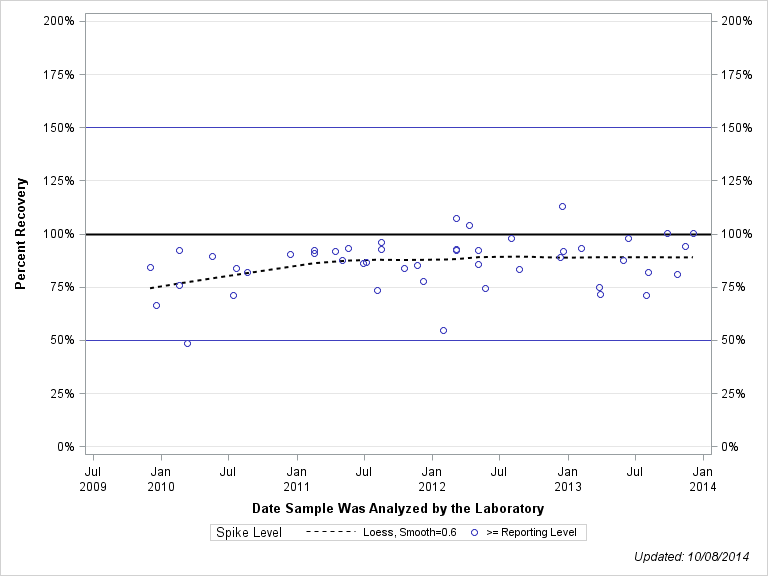
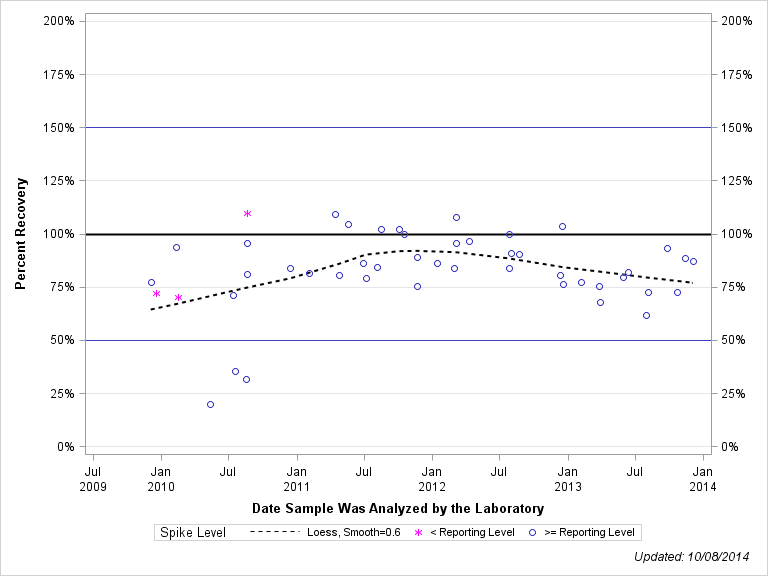
| BQS OBSP Determination: |
| PARA-NONYLPHENOL (TOTAL) (BRANCHED) |
| SCHEDULE: 4433 , TESTIDCODE: 62829GCM99 |
| Open Data Set |
| Plotted Points Statistics |
| PARA-NONYLPHENOL (TOTAL) (BRANCHED) |
| Spike Level | N | Mean | Std-Dev. | Median | F_Pseudo |
|---|---|---|---|---|---|
| >= Reporting Level | 36 | 69% | 13% | 69% | 10% |
| Total | 36 | 69% | 13% | 69% | 10% |
| Sample Statistics |
| PARA-NONYLPHENOL (TOTAL) (BRANCHED) |
| Characteristic | N | % | % Basis |
|---|---|---|---|
| Plotted | 36 | 100% | Spiked |
| Estimated Values | 36 | 100% | Spiked |
| Deleted Values | 1 | 1% | Spiked + Not Spiked |
| Spiked, Censored | 0 | 0% | Spiked |
| Spiked | 37 | . | |
| False Negatives | 0 | 0% | 0 out of 36 |
| Not Spiked | 54 | . | |
| False Positives | 0 | 0% | 0 out of 54 |
| Plotted Points Statistics |
| PENTACHLOROPHENOL |
| Spike Level | N | Mean | Std-Dev. | Median | F_Pseudo |
|---|---|---|---|---|---|
| < Reporting Level | 11 | 76% | 26% | 78% | 18% |
| >= Reporting Level | 32 | 69% | 21% | 71% | 19% |
| Total | 43 | 71% | 22% | 72% | 20% |
| Sample Statistics |
| PENTACHLOROPHENOL |
| Characteristic | N | % | % Basis |
|---|---|---|---|
| Plotted | 43 | 98% | Spiked |
| Estimated Values | 43 | 98% | Spiked |
| Deleted Values | 1 | 1% | Spiked + Not Spiked |
| Spiked, Censored | 0 | 0% | Spiked |
| Spiked | 45 | . | |
| False Negatives | 1 | 2% | 1 out of 44 |
| Not Spiked | 46 | . | |
| False Positives | 0 | 0% | 0 out of 46 |
| Plotted Points Statistics |
| PHENANTHRENE |
| Spike Level | N | Mean | Std-Dev. | Median | F_Pseudo |
|---|---|---|---|---|---|
| < Reporting Level | 2 | 72% | 8% | 72% | 9% |
| >= Reporting Level | 44 | 81% | 13% | 82% | 13% |
| Total | 46 | 81% | 13% | 81% | 13% |
| Sample Statistics |
| PHENANTHRENE |
| Characteristic | N | % | % Basis |
|---|---|---|---|
| Plotted | 46 | 100% | Spiked |
| Estimated Values | 4 | 9% | Spiked |
| Deleted Values | 1 | 1% | Spiked + Not Spiked |
| Spiked, Censored | 0 | 0% | Spiked |
| Spiked | 47 | . | |
| False Negatives | 0 | 0% | 0 out of 46 |
| Not Spiked | 44 | . | |
| False Positives | 1 | 2% | 1 out of 44 |
| Plotted Points Statistics |
| PHENOL |
| Spike Level | N | Mean | Std-Dev. | Median | F_Pseudo |
|---|---|---|---|---|---|
| >= Reporting Level | 47 | 66% | 18% | 71% | 19% |
| Total | 47 | 66% | 18% | 71% | 19% |
| Sample Statistics |
| PHENOL |
| Characteristic | N | % | % Basis |
|---|---|---|---|
| Plotted | 47 | 100% | Spiked |
| Estimated Values | 3 | 6% | Spiked |
| Deleted Values | 1 | 1% | Spiked + Not Spiked |
| Spiked, Censored | 0 | 0% | Spiked |
| Spiked | 47 | . | |
| False Negatives | 0 | 0% | 0 out of 47 |
| Not Spiked | 44 | . | |
| False Positives | 2 | 5% | 2 out of 43 |
| Plotted Points Statistics |
| PROMETON |
| Spike Level | N | Mean | Std-Dev. | Median | F_Pseudo |
|---|---|---|---|---|---|
| < Reporting Level | 2 | 106% | 0% | 106% | 0% |
| >= Reporting Level | 45 | 86% | 16% | 89% | 14% |
| Total | 47 | 87% | 16% | 89% | 15% |
| Sample Statistics |
| PROMETON |
| Characteristic | N | % | % Basis |
|---|---|---|---|
| Plotted | 47 | 100% | Spiked |
| Estimated Values | 7 | 15% | Spiked |
| Deleted Values | 1 | 1% | Spiked + Not Spiked |
| Spiked, Censored | 0 | 0% | Spiked |
| Spiked | 47 | . | |
| False Negatives | 0 | 0% | 0 out of 47 |
| Not Spiked | 44 | . | |
| False Positives | 1 | 2% | 1 out of 43 |
| Plotted Points Statistics |
| PYRENE |
| Spike Level | N | Mean | Std-Dev. | Median | F_Pseudo |
|---|---|---|---|---|---|
| < Reporting Level | 2 | 80% | 4% | 80% | 4% |
| >= Reporting Level | 44 | 84% | 14% | 84% | 13% |
| Total | 46 | 84% | 13% | 83% | 13% |
| Sample Statistics |
| PYRENE |
| Characteristic | N | % | % Basis |
|---|---|---|---|
| Plotted | 46 | 100% | Spiked |
| Estimated Values | 3 | 7% | Spiked |
| Deleted Values | 1 | 1% | Spiked + Not Spiked |
| Spiked, Censored | 0 | 0% | Spiked |
| Spiked | 47 | . | |
| False Negatives | 0 | 0% | 0 out of 46 |
| Not Spiked | 44 | . | |
| False Positives | 0 | 0% | 0 out of 44 |
| Plotted Points Statistics |
| TETRACHLORETHYLENE |
| Spike Level | N | Mean | Std-Dev. | Median | F_Pseudo |
|---|---|---|---|---|---|
| < Reporting Level | 2 | 44% | 0% | 44% | 0% |
| >= Reporting Level | 43 | 58% | 9% | 56% | 9% |
| Total | 45 | 57% | 9% | 56% | 9% |
| Sample Statistics |
| TETRACHLORETHYLENE |
| Characteristic | N | % | % Basis |
|---|---|---|---|
| Plotted | 45 | 100% | Spiked |
| Estimated Values | 45 | 100% | Spiked |
| Deleted Values | 1 | 1% | Spiked + Not Spiked |
| Spiked, Censored | 0 | 0% | Spiked |
| Spiked | 45 | . | |
| False Negatives | 0 | 0% | 0 out of 45 |
| Not Spiked | 46 | . | |
| False Positives | 0 | 0% | 0 out of 45 |
| Plotted Points Statistics |
| TRIBUTYL PHOSPHATE |
| Spike Level | N | Mean | Std-Dev. | Median | F_Pseudo |
|---|---|---|---|---|---|
| >= Reporting Level | 47 | 82% | 21% | 83% | 18% |
| Total | 47 | 82% | 21% | 83% | 18% |
| Sample Statistics |
| TRIBUTYL PHOSPHATE |
| Characteristic | N | % | % Basis |
|---|---|---|---|
| Plotted | 47 | 100% | Spiked |
| Estimated Values | 11 | 23% | Spiked |
| Deleted Values | 1 | 1% | Spiked + Not Spiked |
| Spiked, Censored | 0 | 0% | Spiked |
| Spiked | 47 | . | |
| False Negatives | 0 | 0% | 0 out of 47 |
| Not Spiked | 44 | . | |
| False Positives | 1 | 2% | 1 out of 43 |
| Plotted Points Statistics |
| TRICLOSAN |
| Spike Level | N | Mean | Std-Dev. | Median | F_Pseudo |
|---|---|---|---|---|---|
| >= Reporting Level | 46 | 94% | 19% | 96% | 18% |
| Total | 46 | 94% | 19% | 96% | 18% |
| Sample Statistics |
| TRICLOSAN |
| Characteristic | N | % | % Basis |
|---|---|---|---|
| Plotted | 46 | 100% | Spiked |
| Estimated Values | 4 | 9% | Spiked |
| Deleted Values | 1 | 1% | Spiked + Not Spiked |
| Spiked, Censored | 0 | 0% | Spiked |
| Spiked | 47 | . | |
| False Negatives | 0 | 0% | 0 out of 46 |
| Not Spiked | 44 | . | |
| False Positives | 1 | 2% | 1 out of 44 |
| BQS OBSP Determination: |
| TRIETHYL CITRATE (ETHYL CITRATE) |
| SCHEDULE: 4433 , TESTIDCODE: 62833GCM99 |
| Open Data Set |
| Plotted Points Statistics |
| TRIETHYL CITRATE (ETHYL CITRATE) |
| Spike Level | N | Mean | Std-Dev. | Median | F_Pseudo |
|---|---|---|---|---|---|
| >= Reporting Level | 45 | 70% | 29% | 72% | 29% |
| Total | 45 | 70% | 29% | 72% | 29% |
| Sample Statistics |
| TRIETHYL CITRATE (ETHYL CITRATE) |
| Characteristic | N | % | % Basis |
|---|---|---|---|
| Plotted | 45 | 98% | Spiked |
| Estimated Values | 8 | 17% | Spiked |
| Deleted Values | 1 | 1% | Spiked + Not Spiked |
| Spiked, Censored | 0 | 0% | Spiked |
| Spiked | 47 | . | |
| False Negatives | 1 | 2% | 1 out of 46 |
| Not Spiked | 44 | . | |
| False Positives | 2 | 5% | 2 out of 44 |
| Plotted Points Statistics |
| TRIPHENYL PHOSPHATE |
| Spike Level | N | Mean | Std-Dev. | Median | F_Pseudo |
|---|---|---|---|---|---|
| < Reporting Level | 3 | 79% | 16% | 70% | 20% |
| >= Reporting Level | 44 | 85% | 17% | 88% | 13% |
| Total | 47 | 85% | 17% | 88% | 14% |
| Sample Statistics |
| TRIPHENYL PHOSPHATE |
| Characteristic | N | % | % Basis |
|---|---|---|---|
| Plotted | 47 | 100% | Spiked |
| Estimated Values | 10 | 21% | Spiked |
| Deleted Values | 1 | 1% | Spiked + Not Spiked |
| Spiked, Censored | 0 | 0% | Spiked |
| Spiked | 47 | . | |
| False Negatives | 0 | 0% | 0 out of 47 |
| Not Spiked | 40 | . | |
| False Positives | 2 | 5% | 2 out of 39 |
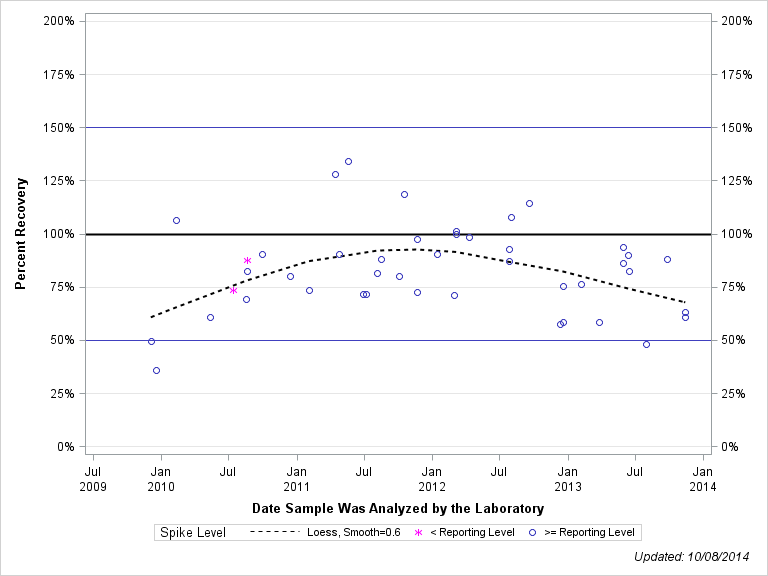
| BQS OBSP Determination: |
| TRIS(2-BUTOXYETHYL)PHOSPHATE |
| SCHEDULE: 4433 , TESTIDCODE: 62830GCM99 |
| Open Data Set |
| Plotted Points Statistics |
| TRIS(2-BUTOXYETHYL)PHOSPHATE |
| Spike Level | N | Mean | Std-Dev. | Median | F_Pseudo |
|---|---|---|---|---|---|
| < Reporting Level | 8 | 117% | 40% | 108% | 32% |
| >= Reporting Level | 37 | 92% | 28% | 95% | 25% |
| Total | 45 | 96% | 31% | 97% | 25% |
| Sample Statistics |
| TRIS(2-BUTOXYETHYL)PHOSPHATE |
| Characteristic | N | % | % Basis |
|---|---|---|---|
| Plotted | 45 | 98% | Spiked |
| Estimated Values | 45 | 98% | Spiked |
| Deleted Values | 1 | 1% | Spiked + Not Spiked |
| Spiked, Censored | 1 | 2% | Spiked |
| Spiked | 47 | . | |
| False Negatives | 0 | 0% | 0 out of 46 |
| Not Spiked | 44 | . | |
| False Positives | 0 | 0% | 0 out of 44 |
| BQS OBSP Determination: |
| TRIS(2-CHLOROETHYL)PHOSPHATE |
| SCHEDULE: 4433 , TESTIDCODE: 62831GCM99 |
| Open Data Set |
| Plotted Points Statistics |
| TRIS(2-CHLOROETHYL)PHOSPHATE |
| Spike Level | N | Mean | Std-Dev. | Median | F_Pseudo |
|---|---|---|---|---|---|
| < Reporting Level | 3 | 84% | 22% | 72% | 29% |
| >= Reporting Level | 44 | 83% | 18% | 84% | 13% |
| Total | 47 | 83% | 18% | 84% | 15% |
| Sample Statistics |
| TRIS(2-CHLOROETHYL)PHOSPHATE |
| Characteristic | N | % | % Basis |
|---|---|---|---|
| Plotted | 47 | 100% | Spiked |
| Estimated Values | 5 | 11% | Spiked |
| Deleted Values | 1 | 1% | Spiked + Not Spiked |
| Spiked, Censored | 0 | 0% | Spiked |
| Spiked | 47 | . | |
| False Negatives | 0 | 0% | 0 out of 47 |
| Not Spiked | 44 | . | |
| False Positives | 1 | 2% | 1 out of 43 |
| BQS OBSP Determination: |
| TRIS(DICHLORISOPROPYL)PHOSPHATE |
| SCHEDULE: 4433 , TESTIDCODE: 61707GCM99 |
| Open Data Set |