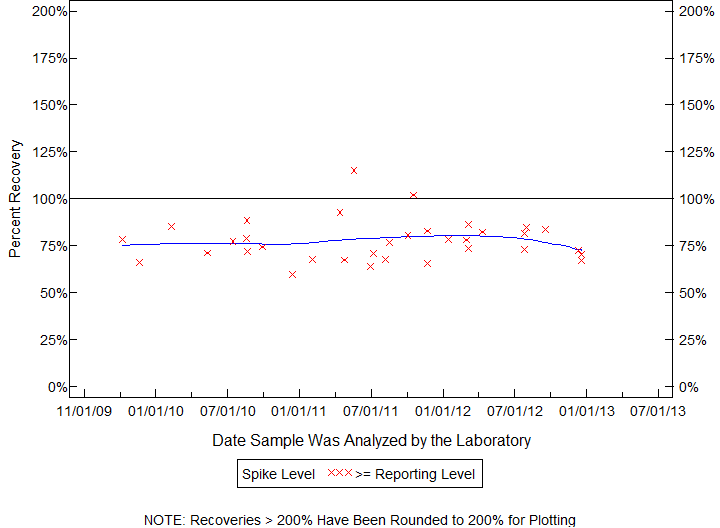
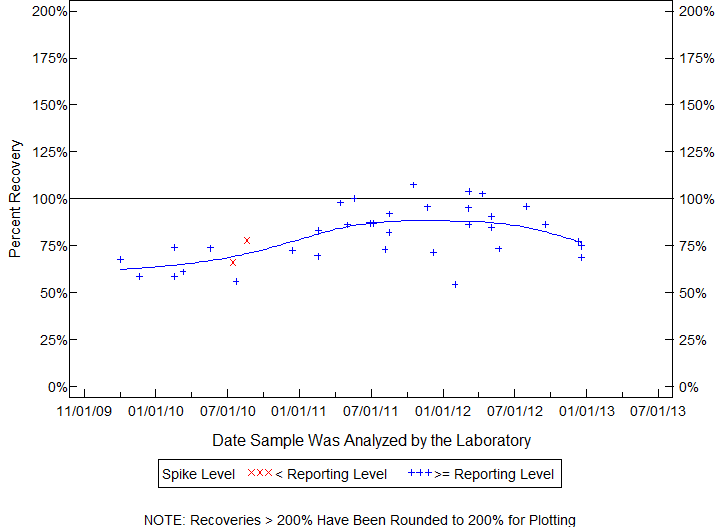
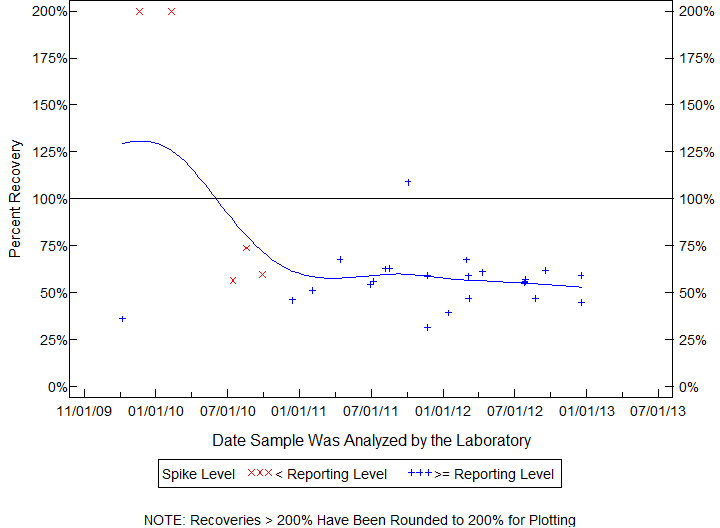
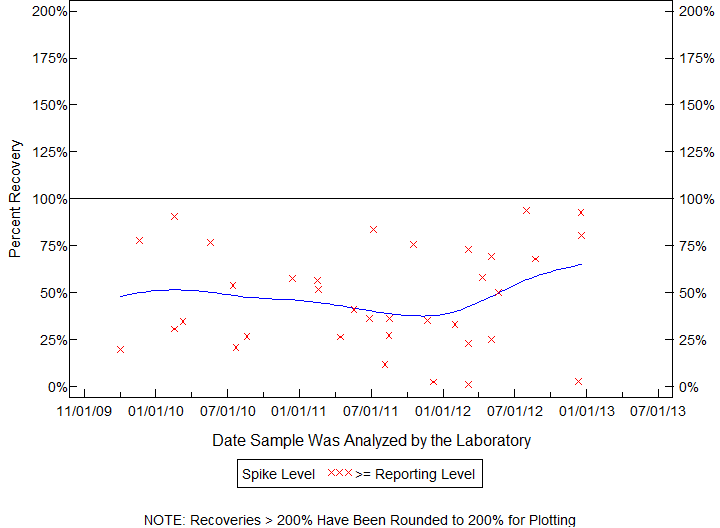
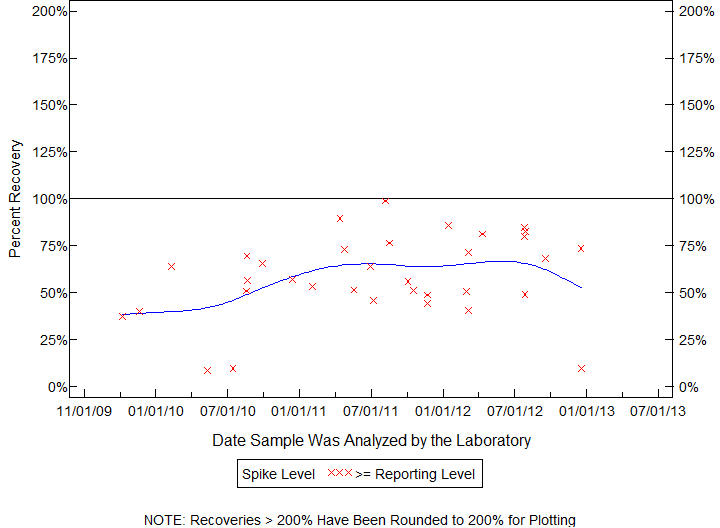
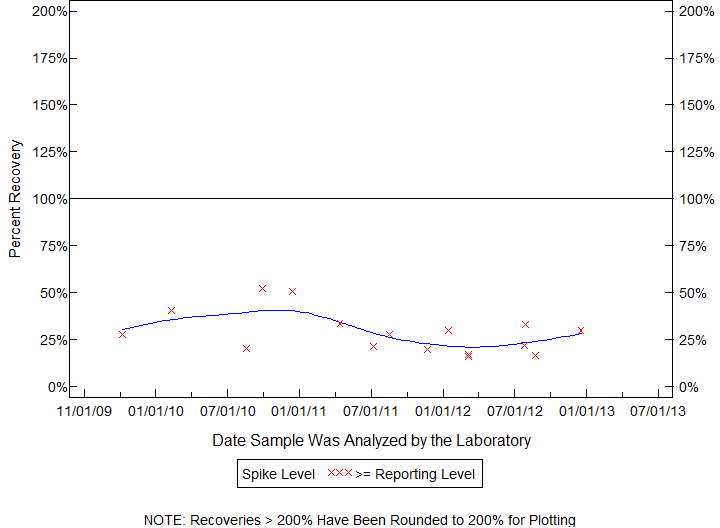
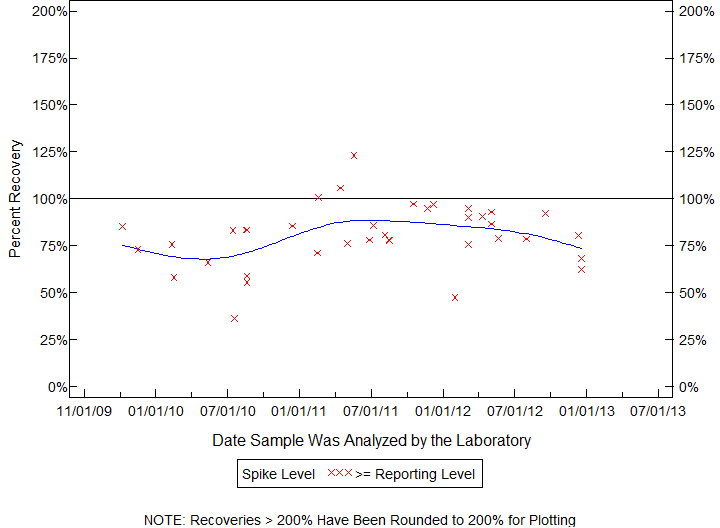
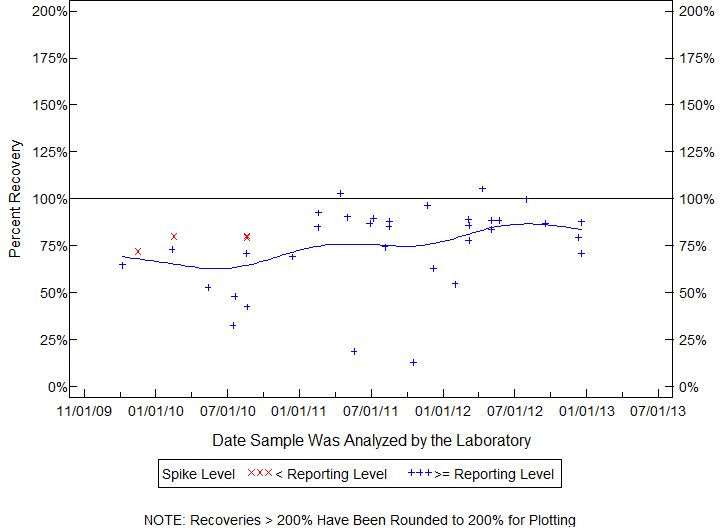
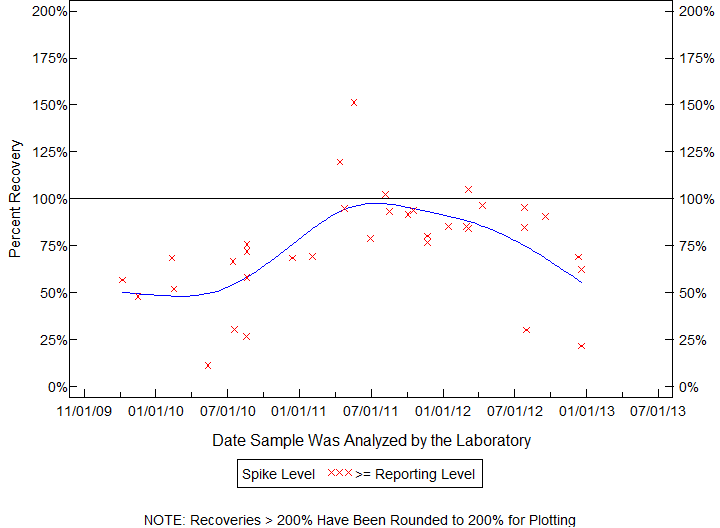
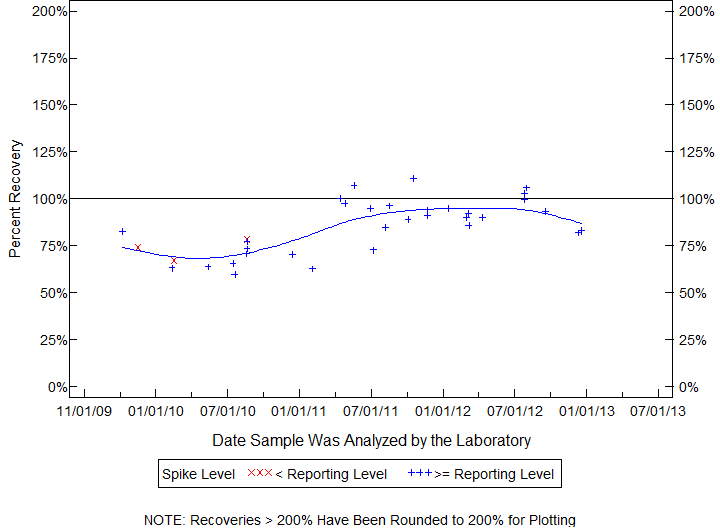
| BQS ORGANIC BLIND SAMPLES |
| METALAXYL, |
| Schedule: 4433 Testid: 04254GCM99 |
| Measured in MICROGRAMS PER LITER |
| 12/02/09 TO 12/20/12 |
| Open Data Set |
| BQS ORGANIC BLIND SAMPLES |
| METALAXYL, |
| Schedule: 4433 Testid: 04254GCM99 |
| Measured in MICROGRAMS PER LITER |
| 12/02/09 TO 12/20/12 |
| Open Data Set |
| Statistics for the Plotted Points |
| METALAXYL |
| Spike Level | N | Mean | Std-Dev. | Median | F_Pseudo |
|---|---|---|---|---|---|
| < Reporting Level | 5 | 99% | 20% | 104% | 18% |
| >= Reporting Level | 31 | 93% | 16% | 96% | 12% |
| Total | 36 | 94% | 16% | 96% | 13% |
| Miscellaneous Statistics for the Samples |
| METALAXYL |
| Characteristic | N | % | % Basis |
|---|---|---|---|
| Plotted | 36 | 100% | Spiked |
| Estimated Values | 7 | 19% | Spiked |
| Deleted Values | 0 | 0% | Spiked + Not Spiked |
| Spiked, Censored | 0 | 0% | Spiked |
| Spiked | 36 | . | |
| False Negatives | 0 | 0% | 0 out of 36 |
| Not Spiked | 38 | . | |
| False Positives | 1 | 3% | 1 out of 38 |
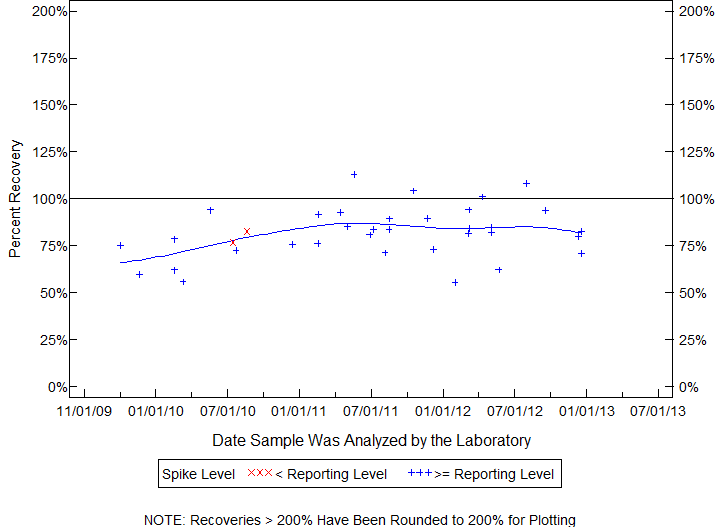
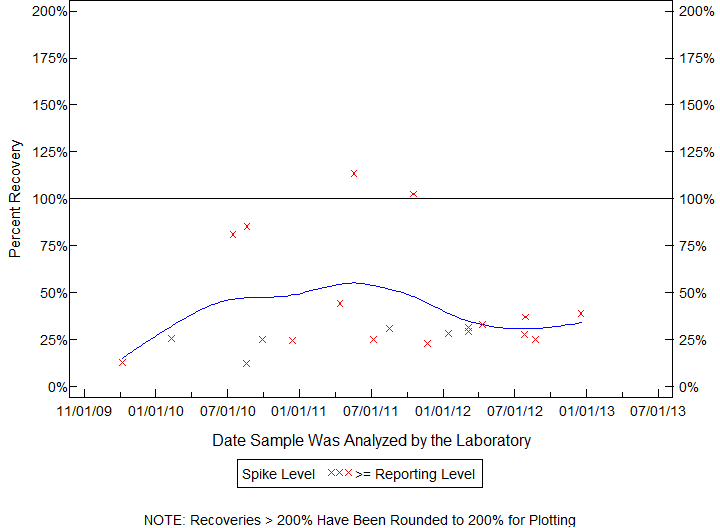
| BQS ORGANIC BLIND SAMPLES |
| 2-METHYLNAPHTHALENE, |
| Schedule: 4433 Testid: 30194GCM99 |
| Measured in MICROGRAMS PER LITER |
| 12/02/09 TO 12/20/12 |
| Open Data Set |
| Statistics for the Plotted Points |
| 2-METHYLNAPHTHALENE |
| Spike Level | N | Mean | Std-Dev. | Median | F_Pseudo |
|---|---|---|---|---|---|
| < Reporting Level | 2 | 72% | 1% | 72% | 1% |
| >= Reporting Level | 34 | 82% | 15% | 82% | 13% |
| Total | 36 | 82% | 15% | 81% | 12% |
| Miscellaneous Statistics for the Samples |
| 2-METHYLNAPHTHALENE |
| Characteristic | N | % | % Basis |
|---|---|---|---|
| Plotted | 36 | 100% | Spiked |
| Estimated Values | 5 | 14% | Spiked |
| Deleted Values | 0 | 0% | Spiked + Not Spiked |
| Spiked, Censored | 0 | 0% | Spiked |
| Spiked | 36 | . | |
| False Negatives | 0 | 0% | 0 out of 36 |
| Not Spiked | 38 | . | |
| False Positives | 1 | 3% | 1 out of 38 |
| BQS ORGANIC BLIND SAMPLES |
| DICHLORVOS, |
| Schedule: 4433 Testid: 30218GCM99 |
| Measured in MICROGRAMS PER LITER |
| 12/02/09 TO 12/20/12 |
| Open Data Set |

| Statistics for the Plotted Points |
| DICHLORVOS |
| Spike Level | N | Mean | Std-Dev. | Median | F_Pseudo |
|---|---|---|---|---|---|
| >= Reporting Level | 36 | 77% | 14% | 79% | 12% |
| Total | 36 | 77% | 14% | 79% | 12% |
| Miscellaneous Statistics for the Samples |
| DICHLORVOS |
| Characteristic | N | % | % Basis |
|---|---|---|---|
| Plotted | 36 | 100% | Spiked |
| Estimated Values | 3 | 8% | Spiked |
| Deleted Values | 0 | 0% | Spiked + Not Spiked |
| Spiked, Censored | 0 | 0% | Spiked |
| Spiked | 36 | . | |
| False Negatives | 0 | 0% | 0 out of 36 |
| Not Spiked | 38 | . | |
| False Positives | 0 | 0% | 0 out of 38 |
| BQS ORGANIC BLIND SAMPLES |
| BROMACIL, |
| Schedule: 4433 Testid: 30234GCM99 |
| Measured in MICROGRAMS PER LITER |
| 12/04/09 TO 12/20/12 |
| Open Data Set |
| Statistics for the Plotted Points |
| BROMACIL |
| Spike Level | N | Mean | Std-Dev. | Median | F_Pseudo |
|---|---|---|---|---|---|
| >= Reporting Level | 34 | 86% | 13% | 84% | 15% |
| Total | 34 | 86% | 13% | 84% | 15% |
| Miscellaneous Statistics for the Samples |
| BROMACIL |
| Characteristic | N | % | % Basis |
|---|---|---|---|
| Plotted | 34 | 100% | Spiked |
| Estimated Values | 5 | 15% | Spiked |
| Deleted Values | 0 | 0% | Spiked + Not Spiked |
| Spiked, Censored | 0 | 0% | Spiked |
| Spiked | 34 | . | |
| False Negatives | 0 | 0% | 0 out of 34 |
| Not Spiked | 40 | . | |
| False Positives | 0 | 0% | 0 out of 40 |
| BQS ORGANIC BLIND SAMPLES |
| BROMOFORM, |
| Schedule: 4433 Testid: 32104GCM99 |
| Measured in MICROGRAMS PER LITER |
| 12/02/09 TO 12/20/12 |
| Open Data Set |

| Statistics for the Plotted Points |
| BROMOFORM |
| Spike Level | N | Mean | Std-Dev. | Median | F_Pseudo |
|---|---|---|---|---|---|
| < Reporting Level | 2 | 67% | 22% | 67% | 24% |
| >= Reporting Level | 34 | 81% | 13% | 82% | 10% |
| Total | 36 | 81% | 13% | 82% | 11% |
| Miscellaneous Statistics for the Samples |
| BROMOFORM |
| Characteristic | N | % | % Basis |
|---|---|---|---|
| Plotted | 36 | 100% | Spiked |
| Estimated Values | 6 | 17% | Spiked |
| Deleted Values | 0 | 0% | Spiked + Not Spiked |
| Spiked, Censored | 0 | 0% | Spiked |
| Spiked | 36 | . | |
| False Negatives | 0 | 0% | 0 out of 36 |
| Not Spiked | 38 | . | |
| False Positives | 0 | 0% | 0 out of 38 |
| BQS ORGANIC BLIND SAMPLES |
| ANTHRACENE, |
| Schedule: 4433 Testid: 34220GCM99 |
| Measured in MICROGRAMS PER LITER |
| 12/02/09 TO 12/20/12 |
| Open Data Set |

| Statistics for the Plotted Points |
| ANTHRACENE |
| Spike Level | N | Mean | Std-Dev. | Median | F_Pseudo |
|---|---|---|---|---|---|
| < Reporting Level | 2 | 74% | 3% | 74% | 3% |
| >= Reporting Level | 34 | 80% | 13% | 80% | 13% |
| Total | 36 | 80% | 12% | 79% | 12% |
| Miscellaneous Statistics for the Samples |
| ANTHRACENE |
| Characteristic | N | % | % Basis |
|---|---|---|---|
| Plotted | 36 | 100% | Spiked |
| Estimated Values | 5 | 14% | Spiked |
| Deleted Values | 0 | 0% | Spiked + Not Spiked |
| Spiked, Censored | 0 | 0% | Spiked |
| Spiked | 36 | . | |
| False Negatives | 0 | 0% | 0 out of 36 |
| Not Spiked | 23 | . | |
| False Positives | 1 | 4% | 1 out of 23 |
| BQS ORGANIC BLIND SAMPLES |
| BENZO[A]PYRENE, |
| Schedule: 4433 Testid: 34247GCM99 |
| Measured in MICROGRAMS PER LITER |
| 12/02/09 TO 12/20/12 |
| Open Data Set |
| Statistics for the Plotted Points |
| BENZO[A]PYRENE |
| Spike Level | N | Mean | Std-Dev. | Median | F_Pseudo |
|---|---|---|---|---|---|
| < Reporting Level | 2 | 60% | 11% | 60% | 11% |
| >= Reporting Level | 34 | 80% | 19% | 85% | 22% |
| Total | 36 | 79% | 20% | 83% | 22% |
| Miscellaneous Statistics for the Samples |
| BENZO[A]PYRENE |
| Characteristic | N | % | % Basis |
|---|---|---|---|
| Plotted | 36 | 100% | Spiked |
| Estimated Values | 7 | 19% | Spiked |
| Deleted Values | 0 | 0% | Spiked + Not Spiked |
| Spiked, Censored | 0 | 0% | Spiked |
| Spiked | 36 | . | |
| False Negatives | 0 | 0% | 0 out of 36 |
| Not Spiked | 38 | . | |
| False Positives | 1 | 3% | 1 out of 38 |
| BQS ORGANIC BLIND SAMPLES |
| DIETHYL PHTHALATE, |
| Schedule: 4433 Testid: 34336GCM99 |
| Measured in MICROGRAMS PER LITER |
| 12/02/09 TO 12/19/12 |
| Open Data Set |
| Statistics for the Plotted Points |
| DIETHYL PHTHALATE |
| Spike Level | N | Mean | Std-Dev. | Median | F_Pseudo |
|---|---|---|---|---|---|
| < Reporting Level | 2 | 130% | 2% | 130% | 2% |
| >= Reporting Level | 34 | 88% | 16% | 90% | 13% |
| Total | 36 | 91% | 19% | 90% | 13% |
| Miscellaneous Statistics for the Samples |
| DIETHYL PHTHALATE |
| Characteristic | N | % | % Basis |
|---|---|---|---|
| Plotted | 36 | 97% | Spiked |
| Estimated Values | 4 | 11% | Spiked |
| Deleted Values | 0 | 0% | Spiked + Not Spiked |
| Spiked, Censored | 1 | 3% | Spiked |
| Spiked | 37 | . | |
| False Negatives | 0 | 0% | 0 out of 37 |
| Not Spiked | 37 | . | |
| False Positives | 8 | 22% | 8 out of 37 |
| BQS ORGANIC BLIND SAMPLES |
| FLUORANTHENE, |
| Schedule: 4433 Testid: 34376GCM99 |
| Measured in MICROGRAMS PER LITER |
| 12/02/09 TO 12/20/12 |
| Open Data Set |
| Statistics for the Plotted Points |
| FLUORANTHENE |
| Spike Level | N | Mean | Std-Dev. | Median | F_Pseudo |
|---|---|---|---|---|---|
| < Reporting Level | 2 | 81% | 5% | 81% | 6% |
| >= Reporting Level | 34 | 82% | 13% | 83% | 13% |
| Total | 36 | 82% | 13% | 83% | 12% |
| Miscellaneous Statistics for the Samples |
| FLUORANTHENE |
| Characteristic | N | % | % Basis |
|---|---|---|---|
| Plotted | 36 | 100% | Spiked |
| Estimated Values | 3 | 8% | Spiked |
| Deleted Values | 0 | 0% | Spiked + Not Spiked |
| Spiked, Censored | 0 | 0% | Spiked |
| Spiked | 36 | . | |
| False Negatives | 0 | 0% | 0 out of 36 |
| Not Spiked | 38 | . | |
| False Positives | 1 | 3% | 1 out of 38 |
| BQS ORGANIC BLIND SAMPLES |
| ISOPHORONE, |
| Schedule: 4433 Testid: 34408GCM99 |
| Measured in MICROGRAMS PER LITER |
| 12/02/09 TO 12/20/12 |
| Open Data Set |
| Statistics for the Plotted Points |
| ISOPHORONE |
| Spike Level | N | Mean | Std-Dev. | Median | F_Pseudo |
|---|---|---|---|---|---|
| < Reporting Level | 2 | 119% | 49% | 119% | 51% |
| >= Reporting Level | 34 | 84% | 13% | 86% | 10% |
| Total | 36 | 86% | 17% | 86% | 10% |
| Miscellaneous Statistics for the Samples |
| ISOPHORONE |
| Characteristic | N | % | % Basis |
|---|---|---|---|
| Plotted | 36 | 100% | Spiked |
| Estimated Values | 3 | 8% | Spiked |
| Deleted Values | 0 | 0% | Spiked + Not Spiked |
| Spiked, Censored | 0 | 0% | Spiked |
| Spiked | 36 | . | |
| False Negatives | 0 | 0% | 0 out of 36 |
| Not Spiked | 38 | . | |
| False Positives | 0 | 0% | 0 out of 38 |
| BQS ORGANIC BLIND SAMPLES |
| PHENANTHRENE, |
| Schedule: 4433 Testid: 34461GCM99 |
| Measured in MICROGRAMS PER LITER |
| 12/02/09 TO 12/20/12 |
| Open Data Set |
| Statistics for the Plotted Points |
| PHENANTHRENE |
| Spike Level | N | Mean | Std-Dev. | Median | F_Pseudo |
|---|---|---|---|---|---|
| < Reporting Level | 2 | 72% | 8% | 72% | 9% |
| >= Reporting Level | 34 | 81% | 15% | 83% | 15% |
| Total | 36 | 80% | 14% | 80% | 15% |
| Miscellaneous Statistics for the Samples |
| PHENANTHRENE |
| Characteristic | N | % | % Basis |
|---|---|---|---|
| Plotted | 36 | 100% | Spiked |
| Estimated Values | 4 | 11% | Spiked |
| Deleted Values | 0 | 0% | Spiked + Not Spiked |
| Spiked, Censored | 0 | 0% | Spiked |
| Spiked | 36 | . | |
| False Negatives | 0 | 0% | 0 out of 36 |
| Not Spiked | 38 | . | |
| False Positives | 1 | 3% | 1 out of 38 |
| BQS ORGANIC BLIND SAMPLES |
| PYRENE, |
| Schedule: 4433 Testid: 34469GCM99 |
| Measured in MICROGRAMS PER LITER |
| 12/02/09 TO 12/20/12 |
| Open Data Set |
| Statistics for the Plotted Points |
| PYRENE |
| Spike Level | N | Mean | Std-Dev. | Median | F_Pseudo |
|---|---|---|---|---|---|
| < Reporting Level | 2 | 80% | 4% | 80% | 4% |
| >= Reporting Level | 34 | 82% | 14% | 82% | 14% |
| Total | 36 | 82% | 14% | 82% | 12% |
| Miscellaneous Statistics for the Samples |
| PYRENE |
| Characteristic | N | % | % Basis |
|---|---|---|---|
| Plotted | 36 | 100% | Spiked |
| Estimated Values | 3 | 8% | Spiked |
| Deleted Values | 0 | 0% | Spiked + Not Spiked |
| Spiked, Censored | 0 | 0% | Spiked |
| Spiked | 36 | . | |
| False Negatives | 0 | 0% | 0 out of 36 |
| Not Spiked | 38 | . | |
| False Positives | 0 | 0% | 0 out of 38 |
| BQS ORGANIC BLIND SAMPLES |
| TETRACHLORETHYLENE, |
| Schedule: 4433 Testid: 34475GCM99 |
| Measured in MICROGRAMS PER LITER |
| 12/04/09 TO 12/20/12 |
| Open Data Set |
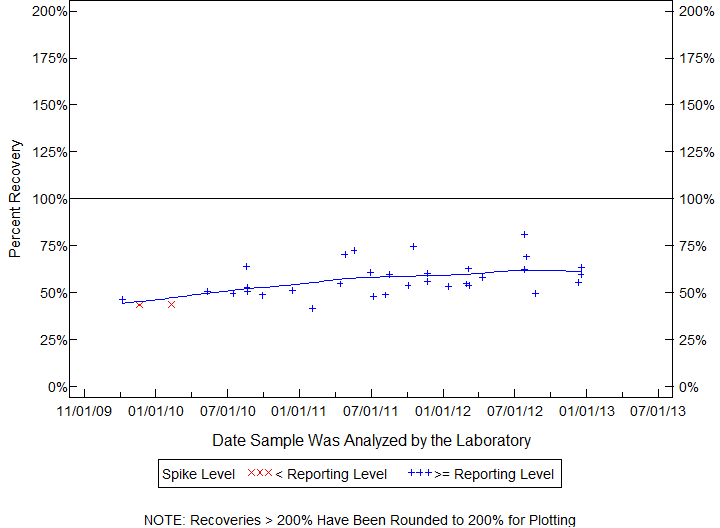
| Statistics for the Plotted Points |
| TETRACHLORETHYLENE |
| Spike Level | N | Mean | Std-Dev. | Median | F_Pseudo |
|---|---|---|---|---|---|
| < Reporting Level | 2 | 44% | 0% | 44% | 0% |
| >= Reporting Level | 32 | 58% | 9% | 55% | 9% |
| Total | 34 | 57% | 9% | 55% | 9% |
| Miscellaneous Statistics for the Samples |
| TETRACHLORETHYLENE |
| Characteristic | N | % | % Basis |
|---|---|---|---|
| Plotted | 34 | 100% | Spiked |
| Estimated Values | 34 | 100% | Spiked |
| Deleted Values | 0 | 0% | Spiked + Not Spiked |
| Spiked, Censored | 0 | 0% | Spiked |
| Spiked | 34 | . | |
| False Negatives | 0 | 0% | 0 out of 34 |
| Not Spiked | 40 | . | |
| False Positives | 0 | 0% | 0 out of 40 |
| BQS ORGANIC BLIND SAMPLES |
| 1,4-DICHLOROBENZENE, |
| Schedule: 4433 Testid: 34571GCM99 |
| Measured in MICROGRAMS PER LITER |
| 12/02/09 TO 12/20/12 |
| Open Data Set |
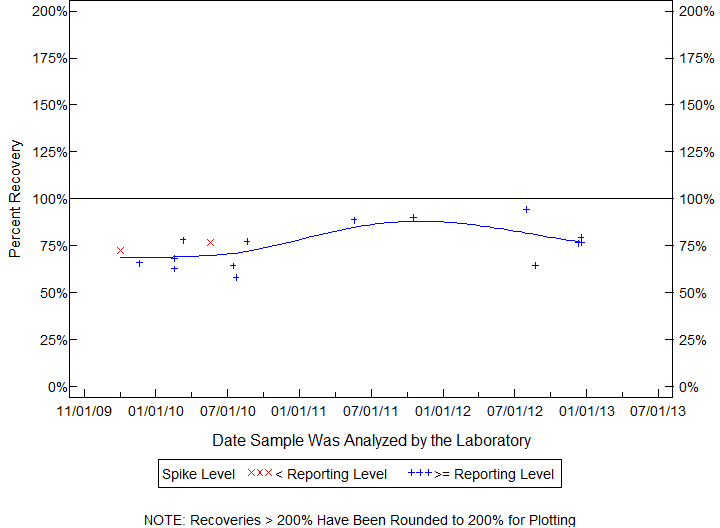
| Statistics for the Plotted Points |
| 1,4-DICHLOROBENZENE |
| Spike Level | N | Mean | Std-Dev. | Median | F_Pseudo |
|---|---|---|---|---|---|
| < Reporting Level | 2 | 75% | 3% | 75% | 3% |
| >= Reporting Level | 14 | 75% | 11% | 77% | 11% |
| Total | 16 | 75% | 10% | 77% | 10% |
| Miscellaneous Statistics for the Samples |
| 1,4-DICHLOROBENZENE |
| Characteristic | N | % | % Basis |
|---|---|---|---|
| Plotted | 16 | 100% | Spiked |
| Estimated Values | 2 | 13% | Spiked |
| Deleted Values | 0 | 0% | Spiked + Not Spiked |
| Spiked, Censored | 0 | 0% | Spiked |
| Spiked | 16 | . | |
| False Negatives | 0 | 0% | 0 out of 16 |
| Not Spiked | 58 | . | |
| False Positives | 0 | 0% | 0 out of 58 |
| BQS ORGANIC BLIND SAMPLES |
| PHENOL, |
| Schedule: 4433 Testid: 34694GCM99 |
| Measured in MICROGRAMS PER LITER |
| 12/02/09 TO 12/20/12 |
| Open Data Set |
| Statistics for the Plotted Points |
| PHENOL |
| Spike Level | N | Mean | Std-Dev. | Median | F_Pseudo |
|---|---|---|---|---|---|
| >= Reporting Level | 36 | 67% | 18% | 70% | 16% |
| Total | 36 | 67% | 18% | 70% | 16% |
| Miscellaneous Statistics for the Samples |
| PHENOL |
| Characteristic | N | % | % Basis |
|---|---|---|---|
| Plotted | 36 | 100% | Spiked |
| Estimated Values | 3 | 8% | Spiked |
| Deleted Values | 0 | 0% | Spiked + Not Spiked |
| Spiked, Censored | 0 | 0% | Spiked |
| Spiked | 36 | . | |
| False Negatives | 0 | 0% | 0 out of 36 |
| Not Spiked | 38 | . | |
| False Positives | 2 | 5% | 2 out of 38 |
| BQS ORGANIC BLIND SAMPLES |
| NAPHTHALENE, |
| Schedule: 4433 Testid: 34696GCM99 |
| Measured in MICROGRAMS PER LITER |
| 12/02/09 TO 12/20/12 |
| Open Data Set |
| Statistics for the Plotted Points |
| NAPHTHALENE |
| Spike Level | N | Mean | Std-Dev. | Median | F_Pseudo |
|---|---|---|---|---|---|
| < Reporting Level | 4 | 73% | 4% | 72% | 4% |
| >= Reporting Level | 32 | 87% | 23% | 85% | 13% |
| Total | 36 | 85% | 22% | 84% | 13% |
| Miscellaneous Statistics for the Samples |
| NAPHTHALENE |
| Characteristic | N | % | % Basis |
|---|---|---|---|
| Plotted | 36 | 100% | Spiked |
| Estimated Values | 8 | 22% | Spiked |
| Deleted Values | 0 | 0% | Spiked + Not Spiked |
| Spiked, Censored | 0 | 0% | Spiked |
| Spiked | 36 | . | |
| False Negatives | 0 | 0% | 0 out of 36 |
| Not Spiked | 38 | . | |
| False Positives | 0 | 0% | 0 out of 38 |
| BQS ORGANIC BLIND SAMPLES |
| CHLORPYRIFOS, |
| Schedule: 4433 Testid: 38932GCM99 |
| Measured in MICROGRAMS PER LITER |
| 12/02/09 TO 12/20/12 |
| Open Data Set |
| Statistics for the Plotted Points |
| CHLORPYRIFOS |
| Spike Level | N | Mean | Std-Dev. | Median | F_Pseudo |
|---|---|---|---|---|---|
| >= Reporting Level | 36 | 86% | 13% | 88% | 7% |
| Total | 36 | 86% | 13% | 88% | 7% |
| Miscellaneous Statistics for the Samples |
| CHLORPYRIFOS |
| Characteristic | N | % | % Basis |
|---|---|---|---|
| Plotted | 36 | 100% | Spiked |
| Estimated Values | 3 | 8% | Spiked |
| Deleted Values | 0 | 0% | Spiked + Not Spiked |
| Spiked, Censored | 0 | 0% | Spiked |
| Spiked | 36 | . | |
| False Negatives | 0 | 0% | 0 out of 36 |
| Not Spiked | 38 | . | |
| False Positives | 1 | 3% | 1 out of 38 |
| BQS ORGANIC BLIND SAMPLES |
| PENTACHLOROPHENOL, |
| Schedule: 4433 Testid: 39032GCM99 |
| Measured in MICROGRAMS PER LITER |
| 12/04/09 TO 12/19/12 |
| Open Data Set |

| Statistics for the Plotted Points |
| PENTACHLOROPHENOL |
| Spike Level | N | Mean | Std-Dev. | Median | F_Pseudo |
|---|---|---|---|---|---|
| < Reporting Level | 11 | 76% | 26% | 78% | 18% |
| >= Reporting Level | 23 | 71% | 22% | 75% | 22% |
| Total | 34 | 73% | 23% | 76% | 19% |
| Miscellaneous Statistics for the Samples |
| PENTACHLOROPHENOL |
| Characteristic | N | % | % Basis |
|---|---|---|---|
| Plotted | 34 | 97% | Spiked |
| Estimated Values | 34 | 97% | Spiked |
| Deleted Values | 0 | 0% | Spiked + Not Spiked |
| Spiked, Censored | 0 | 0% | Spiked |
| Spiked | 35 | . | |
| False Negatives | 1 | 3% | 1 out of 35 |
| Not Spiked | 39 | . | |
| False Positives | 0 | 0% | 0 out of 39 |
| BQS ORGANIC BLIND SAMPLES |
| PROMETON, |
| Schedule: 4433 Testid: 39056GCM99 |
| Measured in MICROGRAMS PER LITER |
| 12/02/09 TO 12/20/12 |
| Open Data Set |
| Statistics for the Plotted Points |
| PROMETON |
| Spike Level | N | Mean | Std-Dev. | Median | F_Pseudo |
|---|---|---|---|---|---|
| < Reporting Level | 2 | 106% | 0% | 106% | 0% |
| >= Reporting Level | 34 | 90% | 16% | 92% | 15% |
| Total | 36 | 90% | 16% | 93% | 15% |
| Miscellaneous Statistics for the Samples |
| PROMETON |
| Characteristic | N | % | % Basis |
|---|---|---|---|
| Plotted | 36 | 100% | Spiked |
| Estimated Values | 7 | 19% | Spiked |
| Deleted Values | 0 | 0% | Spiked + Not Spiked |
| Spiked, Censored | 0 | 0% | Spiked |
| Spiked | 36 | . | |
| False Negatives | 0 | 0% | 0 out of 36 |
| Not Spiked | 38 | . | |
| False Positives | 1 | 3% | 1 out of 38 |
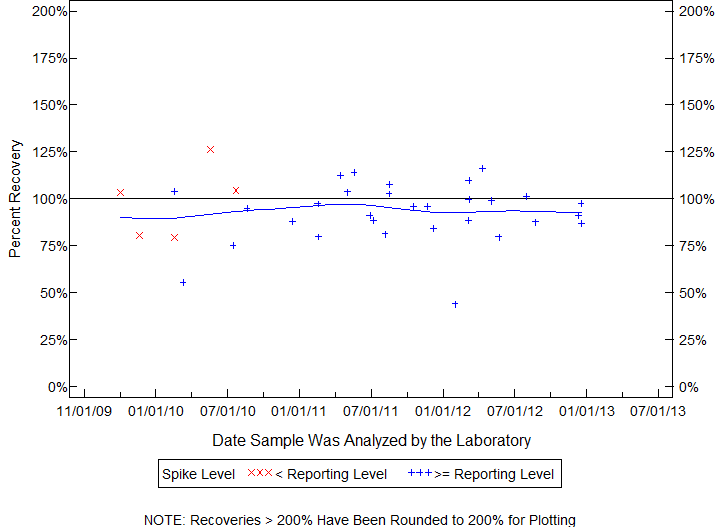
| BQS ORGANIC BLIND SAMPLES |
| BIS(2-ETHYLHEXYL) PHTHALATE, |
| Schedule: 4433 Testid: 39100GCM99 |
| Measured in MICROGRAMS PER LITER |
| 12/04/09 TO 12/19/12 |
| Open Data Set |
| Statistics for the Plotted Points |
| BIS(2-ETHYLHEXYL) PHTHALATE |
| Spike Level | N | Mean | Std-Dev. | Median | F_Pseudo |
|---|---|---|---|---|---|
| < Reporting Level | 5 | 118% | 75% | 74% | 104% |
| >= Reporting Level | 23 | 56% | 15% | 56% | 11% |
| Total | 28 | 67% | 40% | 58% | 10% |
| Miscellaneous Statistics for the Samples |
| BIS(2-ETHYLHEXYL) PHTHALATE |
| Characteristic | N | % | % Basis |
|---|---|---|---|
| Plotted | 28 | 82% | Spiked |
| Estimated Values | 10 | 29% | Spiked |
| Deleted Values | 1 | 1% | Spiked + Not Spiked |
| Spiked, Censored | 4 | 12% | Spiked |
| Spiked | 35 | . | |
| False Negatives | 2 | 6% | 2 out of 34 |
| Not Spiked | 39 | . | |
| False Positives | 4 | 10% | 4 out of 39 |
| BQS ORGANIC BLIND SAMPLES |
| DIAZINON, |
| Schedule: 4433 Testid: 39570GCM99 |
| Measured in MICROGRAMS PER LITER |
| 12/02/09 TO 12/19/12 |
| Open Data Set |
| Statistics for the Plotted Points |
| DIAZINON |
| Spike Level | N | Mean | Std-Dev. | Median | F_Pseudo |
|---|---|---|---|---|---|
| >= Reporting Level | 37 | 87% | 24% | 95% | 17% |
| Total | 37 | 87% | 24% | 95% | 17% |
| Miscellaneous Statistics for the Samples |
| DIAZINON |
| Characteristic | N | % | % Basis |
|---|---|---|---|
| Plotted | 37 | 100% | Spiked |
| Estimated Values | 1 | 3% | Spiked |
| Deleted Values | 0 | 0% | Spiked + Not Spiked |
| Spiked, Censored | 0 | 0% | Spiked |
| Spiked | 37 | . | |
| False Negatives | 0 | 0% | 0 out of 37 |
| Not Spiked | 37 | . | |
| False Positives | 1 | 3% | 1 out of 37 |
| BQS ORGANIC BLIND SAMPLES |
| ATRAZINE, |
| Schedule: 4433 Testid: 39630GCM99 |
| Measured in MICROGRAMS PER LITER |
| 12/02/09 TO 12/20/12 |
| Open Data Set |
| Statistics for the Plotted Points |
| ATRAZINE |
| Spike Level | N | Mean | Std-Dev. | Median | F_Pseudo |
|---|---|---|---|---|---|
| >= Reporting Level | 34 | 90% | 15% | 92% | 14% |
| Total | 34 | 90% | 15% | 92% | 14% |
| Miscellaneous Statistics for the Samples |
| ATRAZINE |
| Characteristic | N | % | % Basis |
|---|---|---|---|
| Plotted | 34 | 100% | Spiked |
| Estimated Values | 1 | 3% | Spiked |
| Deleted Values | 0 | 0% | Spiked + Not Spiked |
| Spiked, Censored | 0 | 0% | Spiked |
| Spiked | 34 | . | |
| False Negatives | 0 | 0% | 0 out of 34 |
| Not Spiked | 40 | . | |
| False Positives | 1 | 3% | 1 out of 40 |
| BQS ORGANIC BLIND SAMPLES |
| CARBARYL, |
| Schedule: 4433 Testid: 39750GCM99 |
| Measured in MICROGRAMS PER LITER |
| 12/02/09 TO 12/20/12 |
| Open Data Set |
| Statistics for the Plotted Points |
| CARBARYL |
| Spike Level | N | Mean | Std-Dev. | Median | F_Pseudo |
|---|---|---|---|---|---|
| >= Reporting Level | 36 | 78% | 24% | 76% | 18% |
| Total | 36 | 78% | 24% | 76% | 18% |
| Miscellaneous Statistics for the Samples |
| CARBARYL |
| Characteristic | N | % | % Basis |
|---|---|---|---|
| Plotted | 36 | 100% | Spiked |
| Estimated Values | 36 | 100% | Spiked |
| Deleted Values | 0 | 0% | Spiked + Not Spiked |
| Spiked, Censored | 0 | 0% | Spiked |
| Spiked | 36 | . | |
| False Negatives | 0 | 0% | 0 out of 36 |
| Not Spiked | 38 | . | |
| False Positives | 1 | 3% | 1 out of 38 |
| BQS ORGANIC BLIND SAMPLES |
| 3-TERT-BUTYL-4-HYDROXY ANISOLE (BHA), |
| Schedule: 4433 Testid: 61702GCM99 |
| Measured in MICROGRAMS PER LITER |
| 12/02/09 TO 12/20/12 |
| Open Data Set |
| Statistics for the Plotted Points |
| 3-TERT-BUTYL-4-HYDROXY ANISOLE (BHA) |
| Spike Level | N | Mean | Std-Dev. | Median | F_Pseudo |
|---|---|---|---|---|---|
| >= Reporting Level | 35 | 47% | 27% | 41% | 35% |
| Total | 35 | 47% | 27% | 41% | 35% |
| Miscellaneous Statistics for the Samples |
| 3-TERT-BUTYL-4-HYDROXY ANISOLE (BHA) |
| Characteristic | N | % | % Basis |
|---|---|---|---|
| Plotted | 35 | 97% | Spiked |
| Estimated Values | 35 | 97% | Spiked |
| Deleted Values | 2 | 3% | Spiked + Not Spiked |
| Spiked, Censored | 0 | 0% | Spiked |
| Spiked | 36 | . | |
| False Negatives | 1 | 3% | 1 out of 36 |
| Not Spiked | 38 | . | |
| False Positives | 0 | 0% | 0 out of 36 |
| BQS ORGANIC BLIND SAMPLES |
| 4-NONYLPHENOL DIETHOXYLATE, TOTAL (NPEO2), |
| Schedule: 4433 Testid: 61703GCM99 |
| Measured in MICROGRAMS PER LITER |
| 12/04/09 TO 12/18/12 |
| Open Data Set |
| Statistics for the Plotted Points |
| 4-NONYLPHENOL DIETHOXYLATE, TOTAL (NPEO2) |
| Spike Level | N | Mean | Std-Dev. | Median | F_Pseudo |
|---|---|---|---|---|---|
| >= Reporting Level | 21 | 41% | 29% | 30% | 10% |
| Total | 21 | 41% | 29% | 30% | 10% |
| Miscellaneous Statistics for the Samples |
| 4-NONYLPHENOL DIETHOXYLATE, TOTAL (NPEO2) |
| Characteristic | N | % | % Basis |
|---|---|---|---|
| Plotted | 21 | 100% | Spiked |
| Estimated Values | 21 | 100% | Spiked |
| Deleted Values | 0 | 0% | Spiked + Not Spiked |
| Spiked, Censored | 0 | 0% | Spiked |
| Spiked | 21 | . | |
| False Negatives | 0 | 0% | 0 out of 21 |
| Not Spiked | 53 | . | |
| False Positives | 0 | 0% | 0 out of 53 |
| BQS ORGANIC BLIND SAMPLES |
| 4-NONYLPHENOL MONOETHOXYLATE, |
| Schedule: 4433 Testid: 61704GCM99 |
| Measured in MICROGRAMS PER LITER |
| 12/04/09 TO 08/24/12 |
| Open Data Set |
| Statistics for the Plotted Points |
| 4-NONYLPHENOL MONOETHOXYLATE |
| Spike Level | N | Mean | Std-Dev. | Median | F_Pseudo |
|---|---|---|---|---|---|
| < Reporting Level | 1 | 178% | . | 178% | 0% |
| >= Reporting Level | 15 | 147% | 25% | 146% | 20% |
| Total | 16 | 149% | 26% | 147% | 19% |
| Miscellaneous Statistics for the Samples |
| 4-NONYLPHENOL MONOETHOXYLATE |
| Characteristic | N | % | % Basis |
|---|---|---|---|
| Plotted | 16 | 94% | Spiked |
| Estimated Values | 16 | 94% | Spiked |
| Deleted Values | 0 | 0% | Spiked + Not Spiked |
| Spiked, Censored | 0 | 0% | Spiked |
| Spiked | 17 | . | |
| False Negatives | 1 | 6% | 1 out of 17 |
| Not Spiked | 57 | . | |
| False Positives | 6 | 11% | 6 out of 57 |
| BQS ORGANIC BLIND SAMPLES |
| TRIS(DICHLORISOPROPYL)PHOSPHATE, |
| Schedule: 4433 Testid: 61707GCM99 |
| Measured in MICROGRAMS PER LITER |
| 12/02/09 TO 12/19/12 |
| Open Data Set |
| Statistics for the Plotted Points |
| TRIS(DICHLORISOPROPYL)PHOSPHATE |
| Spike Level | N | Mean | Std-Dev. | Median | F_Pseudo |
|---|---|---|---|---|---|
| < Reporting Level | 2 | 97% | 5% | 97% | 5% |
| >= Reporting Level | 35 | 100% | 20% | 101% | 21% |
| Total | 37 | 99% | 20% | 101% | 15% |
| Miscellaneous Statistics for the Samples |
| TRIS(DICHLORISOPROPYL)PHOSPHATE |
| Characteristic | N | % | % Basis |
|---|---|---|---|
| Plotted | 37 | 100% | Spiked |
| Estimated Values | 6 | 16% | Spiked |
| Deleted Values | 0 | 0% | Spiked + Not Spiked |
| Spiked, Censored | 0 | 0% | Spiked |
| Spiked | 37 | . | |
| False Negatives | 0 | 0% | 0 out of 37 |
| Not Spiked | 37 | . | |
| False Positives | 1 | 3% | 1 out of 37 |
| BQS ORGANIC BLIND SAMPLES |
| TRICLOSAN, |
| Schedule: 4433 Testid: 61708GCM99 |
| Measured in MICROGRAMS PER LITER |
| 12/02/09 TO 12/19/12 |
| Open Data Set |

| Statistics for the Plotted Points |
| TRICLOSAN |
| Spike Level | N | Mean | Std-Dev. | Median | F_Pseudo |
|---|---|---|---|---|---|
| >= Reporting Level | 37 | 96% | 19% | 97% | 18% |
| Total | 37 | 96% | 19% | 97% | 18% |
| Miscellaneous Statistics for the Samples |
| TRICLOSAN |
| Characteristic | N | % | % Basis |
|---|---|---|---|
| Plotted | 37 | 100% | Spiked |
| Estimated Values | 3 | 8% | Spiked |
| Deleted Values | 0 | 0% | Spiked + Not Spiked |
| Spiked, Censored | 0 | 0% | Spiked |
| Spiked | 37 | . | |
| False Negatives | 0 | 0% | 0 out of 37 |
| Not Spiked | 37 | . | |
| False Positives | 1 | 3% | 1 out of 37 |
| BQS ORGANIC BLIND SAMPLES |
| 5-METHYL-1H-BENZOTRIAZOLE, |
| Schedule: 4433 Testid: 61944GCM99 |
| Measured in MICROGRAMS PER LITER |
| 12/04/09 TO 12/19/12 |
| Open Data Set |
| Statistics for the Plotted Points |
| 5-METHYL-1H-BENZOTRIAZOLE |
| Spike Level | N | Mean | Std-Dev. | Median | F_Pseudo |
|---|---|---|---|---|---|
| >= Reporting Level | 34 | 59% | 22% | 57% | 18% |
| Total | 34 | 59% | 22% | 57% | 18% |
| Miscellaneous Statistics for the Samples |
| 5-METHYL-1H-BENZOTRIAZOLE |
| Characteristic | N | % | % Basis |
|---|---|---|---|
| Plotted | 34 | 97% | Spiked |
| Estimated Values | 34 | 97% | Spiked |
| Deleted Values | 4 | 5% | Spiked + Not Spiked |
| Spiked, Censored | 0 | 0% | Spiked |
| Spiked | 35 | . | |
| False Negatives | 1 | 3% | 1 out of 35 |
| Not Spiked | 39 | . | |
| False Positives | 1 | 3% | 1 out of 35 |
| BQS ORGANIC BLIND SAMPLES |
| COTININE, |
| Schedule: 4433 Testid: 61945GCM99 |
| Measured in MICROGRAMS PER LITER |
| 12/04/09 TO 12/20/12 |
| Open Data Set |
| Statistics for the Plotted Points |
| COTININE |
| Spike Level | N | Mean | Std-Dev. | Median | F_Pseudo |
|---|---|---|---|---|---|
| < Reporting Level | 4 | 25% | 16% | 26% | 14% |
| >= Reporting Level | 29 | 43% | 15% | 46% | 14% |
| Total | 33 | 40% | 16% | 43% | 16% |
| Miscellaneous Statistics for the Samples |
| COTININE |
| Characteristic | N | % | % Basis |
|---|---|---|---|
| Plotted | 33 | 97% | Spiked |
| Estimated Values | 33 | 97% | Spiked |
| Deleted Values | 5 | 7% | Spiked + Not Spiked |
| Spiked, Censored | 0 | 0% | Spiked |
| Spiked | 34 | . | |
| False Negatives | 1 | 3% | 1 out of 34 |
| Not Spiked | 40 | . | |
| False Positives | 1 | 3% | 1 out of 35 |
| BQS ORGANIC BLIND SAMPLES |
| N,N-DIETHYL-META-TOLUAMIDE (DEET), |
| Schedule: 4433 Testid: 61947GCM99 |
| Measured in MICROGRAMS PER LITER |
| 12/02/09 TO 12/20/12 |
| Open Data Set |
| Statistics for the Plotted Points |
| N,N-DIETHYL-META-TOLUAMIDE (DEET) |
| Spike Level | N | Mean | Std-Dev. | Median | F_Pseudo |
|---|---|---|---|---|---|
| >= Reporting Level | 36 | 83% | 16% | 83% | 19% |
| Total | 36 | 83% | 16% | 83% | 19% |
| Miscellaneous Statistics for the Samples |
| N,N-DIETHYL-META-TOLUAMIDE (DEET) |
| Characteristic | N | % | % Basis |
|---|---|---|---|
| Plotted | 36 | 100% | Spiked |
| Estimated Values | 6 | 17% | Spiked |
| Deleted Values | 0 | 0% | Spiked + Not Spiked |
| Spiked, Censored | 0 | 0% | Spiked |
| Spiked | 36 | . | |
| False Negatives | 0 | 0% | 0 out of 36 |
| Not Spiked | 38 | . | |
| False Positives | 2 | 5% | 2 out of 38 |
| BQS ORGANIC BLIND SAMPLES |
| BETA-STIGMASTANOL, |
| Schedule: 4433 Testid: 61948GCM99 |
| Measured in MICROGRAMS PER LITER |
| 12/04/09 TO 12/19/12 |
| Open Data Set |
| Statistics for the Plotted Points |
| BETA-STIGMASTANOL |
| Spike Level | N | Mean | Std-Dev. | Median | F_Pseudo |
|---|---|---|---|---|---|
| < Reporting Level | 6 | 35% | 14% | 38% | 17% |
| >= Reporting Level | 28 | 52% | 20% | 54% | 19% |
| Total | 34 | 49% | 20% | 50% | 19% |
| Miscellaneous Statistics for the Samples |
| BETA-STIGMASTANOL |
| Characteristic | N | % | % Basis |
|---|---|---|---|
| Plotted | 34 | 100% | Spiked |
| Estimated Values | 34 | 100% | Spiked |
| Deleted Values | 3 | 4% | Spiked + Not Spiked |
| Spiked, Censored | 0 | 0% | Spiked |
| Spiked | 35 | . | |
| False Negatives | 0 | 0% | 0 out of 34 |
| Not Spiked | 39 | . | |
| False Positives | 0 | 0% | 0 out of 37 |
| Miscellaneous Statistics for the Samples |
| 4-TERT-OCTYLPHENOL MONOETHOXYLATES, TOTAL (OPEO1) |
| Characteristic | N | % | % Basis |
|---|---|---|---|
| Plotted | 0 | . | Spiked |
| Estimated Values | 0 | . | Spiked |
| Deleted Values | 0 | 0% | Spiked + Not Spiked |
| Spiked, Censored | 0 | . | Spiked |
| Spiked | 0 | . | |
| False Negatives | 0 | . | 0 out of 0 |
| Not Spiked | 74 | . | |
| False Positives | 22 | 30% | 22 out of 74 |
| BQS ORGANIC BLIND SAMPLES |
| 4-TERT-OCTYLPHENOL DIETHOXYLATES, TOTAL (OPEO2), |
| Schedule: 4433 Testid: 62486GCM99 |
| Measured in MICROGRAMS PER LITER |
| 12/04/09 TO 12/18/12 |
| Open Data Set |
| Statistics for the Plotted Points |
| 4-TERT-OCTYLPHENOL DIETHOXYLATES, TOTAL (OPEO2) |
| Spike Level | N | Mean | Std-Dev. | Median | F_Pseudo |
|---|---|---|---|---|---|
| >= Reporting Level | 16 | 29% | 11% | 28% | 10% |
| Total | 16 | 29% | 11% | 28% | 10% |
| Miscellaneous Statistics for the Samples |
| 4-TERT-OCTYLPHENOL DIETHOXYLATES, TOTAL (OPEO2) |
| Characteristic | N | % | % Basis |
|---|---|---|---|
| Plotted | 16 | 94% | Spiked |
| Estimated Values | 16 | 94% | Spiked |
| Deleted Values | 0 | 0% | Spiked + Not Spiked |
| Spiked, Censored | 0 | 0% | Spiked |
| Spiked | 17 | . | |
| False Negatives | 1 | 6% | 1 out of 17 |
| Not Spiked | 57 | . | |
| False Positives | 4 | 7% | 4 out of 57 |
| BQS ORGANIC BLIND SAMPLES |
| 2,6-DIMETHYLNAPHTHALENE, |
| Schedule: 4433 Testid: 62805GCM99 |
| Measured in MICROGRAMS PER LITER |
| 12/04/09 TO 12/20/12 |
| Open Data Set |
| Statistics for the Plotted Points |
| 2,6-DIMETHYLNAPHTHALENE |
| Spike Level | N | Mean | Std-Dev. | Median | F_Pseudo |
|---|---|---|---|---|---|
| < Reporting Level | 3 | 71% | 4% | 72% | 6% |
| >= Reporting Level | 35 | 82% | 13% | 83% | 10% |
| Total | 38 | 81% | 12% | 82% | 10% |
| Miscellaneous Statistics for the Samples |
| 2,6-DIMETHYLNAPHTHALENE |
| Characteristic | N | % | % Basis |
|---|---|---|---|
| Plotted | 38 | 100% | Spiked |
| Estimated Values | 10 | 26% | Spiked |
| Deleted Values | 0 | 0% | Spiked + Not Spiked |
| Spiked, Censored | 0 | 0% | Spiked |
| Spiked | 38 | . | |
| False Negatives | 0 | 0% | 0 out of 38 |
| Not Spiked | 36 | . | |
| False Positives | 0 | 0% | 0 out of 36 |
| BQS ORGANIC BLIND SAMPLES |
| 3-BETA-COPROSTANOL, |
| Schedule: 4433 Testid: 62806GCM99 |
| Measured in MICROGRAMS PER LITER |
| 12/04/09 TO 12/19/12 |
| Open Data Set |

| Statistics for the Plotted Points |
| 3-BETA-COPROSTANOL |
| Spike Level | N | Mean | Std-Dev. | Median | F_Pseudo |
|---|---|---|---|---|---|
| >= Reporting Level | 34 | 52% | 18% | 52% | 16% |
| Total | 34 | 52% | 18% | 52% | 16% |
| Miscellaneous Statistics for the Samples |
| 3-BETA-COPROSTANOL |
| Characteristic | N | % | % Basis |
|---|---|---|---|
| Plotted | 34 | 97% | Spiked |
| Estimated Values | 34 | 97% | Spiked |
| Deleted Values | 0 | 0% | Spiked + Not Spiked |
| Spiked, Censored | 0 | 0% | Spiked |
| Spiked | 35 | . | |
| False Negatives | 1 | 3% | 1 out of 35 |
| Not Spiked | 39 | . | |
| False Positives | 0 | 0% | 0 out of 39 |
| BQS ORGANIC BLIND SAMPLES |
| 3-METHYL-1(H)-INDOLE (SKATOLE), |
| Schedule: 4433 Testid: 62807GCM99 |
| Measured in MICROGRAMS PER LITER |
| 12/04/09 TO 12/20/12 |
| Open Data Set |
| Statistics for the Plotted Points |
| 3-METHYL-1(H)-INDOLE (SKATOLE) |
| Spike Level | N | Mean | Std-Dev. | Median | F_Pseudo |
|---|---|---|---|---|---|
| >= Reporting Level | 38 | 78% | 18% | 81% | 14% |
| Total | 38 | 78% | 18% | 81% | 14% |
| Miscellaneous Statistics for the Samples |
| 3-METHYL-1(H)-INDOLE (SKATOLE) |
| Characteristic | N | % | % Basis |
|---|---|---|---|
| Plotted | 38 | 100% | Spiked |
| Estimated Values | 6 | 16% | Spiked |
| Deleted Values | 0 | 0% | Spiked + Not Spiked |
| Spiked, Censored | 0 | 0% | Spiked |
| Spiked | 38 | . | |
| False Negatives | 0 | 0% | 0 out of 38 |
| Not Spiked | 36 | . | |
| False Positives | 0 | 0% | 0 out of 36 |
| BQS ORGANIC BLIND SAMPLES |
| 4-CUMYLPHENOL, |
| Schedule: 4433 Testid: 62808GCM99 |
| Measured in MICROGRAMS PER LITER |
| 12/04/09 TO 12/20/12 |
| Open Data Set |
| Statistics for the Plotted Points |
| 4-CUMYLPHENOL |
| Spike Level | N | Mean | Std-Dev. | Median | F_Pseudo |
|---|---|---|---|---|---|
| >= Reporting Level | 38 | 80% | 19% | 81% | 17% |
| Total | 38 | 80% | 19% | 81% | 17% |
| Miscellaneous Statistics for the Samples |
| 4-CUMYLPHENOL |
| Characteristic | N | % | % Basis |
|---|---|---|---|
| Plotted | 38 | 100% | Spiked |
| Estimated Values | 8 | 21% | Spiked |
| Deleted Values | 0 | 0% | Spiked + Not Spiked |
| Spiked, Censored | 0 | 0% | Spiked |
| Spiked | 38 | . | |
| False Negatives | 0 | 0% | 0 out of 38 |
| Not Spiked | 36 | . | |
| False Positives | 0 | 0% | 0 out of 36 |
| BQS ORGANIC BLIND SAMPLES |
| 4-N-OCTYLPHENOL, |
| Schedule: 4433 Testid: 62809GCM99 |
| Measured in MICROGRAMS PER LITER |
| 12/04/09 TO 12/20/12 |
| Open Data Set |
| Statistics for the Plotted Points |
| 4-N-OCTYLPHENOL |
| Spike Level | N | Mean | Std-Dev. | Median | F_Pseudo |
|---|---|---|---|---|---|
| < Reporting Level | 2 | 76% | 10% | 76% | 11% |
| >= Reporting Level | 36 | 64% | 17% | 64% | 9% |
| Total | 38 | 64% | 17% | 64% | 9% |
| Miscellaneous Statistics for the Samples |
| 4-N-OCTYLPHENOL |
| Characteristic | N | % | % Basis |
|---|---|---|---|
| Plotted | 38 | 100% | Spiked |
| Estimated Values | 38 | 100% | Spiked |
| Deleted Values | 0 | 0% | Spiked + Not Spiked |
| Spiked, Censored | 0 | 0% | Spiked |
| Spiked | 38 | . | |
| False Negatives | 0 | 0% | 0 out of 38 |
| Not Spiked | 36 | . | |
| False Positives | 1 | 3% | 1 out of 36 |
| BQS ORGANIC BLIND SAMPLES |
| 4-TERT-OCTYLPHENOL, |
| Schedule: 4433 Testid: 62810GCM99 |
| Measured in MICROGRAMS PER LITER |
| 12/04/09 TO 12/19/12 |
| Open Data Set |
| Statistics for the Plotted Points |
| 4-TERT-OCTYLPHENOL |
| Spike Level | N | Mean | Std-Dev. | Median | F_Pseudo |
|---|---|---|---|---|---|
| < Reporting Level | 4 | 99% | 21% | 96% | 26% |
| >= Reporting Level | 31 | 81% | 11% | 83% | 11% |
| Total | 35 | 83% | 14% | 84% | 14% |
| Miscellaneous Statistics for the Samples |
| 4-TERT-OCTYLPHENOL |
| Characteristic | N | % | % Basis |
|---|---|---|---|
| Plotted | 35 | 100% | Spiked |
| Estimated Values | 35 | 100% | Spiked |
| Deleted Values | 0 | 0% | Spiked + Not Spiked |
| Spiked, Censored | 0 | 0% | Spiked |
| Spiked | 35 | . | |
| False Negatives | 0 | 0% | 0 out of 35 |
| Not Spiked | 39 | . | |
| False Positives | 0 | 0% | 0 out of 39 |
| BQS ORGANIC BLIND SAMPLES |
| ACETOPHENONE, |
| Schedule: 4433 Testid: 62811GCM99 |
| Measured in MICROGRAMS PER LITER |
| 12/04/09 TO 12/19/12 |
| Open Data Set |
| Statistics for the Plotted Points |
| ACETOPHENONE |
| Spike Level | N | Mean | Std-Dev. | Median | F_Pseudo |
|---|---|---|---|---|---|
| >= Reporting Level | 35 | 91% | 12% | 92% | 12% |
| Total | 35 | 91% | 12% | 92% | 12% |
| Miscellaneous Statistics for the Samples |
| ACETOPHENONE |
| Characteristic | N | % | % Basis |
|---|---|---|---|
| Plotted | 35 | 100% | Spiked |
| Estimated Values | 3 | 9% | Spiked |
| Deleted Values | 0 | 0% | Spiked + Not Spiked |
| Spiked, Censored | 0 | 0% | Spiked |
| Spiked | 35 | . | |
| False Negatives | 0 | 0% | 0 out of 35 |
| Not Spiked | 39 | . | |
| False Positives | 0 | 0% | 0 out of 39 |
| BQS ORGANIC BLIND SAMPLES |
| ACETYL HEXAMETHYL TETRAHYDRONAPHTHALENE (AHTN), |
| Schedule: 4433 Testid: 62812GCM99 |
| Measured in MICROGRAMS PER LITER |
| 12/04/09 TO 12/19/12 |
| Open Data Set |
| Statistics for the Plotted Points |
| ACETYL HEXAMETHYL TETRAHYDRONAPHTHALENE (AHTN) |
| Spike Level | N | Mean | Std-Dev. | Median | F_Pseudo |
|---|---|---|---|---|---|
| >= Reporting Level | 23 | 84% | 15% | 84% | 11% |
| Total | 23 | 84% | 15% | 84% | 11% |
| Miscellaneous Statistics for the Samples |
| ACETYL HEXAMETHYL TETRAHYDRONAPHTHALENE (AHTN) |
| Characteristic | N | % | % Basis |
|---|---|---|---|
| Plotted | 23 | 100% | Spiked |
| Estimated Values | 1 | 4% | Spiked |
| Deleted Values | 0 | 0% | Spiked + Not Spiked |
| Spiked, Censored | 0 | 0% | Spiked |
| Spiked | 23 | . | |
| False Negatives | 0 | 0% | 0 out of 23 |
| Not Spiked | 51 | . | |
| False Positives | 0 | 0% | 0 out of 51 |
| BQS ORGANIC BLIND SAMPLES |
| ANTHRAQUINONE, |
| Schedule: 4433 Testid: 62813GCM99 |
| Measured in MICROGRAMS PER LITER |
| 12/04/09 TO 12/20/12 |
| Open Data Set |
| Statistics for the Plotted Points |
| ANTHRAQUINONE |
| Spike Level | N | Mean | Std-Dev. | Median | F_Pseudo |
|---|---|---|---|---|---|
| >= Reporting Level | 38 | 80% | 16% | 81% | 13% |
| Total | 38 | 80% | 16% | 81% | 13% |
| Miscellaneous Statistics for the Samples |
| ANTHRAQUINONE |
| Characteristic | N | % | % Basis |
|---|---|---|---|
| Plotted | 38 | 100% | Spiked |
| Estimated Values | 38 | 100% | Spiked |
| Deleted Values | 0 | 0% | Spiked + Not Spiked |
| Spiked, Censored | 0 | 0% | Spiked |
| Spiked | 38 | . | |
| False Negatives | 0 | 0% | 0 out of 38 |
| Not Spiked | 36 | . | |
| False Positives | 0 | 0% | 0 out of 36 |
| BQS ORGANIC BLIND SAMPLES |
| BENZOPHENONE, |
| Schedule: 4433 Testid: 62814GCM99 |
| Measured in MICROGRAMS PER LITER |
| 12/04/09 TO 12/20/12 |
| Open Data Set |
| Statistics for the Plotted Points |
| BENZOPHENONE |
| Spike Level | N | Mean | Std-Dev. | Median | F_Pseudo |
|---|---|---|---|---|---|
| < Reporting Level | 3 | 82% | 5% | 85% | 7% |
| >= Reporting Level | 35 | 88% | 13% | 86% | 8% |
| Total | 38 | 87% | 13% | 86% | 7% |
| Miscellaneous Statistics for the Samples |
| BENZOPHENONE |
| Characteristic | N | % | % Basis |
|---|---|---|---|
| Plotted | 38 | 100% | Spiked |
| Estimated Values | 9 | 24% | Spiked |
| Deleted Values | 0 | 0% | Spiked + Not Spiked |
| Spiked, Censored | 0 | 0% | Spiked |
| Spiked | 38 | . | |
| False Negatives | 0 | 0% | 0 out of 38 |
| Not Spiked | 36 | . | |
| False Positives | 1 | 3% | 1 out of 36 |
| BQS ORGANIC BLIND SAMPLES |
| BETA-SITOSTEROL, |
| Schedule: 4433 Testid: 62815GCM99 |
| Measured in MICROGRAMS PER LITER |
| 12/04/09 TO 12/19/12 |
| Open Data Set |
| Statistics for the Plotted Points |
| BETA-SITOSTEROL |
| Spike Level | N | Mean | Std-Dev. | Median | F_Pseudo |
|---|---|---|---|---|---|
| >= Reporting Level | 34 | 54% | 22% | 55% | 22% |
| Total | 34 | 54% | 22% | 55% | 22% |
| Miscellaneous Statistics for the Samples |
| BETA-SITOSTEROL |
| Characteristic | N | % | % Basis |
|---|---|---|---|
| Plotted | 34 | 97% | Spiked |
| Estimated Values | 34 | 97% | Spiked |
| Deleted Values | 1 | 1% | Spiked + Not Spiked |
| Spiked, Censored | 0 | 0% | Spiked |
| Spiked | 35 | . | |
| False Negatives | 1 | 3% | 1 out of 35 |
| Not Spiked | 39 | . | |
| False Positives | 0 | 0% | 0 out of 38 |
| BQS ORGANIC BLIND SAMPLES |
| BISPHENOL A, |
| Schedule: 4433 Testid: 62816GCM99 |
| Measured in MICROGRAMS PER LITER |
| 12/04/09 TO 12/20/12 |
| Open Data Set |
| Statistics for the Plotted Points |
| BISPHENOL A |
| Spike Level | N | Mean | Std-Dev. | Median | F_Pseudo |
|---|---|---|---|---|---|
| < Reporting Level | 2 | 81% | 10% | 81% | 10% |
| >= Reporting Level | 32 | 86% | 22% | 85% | 20% |
| Total | 34 | 85% | 22% | 85% | 20% |
| Miscellaneous Statistics for the Samples |
| BISPHENOL A |
| Characteristic | N | % | % Basis |
|---|---|---|---|
| Plotted | 34 | 100% | Spiked |
| Estimated Values | 8 | 24% | Spiked |
| Deleted Values | 0 | 0% | Spiked + Not Spiked |
| Spiked, Censored | 0 | 0% | Spiked |
| Spiked | 34 | . | |
| False Negatives | 0 | 0% | 0 out of 34 |
| Not Spiked | 40 | . | |
| False Positives | 1 | 3% | 1 out of 40 |
| BQS ORGANIC BLIND SAMPLES |
| CAMPHOR, |
| Schedule: 4433 Testid: 62817GCM99 |
| Measured in MICROGRAMS PER LITER |
| 12/04/09 TO 12/20/12 |
| Open Data Set |
| Statistics for the Plotted Points |
| CAMPHOR |
| Spike Level | N | Mean | Std-Dev. | Median | F_Pseudo |
|---|---|---|---|---|---|
| < Reporting Level | 3 | 75% | 3% | 77% | 4% |
| >= Reporting Level | 35 | 86% | 13% | 86% | 12% |
| Total | 38 | 85% | 12% | 85% | 12% |
| Miscellaneous Statistics for the Samples |
| CAMPHOR |
| Characteristic | N | % | % Basis |
|---|---|---|---|
| Plotted | 38 | 100% | Spiked |
| Estimated Values | 8 | 21% | Spiked |
| Deleted Values | 0 | 0% | Spiked + Not Spiked |
| Spiked, Censored | 0 | 0% | Spiked |
| Spiked | 38 | . | |
| False Negatives | 0 | 0% | 0 out of 38 |
| Not Spiked | 36 | . | |
| False Positives | 0 | 0% | 0 out of 36 |
| BQS ORGANIC BLIND SAMPLES |
| CHOLESTEROL, |
| Schedule: 4433 Testid: 62818GCM99 |
| Measured in MICROGRAMS PER LITER |
| 12/04/09 TO 12/19/12 |
| Open Data Set |
| Statistics for the Plotted Points |
| CHOLESTEROL |
| Spike Level | N | Mean | Std-Dev. | Median | F_Pseudo |
|---|---|---|---|---|---|
| >= Reporting Level | 34 | 53% | 18% | 53% | 18% |
| Total | 34 | 53% | 18% | 53% | 18% |
| Miscellaneous Statistics for the Samples |
| CHOLESTEROL |
| Characteristic | N | % | % Basis |
|---|---|---|---|
| Plotted | 34 | 97% | Spiked |
| Estimated Values | 34 | 97% | Spiked |
| Deleted Values | 0 | 0% | Spiked + Not Spiked |
| Spiked, Censored | 0 | 0% | Spiked |
| Spiked | 35 | . | |
| False Negatives | 1 | 3% | 1 out of 35 |
| Not Spiked | 39 | . | |
| False Positives | 0 | 0% | 0 out of 39 |
| BQS ORGANIC BLIND SAMPLES |
| D-LIMONENE, |
| Schedule: 4433 Testid: 62819GCM99 |
| Measured in MICROGRAMS PER LITER |
| 12/04/09 TO 12/20/12 |
| Open Data Set |
| Statistics for the Plotted Points |
| D-LIMONENE |
| Spike Level | N | Mean | Std-Dev. | Median | F_Pseudo |
|---|---|---|---|---|---|
| >= Reporting Level | 38 | 77% | 10% | 79% | 8% |
| Total | 38 | 77% | 10% | 79% | 8% |
| Miscellaneous Statistics for the Samples |
| D-LIMONENE |
| Characteristic | N | % | % Basis |
|---|---|---|---|
| Plotted | 38 | 100% | Spiked |
| Estimated Values | 38 | 100% | Spiked |
| Deleted Values | 0 | 0% | Spiked + Not Spiked |
| Spiked, Censored | 0 | 0% | Spiked |
| Spiked | 38 | . | |
| False Negatives | 0 | 0% | 0 out of 38 |
| Not Spiked | 36 | . | |
| False Positives | 0 | 0% | 0 out of 36 |
| BQS ORGANIC BLIND SAMPLES |
| HEXAHYDROHEXAMETHYLCYCLOPENTABENZOPYRAN (HHCB), |
| Schedule: 4433 Testid: 62823GCM99 |
| Measured in MICROGRAMS PER LITER |
| 12/04/09 TO 12/19/12 |
| Open Data Set |
| Statistics for the Plotted Points |
| HEXAHYDROHEXAMETHYLCYCLOPENTABENZOPYRAN (HHCB) |
| Spike Level | N | Mean | Std-Dev. | Median | F_Pseudo |
|---|---|---|---|---|---|
| >= Reporting Level | 13 | 84% | 15% | 80% | 19% |
| Total | 13 | 84% | 15% | 80% | 19% |
| Miscellaneous Statistics for the Samples |
| HEXAHYDROHEXAMETHYLCYCLOPENTABENZOPYRAN (HHCB) |
| Characteristic | N | % | % Basis |
|---|---|---|---|
| Plotted | 13 | 100% | Spiked |
| Estimated Values | 2 | 15% | Spiked |
| Deleted Values | 0 | 0% | Spiked + Not Spiked |
| Spiked, Censored | 0 | 0% | Spiked |
| Spiked | 13 | . | |
| False Negatives | 0 | 0% | 0 out of 13 |
| Not Spiked | 61 | . | |
| False Positives | 2 | 3% | 2 out of 61 |
| BQS ORGANIC BLIND SAMPLES |
| INDOLE, |
| Schedule: 4433 Testid: 62824GCM99 |
| Measured in MICROGRAMS PER LITER |
| 12/04/09 TO 12/20/12 |
| Open Data Set |
| Statistics for the Plotted Points |
| INDOLE |
| Spike Level | N | Mean | Std-Dev. | Median | F_Pseudo |
|---|---|---|---|---|---|
| < Reporting Level | 4 | 78% | 4% | 80% | 3% |
| >= Reporting Level | 34 | 75% | 23% | 85% | 18% |
| Total | 38 | 75% | 21% | 80% | 14% |
| Miscellaneous Statistics for the Samples |
| INDOLE |
| Characteristic | N | % | % Basis |
|---|---|---|---|
| Plotted | 38 | 100% | Spiked |
| Estimated Values | 11 | 29% | Spiked |
| Deleted Values | 0 | 0% | Spiked + Not Spiked |
| Spiked, Censored | 0 | 0% | Spiked |
| Spiked | 38 | . | |
| False Negatives | 0 | 0% | 0 out of 38 |
| Not Spiked | 36 | . | |
| False Positives | 0 | 0% | 0 out of 36 |
| BQS ORGANIC BLIND SAMPLES |
| ISOBORNEOL, |
| Schedule: 4433 Testid: 62825GCM99 |
| Measured in MICROGRAMS PER LITER |
| 12/04/09 TO 12/20/12 |
| Open Data Set |
| Statistics for the Plotted Points |
| ISOBORNEOL |
| Spike Level | N | Mean | Std-Dev. | Median | F_Pseudo |
|---|---|---|---|---|---|
| < Reporting Level | 2 | 74% | 5% | 74% | 6% |
| >= Reporting Level | 33 | 85% | 20% | 82% | 16% |
| Total | 35 | 84% | 19% | 82% | 19% |
| Miscellaneous Statistics for the Samples |
| ISOBORNEOL |
| Characteristic | N | % | % Basis |
|---|---|---|---|
| Plotted | 35 | 97% | Spiked |
| Estimated Values | 8 | 22% | Spiked |
| Deleted Values | 0 | 0% | Spiked + Not Spiked |
| Spiked, Censored | 1 | 3% | Spiked |
| Spiked | 36 | . | |
| False Negatives | 0 | 0% | 0 out of 36 |
| Not Spiked | 38 | . | |
| False Positives | 0 | 0% | 0 out of 38 |
| BQS ORGANIC BLIND SAMPLES |
| ISOQUINOLINE, |
| Schedule: 4433 Testid: 62826GCM99 |
| Measured in MICROGRAMS PER LITER |
| 12/04/09 TO 12/20/12 |
| Open Data Set |
| Statistics for the Plotted Points |
| ISOQUINOLINE |
| Spike Level | N | Mean | Std-Dev. | Median | F_Pseudo |
|---|---|---|---|---|---|
| >= Reporting Level | 34 | 74% | 20% | 76% | 17% |
| Total | 34 | 74% | 20% | 76% | 17% |
| Miscellaneous Statistics for the Samples |
| ISOQUINOLINE |
| Characteristic | N | % | % Basis |
|---|---|---|---|
| Plotted | 34 | 100% | Spiked |
| Estimated Values | 5 | 15% | Spiked |
| Deleted Values | 0 | 0% | Spiked + Not Spiked |
| Spiked, Censored | 0 | 0% | Spiked |
| Spiked | 34 | . | |
| False Negatives | 0 | 0% | 0 out of 34 |
| Not Spiked | 40 | . | |
| False Positives | 1 | 3% | 1 out of 40 |
| BQS ORGANIC BLIND SAMPLES |
| MENTHOL, |
| Schedule: 4433 Testid: 62827GCM99 |
| Measured in MICROGRAMS PER LITER |
| 12/04/09 TO 12/19/12 |
| Open Data Set |
| Statistics for the Plotted Points |
| MENTHOL |
| Spike Level | N | Mean | Std-Dev. | Median | F_Pseudo |
|---|---|---|---|---|---|
| < Reporting Level | 9 | 104% | 43% | 100% | 21% |
| >= Reporting Level | 28 | 92% | 18% | 90% | 15% |
| Total | 37 | 95% | 26% | 92% | 16% |
| Miscellaneous Statistics for the Samples |
| MENTHOL |
| Characteristic | N | % | % Basis |
|---|---|---|---|
| Plotted | 37 | 100% | Spiked |
| Estimated Values | 6 | 16% | Spiked |
| Deleted Values | 0 | 0% | Spiked + Not Spiked |
| Spiked, Censored | 0 | 0% | Spiked |
| Spiked | 37 | . | |
| False Negatives | 0 | 0% | 0 out of 37 |
| Not Spiked | 37 | . | |
| False Positives | 0 | 0% | 0 out of 37 |
| BQS ORGANIC BLIND SAMPLES |
| METHYL SALICYLATE, |
| Schedule: 4433 Testid: 62828GCM99 |
| Measured in MICROGRAMS PER LITER |
| 12/04/09 TO 12/20/12 |
| Open Data Set |
| Statistics for the Plotted Points |
| METHYL SALICYLATE |
| Spike Level | N | Mean | Std-Dev. | Median | F_Pseudo |
|---|---|---|---|---|---|
| >= Reporting Level | 36 | 81% | 14% | 83% | 15% |
| Total | 36 | 81% | 14% | 83% | 15% |
| Miscellaneous Statistics for the Samples |
| METHYL SALICYLATE |
| Characteristic | N | % | % Basis |
|---|---|---|---|
| Plotted | 36 | 100% | Spiked |
| Estimated Values | 2 | 6% | Spiked |
| Deleted Values | 0 | 0% | Spiked + Not Spiked |
| Spiked, Censored | 0 | 0% | Spiked |
| Spiked | 36 | . | |
| False Negatives | 0 | 0% | 0 out of 36 |
| Not Spiked | 38 | . | |
| False Positives | 0 | 0% | 0 out of 38 |
| BQS ORGANIC BLIND SAMPLES |
| PARA-NONYLPHENOL (TOTAL) (BRANCHED), |
| Schedule: 4433 Testid: 62829GCM99 |
| Measured in MICROGRAMS PER LITER |
| 12/04/09 TO 12/19/12 |
| Open Data Set |
| Statistics for the Plotted Points |
| PARA-NONYLPHENOL (TOTAL) (BRANCHED) |
| Spike Level | N | Mean | Std-Dev. | Median | F_Pseudo |
|---|---|---|---|---|---|
| >= Reporting Level | 27 | 72% | 12% | 70% | 10% |
| Total | 27 | 72% | 12% | 70% | 10% |
| Miscellaneous Statistics for the Samples |
| PARA-NONYLPHENOL (TOTAL) (BRANCHED) |
| Characteristic | N | % | % Basis |
|---|---|---|---|
| Plotted | 27 | 100% | Spiked |
| Estimated Values | 27 | 100% | Spiked |
| Deleted Values | 0 | 0% | Spiked + Not Spiked |
| Spiked, Censored | 0 | 0% | Spiked |
| Spiked | 27 | . | |
| False Negatives | 0 | 0% | 0 out of 27 |
| Not Spiked | 47 | . | |
| False Positives | 0 | 0% | 0 out of 47 |
| BQS ORGANIC BLIND SAMPLES |
| TRIS(2-BUTOXYETHYL)PHOSPHATE, |
| Schedule: 4433 Testid: 62830GCM99 |
| Measured in MICROGRAMS PER LITER |
| 12/04/09 TO 12/19/12 |
| Open Data Set |
| Statistics for the Plotted Points |
| TRIS(2-BUTOXYETHYL)PHOSPHATE |
| Spike Level | N | Mean | Std-Dev. | Median | F_Pseudo |
|---|---|---|---|---|---|
| < Reporting Level | 8 | 117% | 40% | 108% | 32% |
| >= Reporting Level | 28 | 97% | 30% | 102% | 21% |
| Total | 36 | 101% | 33% | 102% | 20% |
| Miscellaneous Statistics for the Samples |
| TRIS(2-BUTOXYETHYL)PHOSPHATE |
| Characteristic | N | % | % Basis |
|---|---|---|---|
| Plotted | 36 | 97% | Spiked |
| Estimated Values | 36 | 97% | Spiked |
| Deleted Values | 0 | 0% | Spiked + Not Spiked |
| Spiked, Censored | 1 | 3% | Spiked |
| Spiked | 37 | . | |
| False Negatives | 0 | 0% | 0 out of 37 |
| Not Spiked | 37 | . | |
| False Positives | 0 | 0% | 0 out of 37 |
| BQS ORGANIC BLIND SAMPLES |
| TRIS(2-CHLOROETHYL)PHOSPHATE, |
| Schedule: 4433 Testid: 62831GCM99 |
| Measured in MICROGRAMS PER LITER |
| 12/04/09 TO 12/20/12 |
| Open Data Set |

| Statistics for the Plotted Points |
| TRIS(2-CHLOROETHYL)PHOSPHATE |
| Spike Level | N | Mean | Std-Dev. | Median | F_Pseudo |
|---|---|---|---|---|---|
| < Reporting Level | 3 | 84% | 22% | 72% | 29% |
| >= Reporting Level | 33 | 84% | 20% | 86% | 12% |
| Total | 36 | 84% | 20% | 85% | 15% |
| Miscellaneous Statistics for the Samples |
| TRIS(2-CHLOROETHYL)PHOSPHATE |
| Characteristic | N | % | % Basis |
|---|---|---|---|
| Plotted | 36 | 100% | Spiked |
| Estimated Values | 5 | 14% | Spiked |
| Deleted Values | 0 | 0% | Spiked + Not Spiked |
| Spiked, Censored | 0 | 0% | Spiked |
| Spiked | 36 | . | |
| False Negatives | 0 | 0% | 0 out of 36 |
| Not Spiked | 38 | . | |
| False Positives | 1 | 3% | 1 out of 38 |
| BQS ORGANIC BLIND SAMPLES |
| TRIBUTYL PHOSPHATE, |
| Schedule: 4433 Testid: 62832GCM99 |
| Measured in MICROGRAMS PER LITER |
| 12/04/09 TO 12/20/12 |
| Open Data Set |
| Statistics for the Plotted Points |
| TRIBUTYL PHOSPHATE |
| Spike Level | N | Mean | Std-Dev. | Median | F_Pseudo |
|---|---|---|---|---|---|
| >= Reporting Level | 36 | 81% | 23% | 82% | 18% |
| Total | 36 | 81% | 23% | 82% | 18% |
| Miscellaneous Statistics for the Samples |
| TRIBUTYL PHOSPHATE |
| Characteristic | N | % | % Basis |
|---|---|---|---|
| Plotted | 36 | 100% | Spiked |
| Estimated Values | 11 | 31% | Spiked |
| Deleted Values | 0 | 0% | Spiked + Not Spiked |
| Spiked, Censored | 0 | 0% | Spiked |
| Spiked | 36 | . | |
| False Negatives | 0 | 0% | 0 out of 36 |
| Not Spiked | 38 | . | |
| False Positives | 1 | 3% | 1 out of 38 |
| BQS ORGANIC BLIND SAMPLES |
| TRIETHYL CITRATE (ETHYL CITRATE), |
| Schedule: 4433 Testid: 62833GCM99 |
| Measured in MICROGRAMS PER LITER |
| 12/04/09 TO 12/20/12 |
| Open Data Set |
| Statistics for the Plotted Points |
| TRIETHYL CITRATE (ETHYL CITRATE) |
| Spike Level | N | Mean | Std-Dev. | Median | F_Pseudo |
|---|---|---|---|---|---|
| >= Reporting Level | 35 | 74% | 29% | 77% | 26% |
| Total | 35 | 74% | 29% | 77% | 26% |
| Miscellaneous Statistics for the Samples |
| TRIETHYL CITRATE (ETHYL CITRATE) |
| Characteristic | N | % | % Basis |
|---|---|---|---|
| Plotted | 35 | 97% | Spiked |
| Estimated Values | 8 | 22% | Spiked |
| Deleted Values | 0 | 0% | Spiked + Not Spiked |
| Spiked, Censored | 0 | 0% | Spiked |
| Spiked | 36 | . | |
| False Negatives | 1 | 3% | 1 out of 36 |
| Not Spiked | 38 | . | |
| False Positives | 2 | 5% | 2 out of 38 |
| BQS ORGANIC BLIND SAMPLES |
| TRIPHENYL PHOSPHATE, |
| Schedule: 4433 Testid: 62834GCM99 |
| Measured in MICROGRAMS PER LITER |
| 12/04/09 TO 12/20/12 |
| Open Data Set |
| Statistics for the Plotted Points |
| TRIPHENYL PHOSPHATE |
| Spike Level | N | Mean | Std-Dev. | Median | F_Pseudo |
|---|---|---|---|---|---|
| < Reporting Level | 3 | 79% | 16% | 70% | 20% |
| >= Reporting Level | 33 | 87% | 18% | 90% | 13% |
| Total | 36 | 87% | 18% | 90% | 13% |
| Miscellaneous Statistics for the Samples |
| TRIPHENYL PHOSPHATE |
| Characteristic | N | % | % Basis |
|---|---|---|---|
| Plotted | 36 | 100% | Spiked |
| Estimated Values | 10 | 28% | Spiked |
| Deleted Values | 0 | 0% | Spiked + Not Spiked |
| Spiked, Censored | 0 | 0% | Spiked |
| Spiked | 36 | . | |
| False Negatives | 0 | 0% | 0 out of 36 |
| Not Spiked | 38 | . | |
| False Positives | 3 | 8% | 3 out of 38 |
| BQS ORGANIC BLIND SAMPLES |
| 3,4-DICHLOROPHENYL ISOCYANATE, |
| Schedule: 4433 Testid: 63145GCM99 |
| Measured in MICROGRAMS PER LITER |
| 12/04/09 TO 12/19/12 |
| Open Data Set |
| Statistics for the Plotted Points |
| 3,4-DICHLOROPHENYL ISOCYANATE |
| Spike Level | N | Mean | Std-Dev. | Median | F_Pseudo |
|---|---|---|---|---|---|
| < Reporting Level | 2 | 17% | 8% | 17% | 9% |
| >= Reporting Level | 29 | 19% | 13% | 15% | 10% |
| Total | 31 | 19% | 12% | 15% | 10% |
| Miscellaneous Statistics for the Samples |
| 3,4-DICHLOROPHENYL ISOCYANATE |
| Characteristic | N | % | % Basis |
|---|---|---|---|
| Plotted | 31 | 97% | Spiked |
| Estimated Values | 31 | 97% | Spiked |
| Deleted Values | 0 | 0% | Spiked + Not Spiked |
| Spiked, Censored | 1 | 3% | Spiked |
| Spiked | 32 | . | |
| False Negatives | 0 | 0% | 0 out of 32 |
| Not Spiked | 42 | . | |
| False Positives | 1 | 2% | 1 out of 42 |
| BQS ORGANIC BLIND SAMPLES |
| 2,2',4,4'-TETRABROMODIPHENYLETHER (PBDE 47), |
| Schedule: 4433 Testid: 63147GCM99 |
| Measured in MICROGRAMS PER LITER |
| 12/18/09 TO 12/20/12 |
| Open Data Set |
| Statistics for the Plotted Points |
| 2,2',4,4'-TETRABROMODIPHENYLETHER (PBDE 47) |
| Spike Level | N | Mean | Std-Dev. | Median | F_Pseudo |
|---|---|---|---|---|---|
| < Reporting Level | 4 | 60% | 7% | 60% | 9% |
| >= Reporting Level | 8 | 84% | 29% | 77% | 32% |
| Total | 12 | 76% | 26% | 72% | 28% |
| Miscellaneous Statistics for the Samples |
| 2,2',4,4'-TETRABROMODIPHENYLETHER (PBDE 47) |
| Characteristic | N | % | % Basis |
|---|---|---|---|
| Plotted | 12 | 100% | Spiked |
| Estimated Values | 12 | 100% | Spiked |
| Deleted Values | 0 | 0% | Spiked + Not Spiked |
| Spiked, Censored | 0 | 0% | Spiked |
| Spiked | 12 | . | |
| False Negatives | 0 | 0% | 0 out of 12 |
| Not Spiked | 62 | . | |
| False Positives | 0 | 0% | 0 out of 62 |
| BQS ORGANIC BLIND SAMPLES |
| P-CRESOL, |
| Schedule: 4433 Testid: 77146GCM99 |
| Measured in MICROGRAMS PER LITER |
| 12/04/09 TO 12/20/12 |
| Open Data Set |
| Statistics for the Plotted Points |
| P-CRESOL |
| Spike Level | N | Mean | Std-Dev. | Median | F_Pseudo |
|---|---|---|---|---|---|
| >= Reporting Level | 36 | 80% | 17% | 84% | 18% |
| Total | 36 | 80% | 17% | 84% | 18% |
| Miscellaneous Statistics for the Samples |
| P-CRESOL |
| Characteristic | N | % | % Basis |
|---|---|---|---|
| Plotted | 36 | 100% | Spiked |
| Estimated Values | 4 | 11% | Spiked |
| Deleted Values | 0 | 0% | Spiked + Not Spiked |
| Spiked, Censored | 0 | 0% | Spiked |
| Spiked | 36 | . | |
| False Negatives | 0 | 0% | 0 out of 36 |
| Not Spiked | 38 | . | |
| False Positives | 0 | 0% | 0 out of 38 |
| BQS ORGANIC BLIND SAMPLES |
| ISOPROPYLBENZENE, |
| Schedule: 4433 Testid: 77223GCM99 |
| Measured in MICROGRAMS PER LITER |
| 12/04/09 TO 12/20/12 |
| Open Data Set |
| Statistics for the Plotted Points |
| ISOPROPYLBENZENE |
| Spike Level | N | Mean | Std-Dev. | Median | F_Pseudo |
|---|---|---|---|---|---|
| >= Reporting Level | 36 | 82% | 10% | 82% | 10% |
| Total | 36 | 82% | 10% | 82% | 10% |
| Miscellaneous Statistics for the Samples |
| ISOPROPYLBENZENE |
| Characteristic | N | % | % Basis |
|---|---|---|---|
| Plotted | 36 | 100% | Spiked |
| Estimated Values | 36 | 100% | Spiked |
| Deleted Values | 0 | 0% | Spiked + Not Spiked |
| Spiked, Censored | 0 | 0% | Spiked |
| Spiked | 36 | . | |
| False Negatives | 0 | 0% | 0 out of 36 |
| Not Spiked | 38 | . | |
| False Positives | 0 | 0% | 0 out of 38 |
| BQS ORGANIC BLIND SAMPLES |
| CARBAZOLE, |
| Schedule: 4433 Testid: 77571GCM99 |
| Measured in MICROGRAMS PER LITER |
| 12/04/09 TO 12/20/12 |
| Open Data Set |
| Statistics for the Plotted Points |
| CARBAZOLE |
| Spike Level | N | Mean | Std-Dev. | Median | F_Pseudo |
|---|---|---|---|---|---|
| < Reporting Level | 2 | 81% | 9% | 81% | 9% |
| >= Reporting Level | 34 | 81% | 17% | 82% | 16% |
| Total | 36 | 81% | 16% | 82% | 14% |
| Miscellaneous Statistics for the Samples |
| CARBAZOLE |
| Characteristic | N | % | % Basis |
|---|---|---|---|
| Plotted | 36 | 100% | Spiked |
| Estimated Values | 4 | 11% | Spiked |
| Deleted Values | 0 | 0% | Spiked + Not Spiked |
| Spiked, Censored | 0 | 0% | Spiked |
| Spiked | 36 | . | |
| False Negatives | 0 | 0% | 0 out of 36 |
| Not Spiked | 37 | . | |
| False Positives | 2 | 5% | 2 out of 37 |
| BQS ORGANIC BLIND SAMPLES |
| CAFFEINE, |
| Schedule: 4433 Testid: 81436GCM99 |
| Measured in MICROGRAMS PER LITER |
| 12/04/09 TO 12/20/12 |
| Open Data Set |
| Statistics for the Plotted Points |
| CAFFEINE |
| Spike Level | N | Mean | Std-Dev. | Median | F_Pseudo |
|---|---|---|---|---|---|
| >= Reporting Level | 36 | 78% | 14% | 80% | 15% |
| Total | 36 | 78% | 14% | 80% | 15% |
| Miscellaneous Statistics for the Samples |
| CAFFEINE |
| Characteristic | N | % | % Basis |
|---|---|---|---|
| Plotted | 36 | 100% | Spiked |
| Estimated Values | 1 | 3% | Spiked |
| Deleted Values | 0 | 0% | Spiked + Not Spiked |
| Spiked, Censored | 0 | 0% | Spiked |
| Spiked | 36 | . | |
| False Negatives | 0 | 0% | 0 out of 36 |
| Not Spiked | 38 | . | |
| False Positives | 1 | 3% | 1 out of 38 |
| BQS ORGANIC BLIND SAMPLES |
| 1-METHYLNAPHTHALENE, |
| Schedule: 4433 Testid: 81696GCM99 |
| Measured in MICROGRAMS PER LITER |
| 12/04/09 TO 12/20/12 |
| Open Data Set |
| Statistics for the Plotted Points |
| 1-METHYLNAPHTHALENE |
| Spike Level | N | Mean | Std-Dev. | Median | F_Pseudo |
|---|---|---|---|---|---|
| < Reporting Level | 3 | 73% | 6% | 74% | 8% |
| >= Reporting Level | 33 | 86% | 14% | 89% | 16% |
| Total | 36 | 85% | 14% | 85% | 16% |
| Miscellaneous Statistics for the Samples |
| 1-METHYLNAPHTHALENE |
| Characteristic | N | % | % Basis |
|---|---|---|---|
| Plotted | 36 | 100% | Spiked |
| Estimated Values | 8 | 22% | Spiked |
| Deleted Values | 0 | 0% | Spiked + Not Spiked |
| Spiked, Censored | 0 | 0% | Spiked |
| Spiked | 36 | . | |
| False Negatives | 0 | 0% | 0 out of 36 |
| Not Spiked | 38 | . | |
| False Positives | 5 | 13% | 5 out of 38 |
| BQS ORGANIC BLIND SAMPLES |
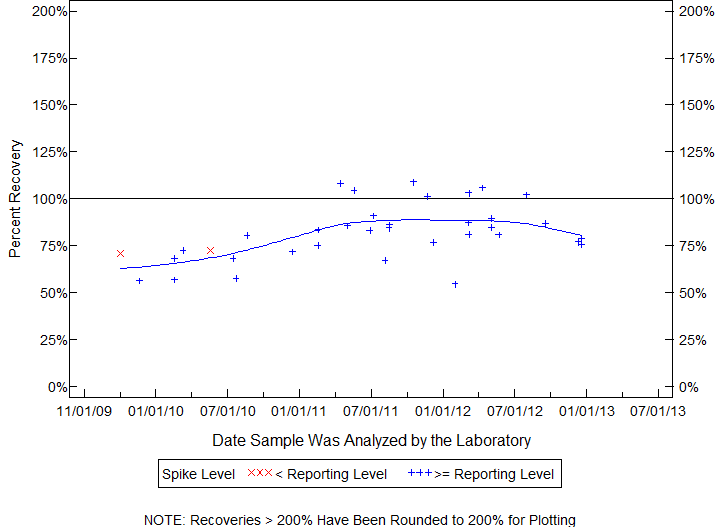
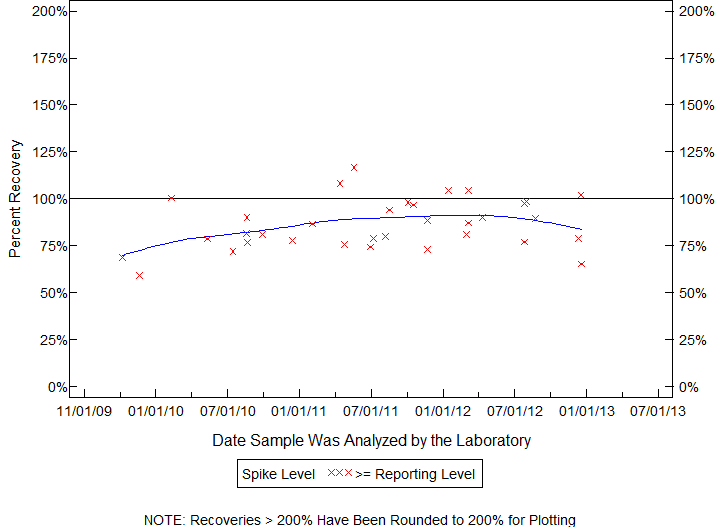
| METOLACHLOR, |
| Schedule: 4433 Testid: 82612GCM99 |
| Measured in MICROGRAMS PER LITER |
| 12/04/09 TO 12/20/12 |
| Open Data Set |