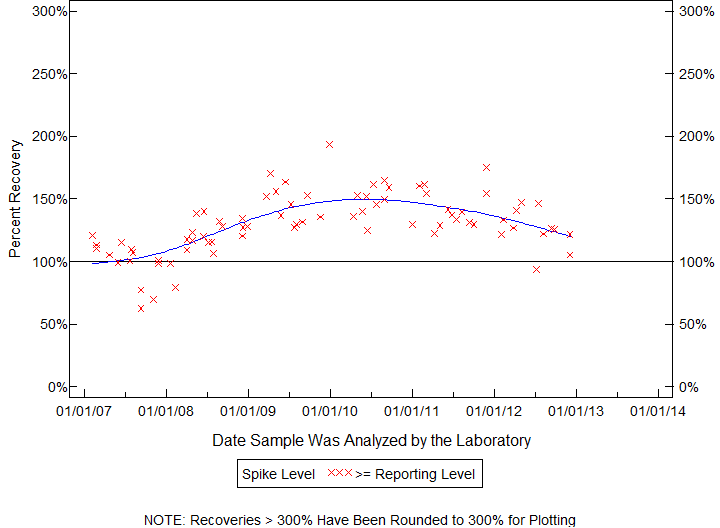
| BQS ORGANIC BLIND SAMPLES |
| BROMACIL |
| Permanently Estimated Compound |
| Schedule: 2060 Testid: 04029LCM29 |
| 02/09/07 TO 12/05/12 |
| Open Data Set |
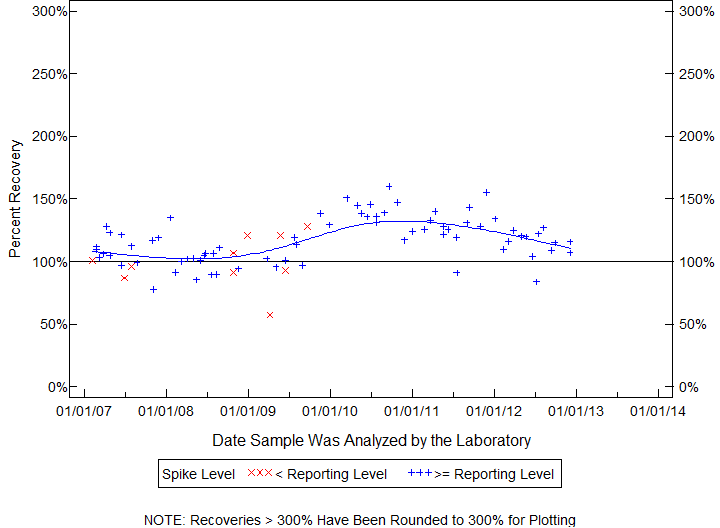
| BQS ORGANIC BLIND SAMPLES |
| BROMACIL |
| Permanently Estimated Compound |
| Schedule: 2060 Testid: 04029LCM29 |
| 02/09/07 TO 12/05/12 |
| Open Data Set |

| Statistics for the Plotted Points |
| BROMACIL |
| Spike Level | N | Mean | Std-Dev. | Median | F_Pseudo |
|---|---|---|---|---|---|
| < Reporting Level | 10 | 100% | 21% | 99% | 22% |
| >= Reporting Level | 75 | 117% | 18% | 117% | 20% |
| Total | 85 | 115% | 19% | 116% | 19% |
| Miscellaneous Statistics for the Samples |
| BROMACIL |
| Characteristic | N | % | % Basis |
|---|---|---|---|
| Plotted | 85 | 100% | Spiked |
| Estimated Values | 11 | 13% | Spiked |
| Deleted Values | 0 | 0% | Spiked + Not Spiked |
| Spiked, Censored | 0 | 0% | Spiked |
| Spiked | 85 | . | |
| False Negatives | 0 | 0% | 0 out of 85 |
| Not Spiked | 111 | . | |
| False Positives | 0 | 0% | 0 out of 111 |
| BQS ORGANIC BLIND SAMPLES |
| CYCLOATE |
| Permanently Estimated Compound |
| Schedule: 2060 Testid: 04031LCM29 |
| 02/09/07 TO 12/21/12 |
| Open Data Set |
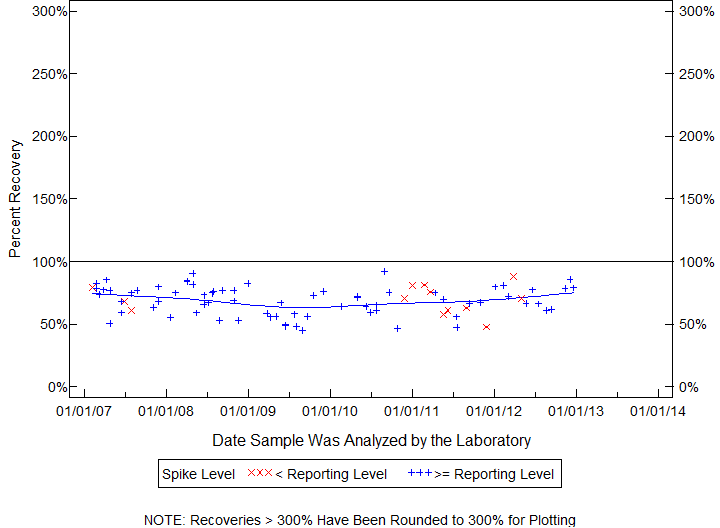
| Statistics for the Plotted Points |
| CYCLOATE |
| Spike Level | N | Mean | Std-Dev. | Median | F_Pseudo |
|---|---|---|---|---|---|
| < Reporting Level | 13 | 70% | 11% | 71% | 14% |
| >= Reporting Level | 71 | 69% | 12% | 69% | 13% |
| Total | 84 | 69% | 11% | 69% | 13% |
| Miscellaneous Statistics for the Samples |
| CYCLOATE |
| Characteristic | N | % | % Basis |
|---|---|---|---|
| Plotted | 84 | 100% | Spiked |
| Estimated Values | 5 | 6% | Spiked |
| Deleted Values | 0 | 0% | Spiked + Not Spiked |
| Spiked, Censored | 0 | 0% | Spiked |
| Spiked | 84 | . | |
| False Negatives | 0 | 0% | 0 out of 84 |
| Not Spiked | 112 | . | |
| False Positives | 1 | 1% | 1 out of 112 |
| BQS ORGANIC BLIND SAMPLES |
| TERBACIL |
| Permanently Estimated Compound |
| Schedule: 2060 Testid: 04032LCM29 |
| 02/09/07 TO 12/05/12 |
| Open Data Set |
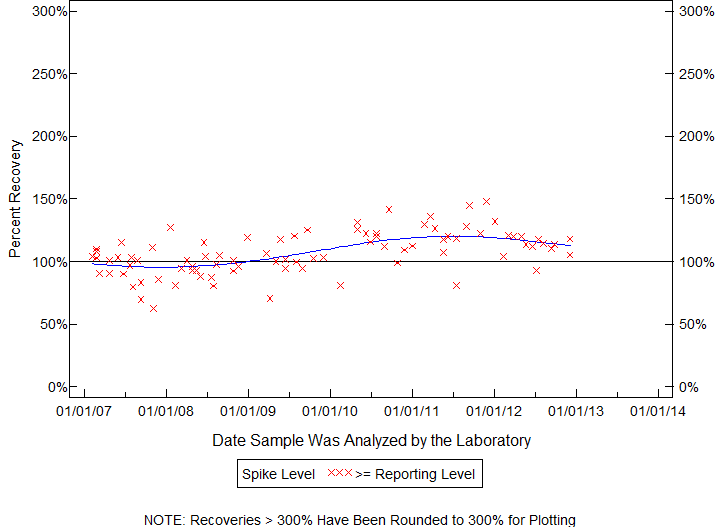
| Statistics for the Plotted Points |
| TERBACIL |
| Spike Level | N | Mean | Std-Dev. | Median | F_Pseudo |
|---|---|---|---|---|---|
| >= Reporting Level | 87 | 107% | 17% | 105% | 18% |
| Total | 87 | 107% | 17% | 105% | 18% |
| Miscellaneous Statistics for the Samples |
| TERBACIL |
| Characteristic | N | % | % Basis |
|---|---|---|---|
| Plotted | 87 | 100% | Spiked |
| Estimated Values | 4 | 5% | Spiked |
| Deleted Values | 0 | 0% | Spiked + Not Spiked |
| Spiked, Censored | 0 | 0% | Spiked |
| Spiked | 87 | . | |
| False Negatives | 0 | 0% | 0 out of 87 |
| Not Spiked | 109 | . | |
| False Positives | 1 | 1% | 1 out of 109 |
| BQS ORGANIC BLIND SAMPLES |
| DIPHENAMID, |
| Schedule: 2060 Testid: 04033LCM29 |
| Measured in MICROGRAMS PER LITER |
| 02/09/07 TO 12/21/12 |
| Open Data Set |
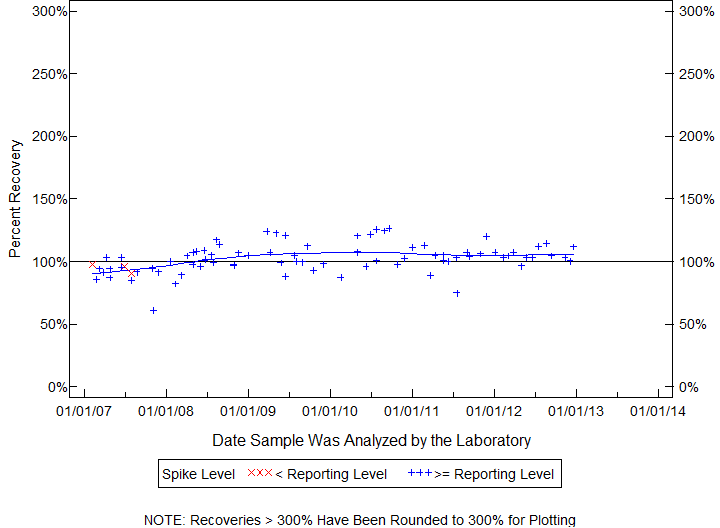
| Statistics for the Plotted Points |
| DIPHENAMID |
| Spike Level | N | Mean | Std-Dev. | Median | F_Pseudo |
|---|---|---|---|---|---|
| < Reporting Level | 3 | 95% | 4% | 96% | 5% |
| >= Reporting Level | 81 | 102% | 12% | 103% | 8% |
| Total | 84 | 102% | 12% | 103% | 9% |
| Miscellaneous Statistics for the Samples |
| DIPHENAMID |
| Characteristic | N | % | % Basis |
|---|---|---|---|
| Plotted | 84 | 100% | Spiked |
| Estimated Values | 8 | 10% | Spiked |
| Deleted Values | 1 | 1% | Spiked + Not Spiked |
| Spiked, Censored | 0 | 0% | Spiked |
| Spiked | 84 | . | |
| False Negatives | 0 | 0% | 0 out of 84 |
| Not Spiked | 112 | . | |
| False Positives | 0 | 0% | 0 out of 111 |
| BQS ORGANIC BLIND SAMPLES |
| DEISOPROPYLATRAZINE (2-CHLORO-6-ETHYLAMINO-4-AMINO-S-TRIAZINE) CEAT |
| Permanently Estimated Compound |
| Schedule: 2060 Testid: 04038LCM29 |
| 02/09/07 TO 12/05/12 |
| Open Data Set |
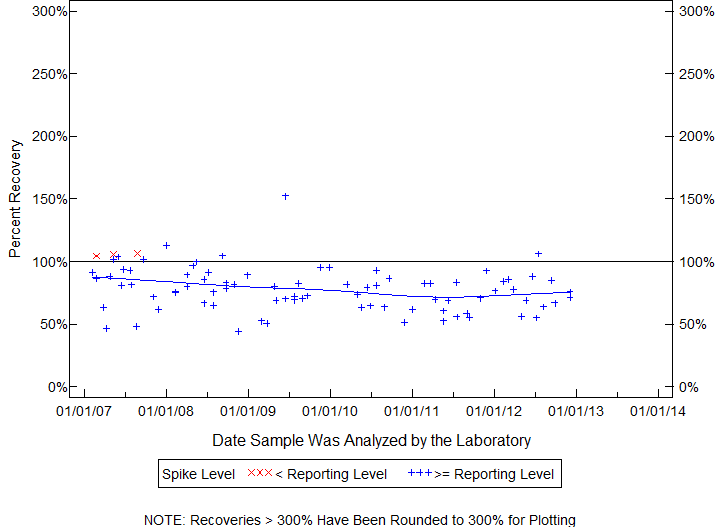
| Statistics for the Plotted Points |
| DEISOPROPYLATRAZINE (2-CHLORO-6-ETHYLAMINO-4-AMINO-S-TRIAZINE) CEAT |
| Spike Level | N | Mean | Std-Dev. | Median | F_Pseudo |
|---|---|---|---|---|---|
| < Reporting Level | 3 | 106% | 1% | 106% | 1% |
| >= Reporting Level | 84 | 78% | 17% | 78% | 16% |
| Total | 87 | 79% | 18% | 80% | 17% |
| Miscellaneous Statistics for the Samples |
| DEISOPROPYLATRAZINE (2-CHLORO-6-ETHYLAMINO-4-AMINO-S-TRIAZINE) CEAT |
| Characteristic | N | % | % Basis |
|---|---|---|---|
| Plotted | 87 | 99% | Spiked |
| Estimated Values | 7 | 8% | Spiked |
| Deleted Values | 2 | 1% | Spiked + Not Spiked |
| Spiked, Censored | 0 | 0% | Spiked |
| Spiked | 88 | . | |
| False Negatives | 1 | 1% | 1 out of 88 |
| Not Spiked | 108 | . | |
| False Positives | 0 | 0% | 0 out of 106 |
| BQS ORGANIC BLIND SAMPLES |
| DEETHYLATRAZINE (DESETHYL ATRAZINE) (2-CHLORO-4-ISOPROPYLAMINO-6-S-TRIAZINE) CIAT |
| Permanently Estimated Compound |
| Schedule: 2060 Testid: 04040LCM29 |
| 02/09/07 TO 12/05/12 |
| Open Data Set |
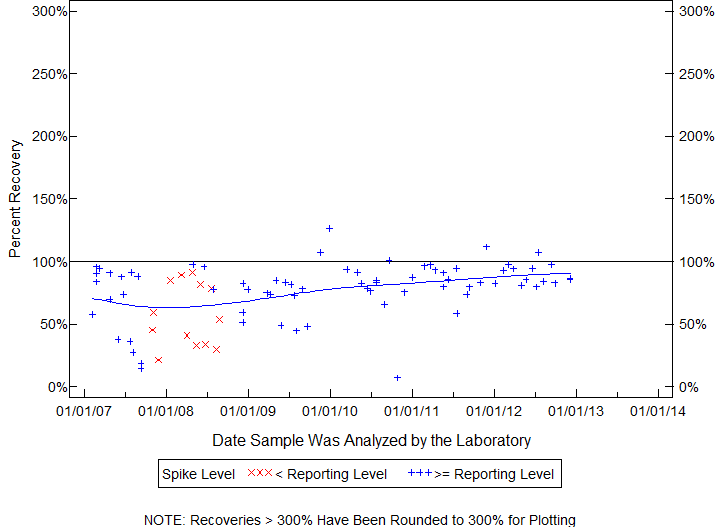
| Statistics for the Plotted Points |
| DEETHYLATRAZINE (DESETHYL ATRAZINE) (2-CHLORO-4-ISOPROPYLAMINO-6-S-TRIAZINE) CIAT |
| Spike Level | N | Mean | Std-Dev. | Median | F_Pseudo |
|---|---|---|---|---|---|
| < Reporting Level | 13 | 57% | 25% | 54% | 36% |
| >= Reporting Level | 73 | 79% | 22% | 83% | 14% |
| Total | 86 | 76% | 24% | 83% | 19% |
| Miscellaneous Statistics for the Samples |
| DEETHYLATRAZINE (DESETHYL ATRAZINE) (2-CHLORO-4-ISOPROPYLAMINO-6-S-TRIAZINE) CIAT |
| Characteristic | N | % | % Basis |
|---|---|---|---|
| Plotted | 86 | 100% | Spiked |
| Estimated Values | 17 | 20% | Spiked |
| Deleted Values | 2 | 1% | Spiked + Not Spiked |
| Spiked, Censored | 0 | 0% | Spiked |
| Spiked | 87 | . | |
| False Negatives | 0 | 0% | 0 out of 86 |
| Not Spiked | 109 | . | |
| False Positives | 0 | 0% | 0 out of 108 |
| BQS ORGANIC BLIND SAMPLES |
| DICAMBA, |
| Schedule: 2060 Testid: 38442LCM29 |
| Measured in MICROGRAMS PER LITER |
| 02/09/07 TO 12/06/12 |
| Open Data Set |
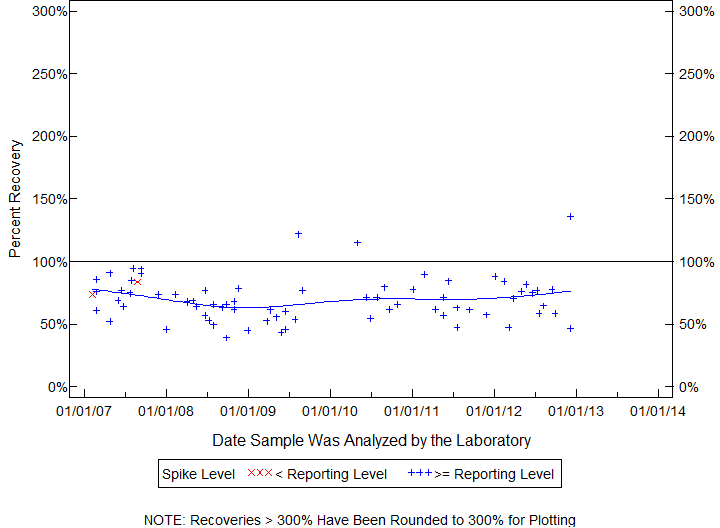
| Statistics for the Plotted Points |
| DICAMBA |
| Spike Level | N | Mean | Std-Dev. | Median | F_Pseudo |
|---|---|---|---|---|---|
| < Reporting Level | 2 | 79% | 7% | 79% | 7% |
| >= Reporting Level | 72 | 70% | 18% | 68% | 15% |
| Total | 74 | 70% | 17% | 68% | 14% |
| Miscellaneous Statistics for the Samples |
| DICAMBA |
| Characteristic | N | % | % Basis |
|---|---|---|---|
| Plotted | 74 | 85% | Spiked |
| Estimated Values | 9 | 10% | Spiked |
| Deleted Values | 0 | 0% | Spiked + Not Spiked |
| Spiked, Censored | 1 | 1% | Spiked |
| Spiked | 87 | . | |
| False Negatives | 12 | 14% | 12 out of 87 |
| Not Spiked | 109 | . | |
| False Positives | 0 | 0% | 0 out of 109 |
| BQS ORGANIC BLIND SAMPLES |
| LINURON, |
| Schedule: 2060 Testid: 38478LCM29 |
| Measured in MICROGRAMS PER LITER |
| 02/09/07 TO 12/21/12 |
| Open Data Set |
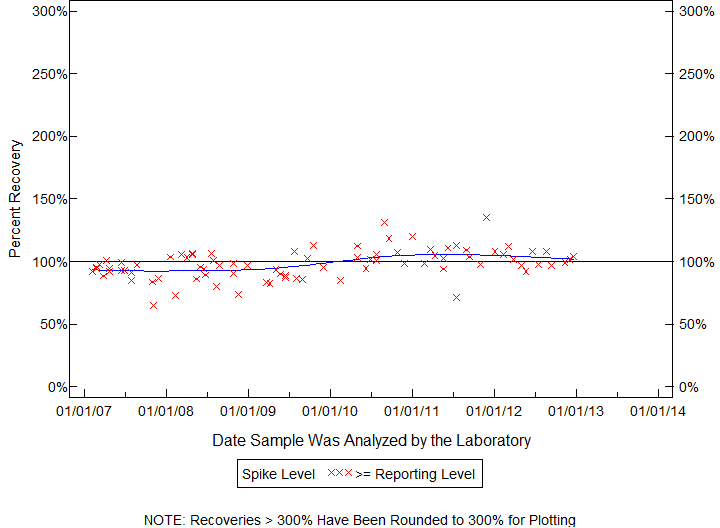
| Statistics for the Plotted Points |
| LINURON |
| Spike Level | N | Mean | Std-Dev. | Median | F_Pseudo |
|---|---|---|---|---|---|
| >= Reporting Level | 84 | 98% | 12% | 98% | 10% |
| Total | 84 | 98% | 12% | 98% | 10% |
| Miscellaneous Statistics for the Samples |
| LINURON |
| Characteristic | N | % | % Basis |
|---|---|---|---|
| Plotted | 84 | 100% | Spiked |
| Estimated Values | 4 | 5% | Spiked |
| Deleted Values | 0 | 0% | Spiked + Not Spiked |
| Spiked, Censored | 0 | 0% | Spiked |
| Spiked | 84 | . | |
| False Negatives | 0 | 0% | 0 out of 84 |
| Not Spiked | 112 | . | |
| False Positives | 0 | 0% | 0 out of 112 |
| BQS ORGANIC BLIND SAMPLES |
| MCPA, |
| Schedule: 2060 Testid: 38482LCM29 |
| Measured in MICROGRAMS PER LITER |
| 02/09/07 TO 12/21/12 |
| Open Data Set |
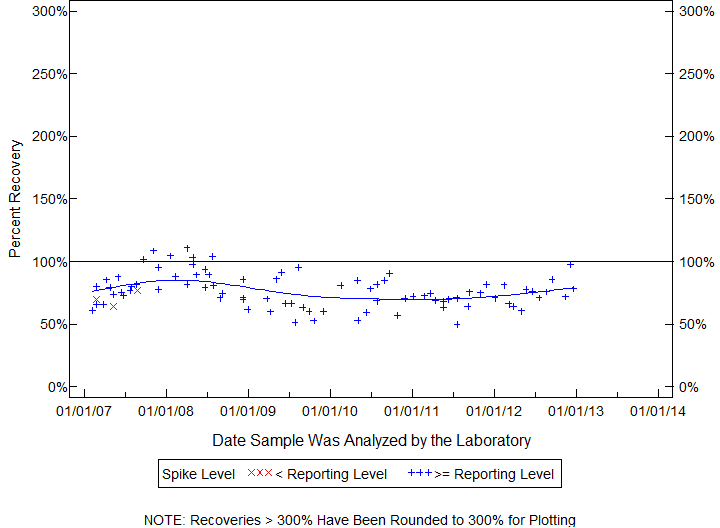
| Statistics for the Plotted Points |
| MCPA |
| Spike Level | N | Mean | Std-Dev. | Median | F_Pseudo |
|---|---|---|---|---|---|
| < Reporting Level | 3 | 70% | 6% | 70% | 9% |
| >= Reporting Level | 84 | 77% | 13% | 76% | 13% |
| Total | 87 | 77% | 13% | 76% | 14% |
| Miscellaneous Statistics for the Samples |
| MCPA |
| Characteristic | N | % | % Basis |
|---|---|---|---|
| Plotted | 87 | 100% | Spiked |
| Estimated Values | 12 | 14% | Spiked |
| Deleted Values | 0 | 0% | Spiked + Not Spiked |
| Spiked, Censored | 0 | 0% | Spiked |
| Spiked | 87 | . | |
| False Negatives | 0 | 0% | 0 out of 87 |
| Not Spiked | 109 | . | |
| False Positives | 0 | 0% | 0 out of 109 |
| BQS ORGANIC BLIND SAMPLES |
| MCPB, |
| Schedule: 2060 Testid: 38487LCM29 |
| Measured in MICROGRAMS PER LITER |
| 02/09/07 TO 12/21/12 |
| Open Data Set |
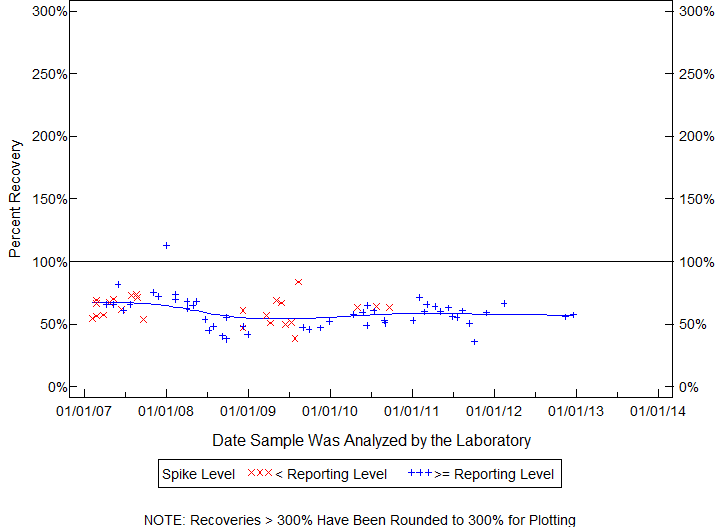
| Statistics for the Plotted Points |
| MCPB |
| Spike Level | N | Mean | Std-Dev. | Median | F_Pseudo |
|---|---|---|---|---|---|
| < Reporting Level | 25 | 62% | 10% | 63% | 11% |
| >= Reporting Level | 51 | 59% | 13% | 59% | 11% |
| Total | 76 | 60% | 12% | 60% | 11% |
| Miscellaneous Statistics for the Samples |
| MCPB |
| Characteristic | N | % | % Basis |
|---|---|---|---|
| Plotted | 76 | 89% | Spiked |
| Estimated Values | 42 | 49% | Spiked |
| Deleted Values | 0 | 0% | Spiked + Not Spiked |
| Spiked, Censored | 0 | 0% | Spiked |
| Spiked | 85 | . | |
| False Negatives | 9 | 11% | 9 out of 85 |
| Not Spiked | 111 | . | |
| False Positives | 0 | 0% | 0 out of 111 |
| BQS ORGANIC BLIND SAMPLES |
| METHIOCARB |
| Permanently Estimated Compound |
| Schedule: 2060 Testid: 38501LCM29 |
| 02/09/07 TO 12/21/12 |
| Open Data Set |
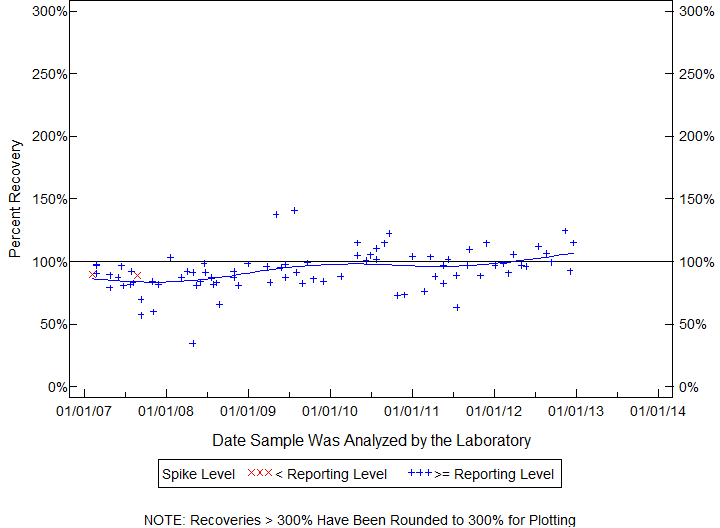
| Statistics for the Plotted Points |
| METHIOCARB |
| Spike Level | N | Mean | Std-Dev. | Median | F_Pseudo |
|---|---|---|---|---|---|
| < Reporting Level | 2 | 90% | 1% | 90% | 1% |
| >= Reporting Level | 81 | 93% | 16% | 92% | 13% |
| Total | 83 | 93% | 16% | 91% | 13% |
| Miscellaneous Statistics for the Samples |
| METHIOCARB |
| Characteristic | N | % | % Basis |
|---|---|---|---|
| Plotted | 83 | 98% | Spiked |
| Estimated Values | 7 | 8% | Spiked |
| Deleted Values | 3 | 2% | Spiked + Not Spiked |
| Spiked, Censored | 1 | 1% | Spiked |
| Spiked | 86 | . | |
| False Negatives | 1 | 1% | 1 out of 85 |
| Not Spiked | 110 | . | |
| False Positives | 0 | 0% | 0 out of 108 |
| BQS ORGANIC BLIND SAMPLES |
| PROPOXUR |
| Permanently Estimated Compound |
| Schedule: 2060 Testid: 38538LCM29 |
| 02/09/07 TO 12/05/12 |
| Open Data Set |
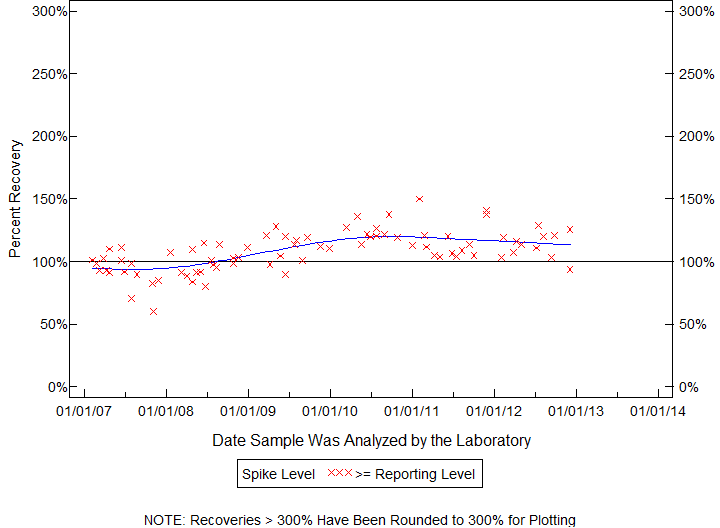
| Statistics for the Plotted Points |
| PROPOXUR |
| Spike Level | N | Mean | Std-Dev. | Median | F_Pseudo |
|---|---|---|---|---|---|
| >= Reporting Level | 82 | 108% | 16% | 108% | 16% |
| Total | 82 | 108% | 16% | 108% | 16% |
| Miscellaneous Statistics for the Samples |
| PROPOXUR |
| Characteristic | N | % | % Basis |
|---|---|---|---|
| Plotted | 82 | 100% | Spiked |
| Estimated Values | 29 | 35% | Spiked |
| Deleted Values | 3 | 2% | Spiked + Not Spiked |
| Spiked, Censored | 0 | 0% | Spiked |
| Spiked | 83 | . | |
| False Negatives | 0 | 0% | 0 out of 82 |
| Not Spiked | 113 | . | |
| False Positives | 0 | 0% | 0 out of 111 |
| BQS ORGANIC BLIND SAMPLES |
| SIDURON, |
| Schedule: 2060 Testid: 38548LCM29 |
| Measured in MICROGRAMS PER LITER |
| 02/09/07 TO 12/21/12 |
| Open Data Set |
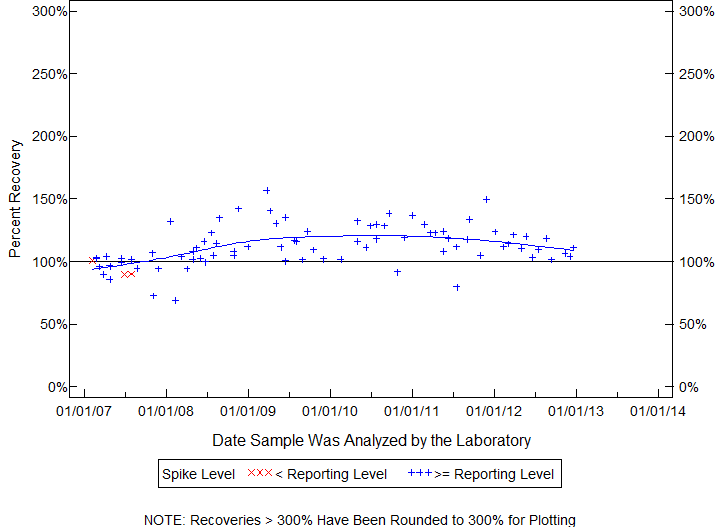
| Statistics for the Plotted Points |
| SIDURON |
| Spike Level | N | Mean | Std-Dev. | Median | F_Pseudo |
|---|---|---|---|---|---|
| < Reporting Level | 3 | 94% | 6% | 90% | 9% |
| >= Reporting Level | 81 | 113% | 16% | 111% | 15% |
| Total | 84 | 112% | 16% | 111% | 16% |
| Miscellaneous Statistics for the Samples |
| SIDURON |
| Characteristic | N | % | % Basis |
|---|---|---|---|
| Plotted | 84 | 100% | Spiked |
| Estimated Values | 7 | 8% | Spiked |
| Deleted Values | 0 | 0% | Spiked + Not Spiked |
| Spiked, Censored | 0 | 0% | Spiked |
| Spiked | 84 | . | |
| False Negatives | 0 | 0% | 0 out of 84 |
| Not Spiked | 112 | . | |
| False Positives | 0 | 0% | 0 out of 112 |
| BQS ORGANIC BLIND SAMPLES |
| BENTAZON |
| Permanently Estimated Compound |
| Schedule: 2060 Testid: 38711LCM29 |
| 02/09/07 TO 12/06/12 |
| Open Data Set |
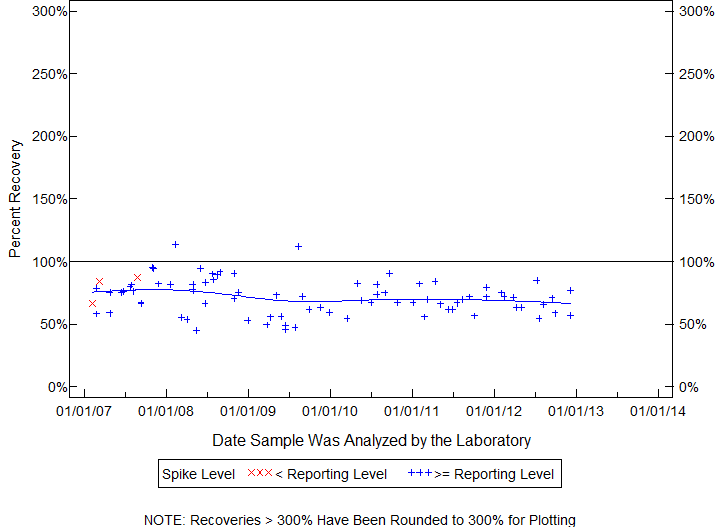
| Statistics for the Plotted Points |
| BENTAZON |
| Spike Level | N | Mean | Std-Dev. | Median | F_Pseudo |
|---|---|---|---|---|---|
| < Reporting Level | 3 | 80% | 11% | 85% | 15% |
| >= Reporting Level | 80 | 72% | 14% | 72% | 15% |
| Total | 83 | 72% | 14% | 72% | 15% |
| Miscellaneous Statistics for the Samples |
| BENTAZON |
| Characteristic | N | % | % Basis |
|---|---|---|---|
| Plotted | 83 | 98% | Spiked |
| Estimated Values | 21 | 25% | Spiked |
| Deleted Values | 0 | 0% | Spiked + Not Spiked |
| Spiked, Censored | 0 | 0% | Spiked |
| Spiked | 85 | . | |
| False Negatives | 2 | 2% | 2 out of 85 |
| Not Spiked | 111 | . | |
| False Positives | 2 | 2% | 2 out of 111 |
| BQS ORGANIC BLIND SAMPLES |
| 2,4-DB |
| Permanently Estimated Compound |
| Schedule: 2060 Testid: 38746LCM29 |
| 02/09/07 TO 12/21/12 |
| Open Data Set |
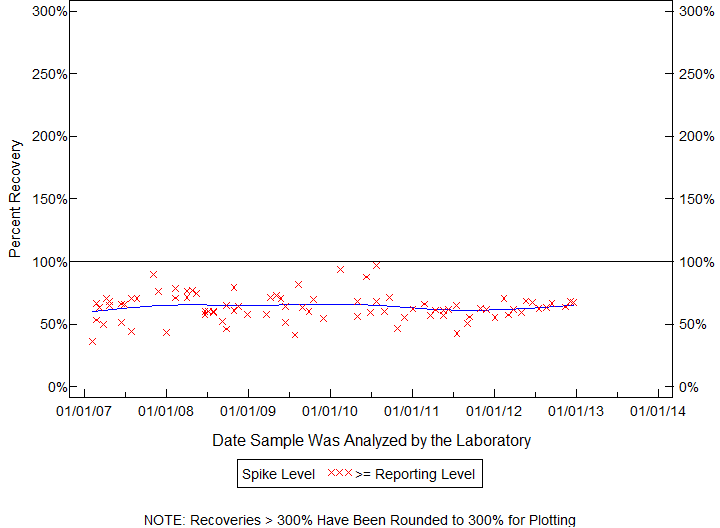
| Statistics for the Plotted Points |
| 2,4-DB |
| Spike Level | N | Mean | Std-Dev. | Median | F_Pseudo |
|---|---|---|---|---|---|
| >= Reporting Level | 84 | 64% | 11% | 63% | 9% |
| Total | 84 | 64% | 11% | 63% | 9% |
| Miscellaneous Statistics for the Samples |
| 2,4-DB |
| Characteristic | N | % | % Basis |
|---|---|---|---|
| Plotted | 84 | 100% | Spiked |
| Estimated Values | 6 | 7% | Spiked |
| Deleted Values | 0 | 0% | Spiked + Not Spiked |
| Spiked, Censored | 0 | 0% | Spiked |
| Spiked | 84 | . | |
| False Negatives | 0 | 0% | 0 out of 84 |
| Not Spiked | 112 | . | |
| False Positives | 4 | 4% | 4 out of 112 |
| BQS ORGANIC BLIND SAMPLES |
| FLUOMETURON, |
| Schedule: 2060 Testid: 38811LCM29 |
| Measured in MICROGRAMS PER LITER |
| 02/09/07 TO 12/21/12 |
| Open Data Set |
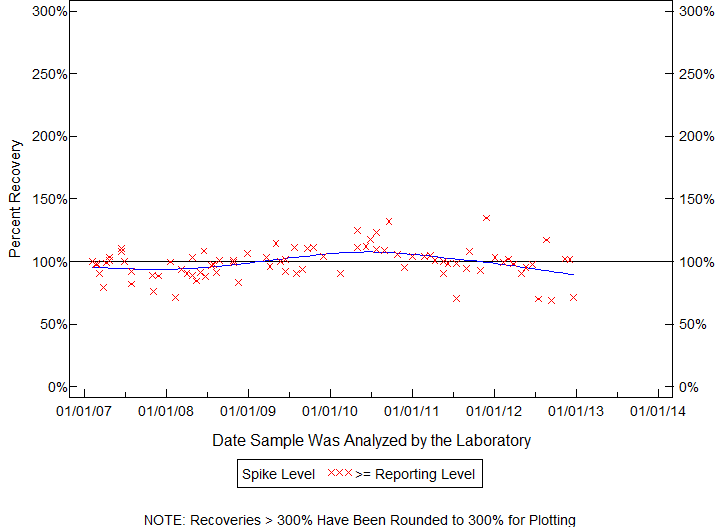
| Statistics for the Plotted Points |
| FLUOMETURON |
| Spike Level | N | Mean | Std-Dev. | Median | F_Pseudo |
|---|---|---|---|---|---|
| >= Reporting Level | 83 | 99% | 13% | 100% | 10% |
| Total | 83 | 99% | 13% | 100% | 10% |
| Miscellaneous Statistics for the Samples |
| FLUOMETURON |
| Characteristic | N | % | % Basis |
|---|---|---|---|
| Plotted | 83 | 99% | Spiked |
| Estimated Values | 2 | 2% | Spiked |
| Deleted Values | 0 | 0% | Spiked + Not Spiked |
| Spiked, Censored | 0 | 0% | Spiked |
| Spiked | 84 | . | |
| False Negatives | 1 | 1% | 1 out of 84 |
| Not Spiked | 112 | . | |
| False Positives | 0 | 0% | 0 out of 112 |
| BQS ORGANIC BLIND SAMPLES |
| OXAMYL, |
| Schedule: 2060 Testid: 38866LCM29 |
| Measured in MICROGRAMS PER LITER |
| 02/09/07 TO 12/21/12 |
| Open Data Set |
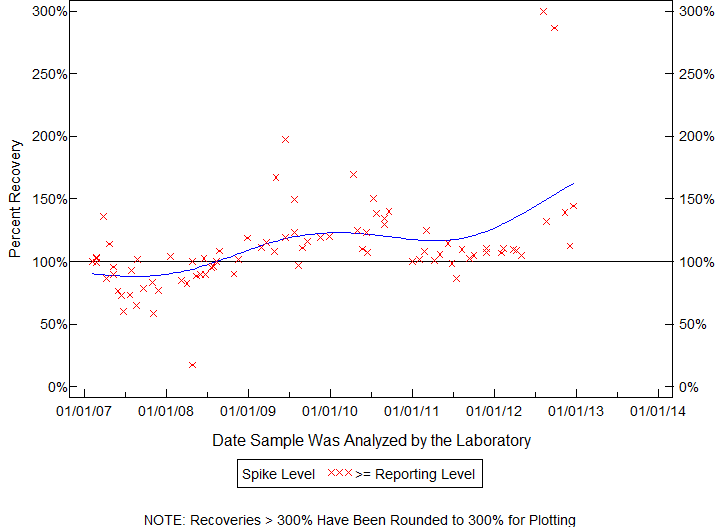
| Statistics for the Plotted Points |
| OXAMYL |
| Spike Level | N | Mean | Std-Dev. | Median | F_Pseudo |
|---|---|---|---|---|---|
| >= Reporting Level | 84 | 111% | 38% | 106% | 18% |
| Total | 84 | 111% | 38% | 106% | 18% |
| Miscellaneous Statistics for the Samples |
| OXAMYL |
| Characteristic | N | % | % Basis |
|---|---|---|---|
| Plotted | 84 | 100% | Spiked |
| Estimated Values | 72 | 86% | Spiked |
| Deleted Values | 4 | 2% | Spiked + Not Spiked |
| Spiked, Censored | 0 | 0% | Spiked |
| Spiked | 85 | . | |
| False Negatives | 0 | 0% | 0 out of 84 |
| Not Spiked | 111 | . | |
| False Positives | 1 | 1% | 1 out of 108 |
| BQS ORGANIC BLIND SAMPLES |
| ATRAZINE, |
| Schedule: 2060 Testid: 39632LCM29 |
| Measured in MICROGRAMS PER LITER |
| 02/09/07 TO 12/05/12 |
| Open Data Set |
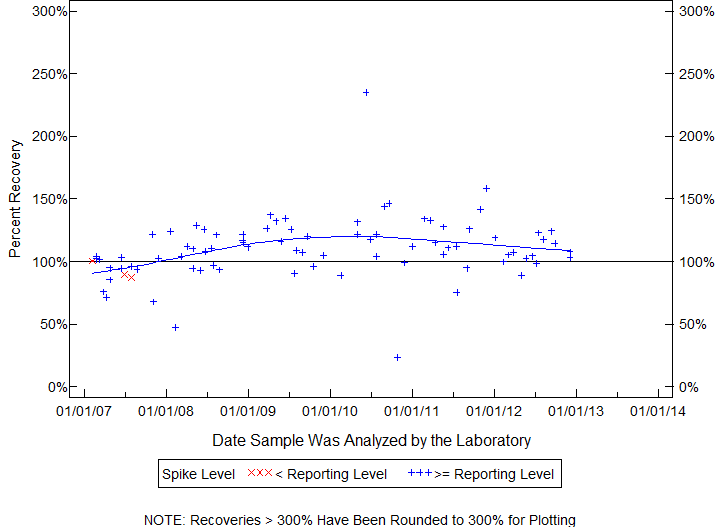
| Statistics for the Plotted Points |
| ATRAZINE |
| Spike Level | N | Mean | Std-Dev. | Median | F_Pseudo |
|---|---|---|---|---|---|
| < Reporting Level | 3 | 93% | 7% | 90% | 10% |
| >= Reporting Level | 82 | 110% | 25% | 110% | 17% |
| Total | 85 | 110% | 25% | 108% | 18% |
| Miscellaneous Statistics for the Samples |
| ATRAZINE |
| Characteristic | N | % | % Basis |
|---|---|---|---|
| Plotted | 85 | 100% | Spiked |
| Estimated Values | 10 | 12% | Spiked |
| Deleted Values | 0 | 0% | Spiked + Not Spiked |
| Spiked, Censored | 0 | 0% | Spiked |
| Spiked | 85 | . | |
| False Negatives | 0 | 0% | 0 out of 85 |
| Not Spiked | 111 | . | |
| False Positives | 1 | 1% | 1 out of 111 |
| BQS ORGANIC BLIND SAMPLES |
| 2,4-D, |
| Schedule: 2060 Testid: 39732LCM29 |
| Measured in MICROGRAMS PER LITER |
| 02/09/07 TO 12/06/12 |
| Open Data Set |
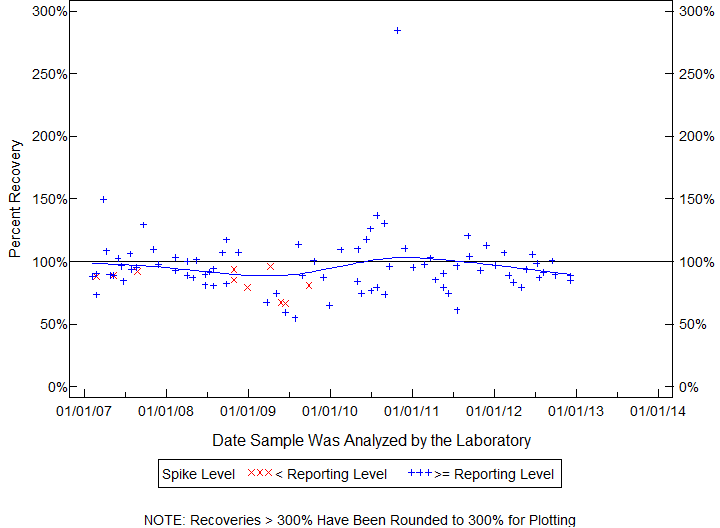
| Statistics for the Plotted Points |
| 2,4-D |
| Spike Level | N | Mean | Std-Dev. | Median | F_Pseudo |
|---|---|---|---|---|---|
| < Reporting Level | 10 | 84% | 10% | 87% | 9% |
| >= Reporting Level | 81 | 97% | 27% | 94% | 16% |
| Total | 91 | 96% | 26% | 92% | 15% |
| Miscellaneous Statistics for the Samples |
| 2,4-D |
| Characteristic | N | % | % Basis |
|---|---|---|---|
| Plotted | 91 | 99% | Spiked |
| Estimated Values | 15 | 16% | Spiked |
| Deleted Values | 0 | 0% | Spiked + Not Spiked |
| Spiked, Censored | 0 | 0% | Spiked |
| Spiked | 92 | . | |
| False Negatives | 1 | 1% | 1 out of 92 |
| Not Spiked | 104 | . | |
| False Positives | 0 | 0% | 0 out of 104 |
| BQS ORGANIC BLIND SAMPLES |
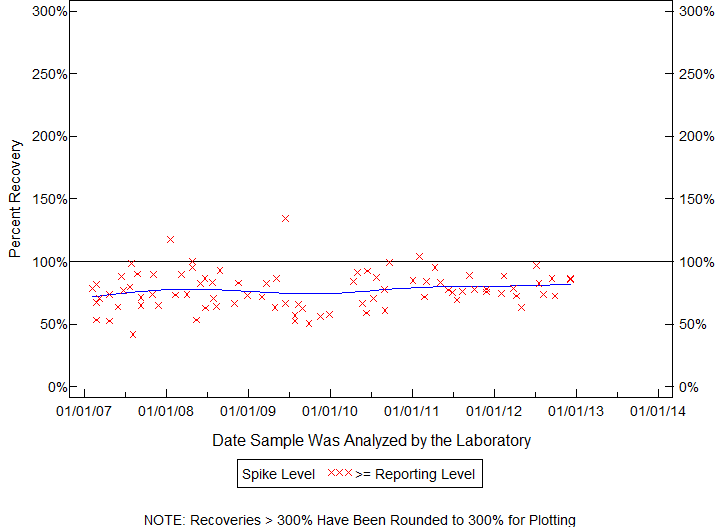
| TRICLOPYR, |
| Schedule: 2060 Testid: 49235LCM29 |
| Measured in MICROGRAMS PER LITER |
| 02/09/07 TO 12/06/12 |
| Open Data Set |
| Statistics for the Plotted Points |
| TRICLOPYR |
| Spike Level | N | Mean | Std-Dev. | Median | F_Pseudo |
|---|---|---|---|---|---|
| >= Reporting Level | 85 | 77% | 15% | 76% | 15% |
| Total | 85 | 77% | 15% | 76% | 15% |
| Miscellaneous Statistics for the Samples |
| TRICLOPYR |
| Characteristic | N | % | % Basis |
|---|---|---|---|
| Plotted | 85 | 100% | Spiked |
| Estimated Values | 5 | 6% | Spiked |
| Deleted Values | 0 | 0% | Spiked + Not Spiked |
| Spiked, Censored | 0 | 0% | Spiked |
| Spiked | 85 | . | |
| False Negatives | 0 | 0% | 0 out of 85 |
| Not Spiked | 111 | . | |
| False Positives | 0 | 0% | 0 out of 111 |
| BQS ORGANIC BLIND SAMPLES |
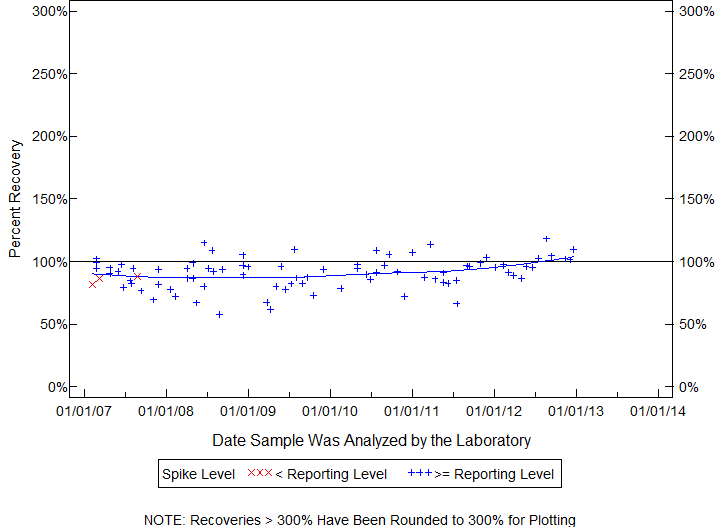
| PROPHAM, |
| Schedule: 2060 Testid: 49236LCM29 |
| Measured in MICROGRAMS PER LITER |
| 02/09/07 TO 12/21/12 |
| Open Data Set |
| Statistics for the Plotted Points |
| PROPHAM |
| Spike Level | N | Mean | Std-Dev. | Median | F_Pseudo |
|---|---|---|---|---|---|
| < Reporting Level | 3 | 86% | 3% | 87% | 5% |
| >= Reporting Level | 82 | 91% | 12% | 92% | 11% |
| Total | 85 | 91% | 12% | 92% | 11% |
| Miscellaneous Statistics for the Samples |
| PROPHAM |
| Characteristic | N | % | % Basis |
|---|---|---|---|
| Plotted | 85 | 99% | Spiked |
| Estimated Values | 6 | 7% | Spiked |
| Deleted Values | 0 | 0% | Spiked + Not Spiked |
| Spiked, Censored | 0 | 0% | Spiked |
| Spiked | 86 | . | |
| False Negatives | 1 | 1% | 1 out of 86 |
| Not Spiked | 110 | . | |
| False Positives | 0 | 0% | 0 out of 110 |
| BQS ORGANIC BLIND SAMPLES |
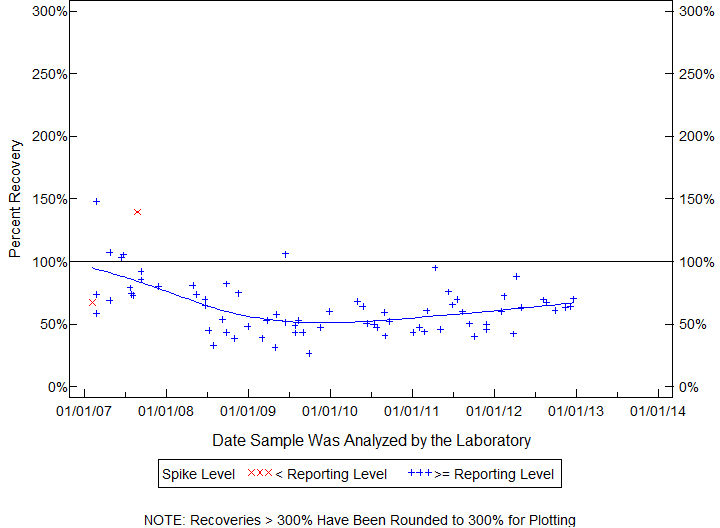
| PICLORAM, |
| Schedule: 2060 Testid: 49291LCM29 |
| Measured in MICROGRAMS PER LITER |
| 02/09/07 TO 12/21/12 |
| Open Data Set |
| Statistics for the Plotted Points |
| PICLORAM |
| Spike Level | N | Mean | Std-Dev. | Median | F_Pseudo |
|---|---|---|---|---|---|
| < Reporting Level | 2 | 104% | 51% | 104% | 53% |
| >= Reporting Level | 71 | 63% | 21% | 60% | 19% |
| Total | 73 | 64% | 23% | 61% | 19% |
| Miscellaneous Statistics for the Samples |
| PICLORAM |
| Characteristic | N | % | % Basis |
|---|---|---|---|
| Plotted | 73 | 88% | Spiked |
| Estimated Values | 59 | 71% | Spiked |
| Deleted Values | 3 | 2% | Spiked + Not Spiked |
| Spiked, Censored | 1 | 1% | Spiked |
| Spiked | 84 | . | |
| False Negatives | 9 | 11% | 9 out of 83 |
| Not Spiked | 112 | . | |
| False Positives | 2 | 2% | 2 out of 110 |
| BQS ORGANIC BLIND SAMPLES |
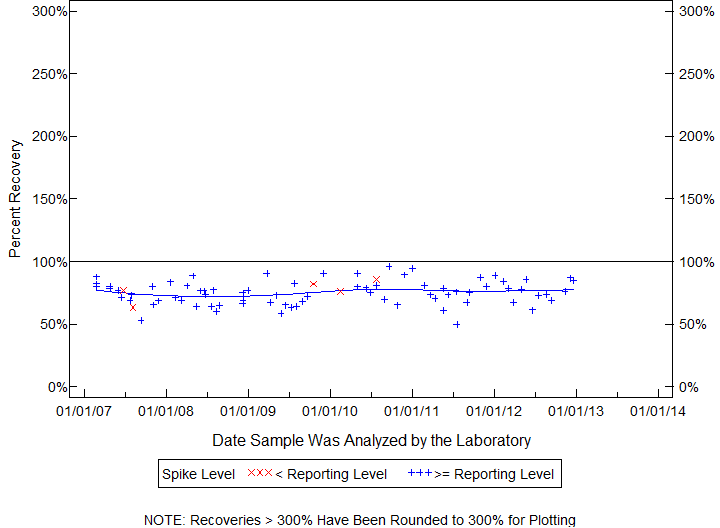
| ORYZALIN, |
| Schedule: 2060 Testid: 49292LCM29 |
| Measured in MICROGRAMS PER LITER |
| 02/27/07 TO 12/21/12 |
| Open Data Set |
| Statistics for the Plotted Points |
| ORYZALIN |
| Spike Level | N | Mean | Std-Dev. | Median | F_Pseudo |
|---|---|---|---|---|---|
| < Reporting Level | 5 | 77% | 8% | 77% | 5% |
| >= Reporting Level | 76 | 75% | 10% | 75% | 9% |
| Total | 81 | 75% | 9% | 76% | 9% |
| Miscellaneous Statistics for the Samples |
| ORYZALIN |
| Characteristic | N | % | % Basis |
|---|---|---|---|
| Plotted | 81 | 94% | Spiked |
| Estimated Values | 12 | 14% | Spiked |
| Deleted Values | 0 | 0% | Spiked + Not Spiked |
| Spiked, Censored | 4 | 5% | Spiked |
| Spiked | 86 | . | |
| False Negatives | 1 | 1% | 1 out of 86 |
| Not Spiked | 110 | . | |
| False Positives | 0 | 0% | 0 out of 110 |
| BQS ORGANIC BLIND SAMPLES |
| NORFLURAZON, |
| Schedule: 2060 Testid: 49293LCM29 |
| Measured in MICROGRAMS PER LITER |
| 02/09/07 TO 12/21/12 |
| Open Data Set |
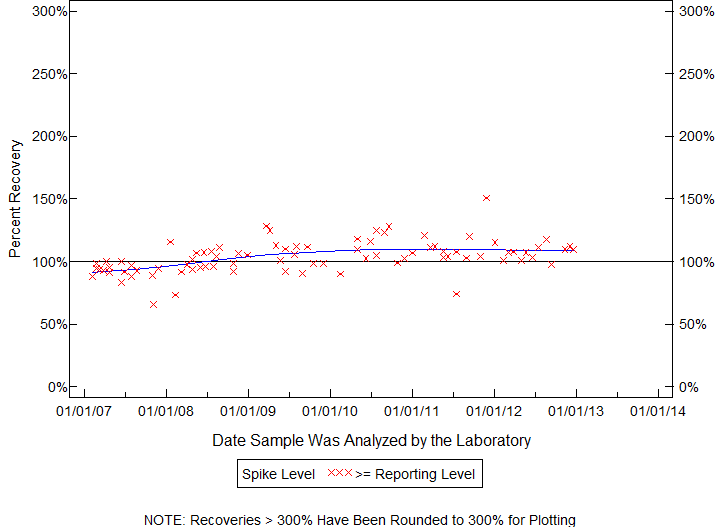
| Statistics for the Plotted Points |
| NORFLURAZON |
| Spike Level | N | Mean | Std-Dev. | Median | F_Pseudo |
|---|---|---|---|---|---|
| >= Reporting Level | 84 | 104% | 13% | 103% | 11% |
| Total | 84 | 104% | 13% | 103% | 11% |
| Miscellaneous Statistics for the Samples |
| NORFLURAZON |
| Characteristic | N | % | % Basis |
|---|---|---|---|
| Plotted | 84 | 100% | Spiked |
| Estimated Values | 3 | 4% | Spiked |
| Deleted Values | 0 | 0% | Spiked + Not Spiked |
| Spiked, Censored | 0 | 0% | Spiked |
| Spiked | 84 | . | |
| False Negatives | 0 | 0% | 0 out of 84 |
| Not Spiked | 112 | . | |
| False Positives | 0 | 0% | 0 out of 112 |
| BQS ORGANIC BLIND SAMPLES |
| NEBURON, |
| Schedule: 2060 Testid: 49294LCM29 |
| Measured in MICROGRAMS PER LITER |
| 02/09/07 TO 12/21/12 |
| Open Data Set |
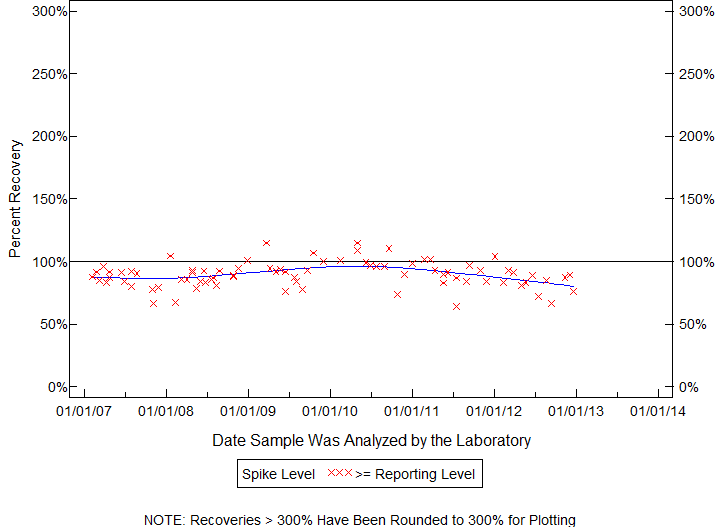
| Statistics for the Plotted Points |
| NEBURON |
| Spike Level | N | Mean | Std-Dev. | Median | F_Pseudo |
|---|---|---|---|---|---|
| >= Reporting Level | 84 | 90% | 10% | 90% | 8% |
| Total | 84 | 90% | 10% | 90% | 8% |
| Miscellaneous Statistics for the Samples |
| NEBURON |
| Characteristic | N | % | % Basis |
|---|---|---|---|
| Plotted | 84 | 100% | Spiked |
| Estimated Values | 2 | 2% | Spiked |
| Deleted Values | 0 | 0% | Spiked + Not Spiked |
| Spiked, Censored | 0 | 0% | Spiked |
| Spiked | 84 | . | |
| False Negatives | 0 | 0% | 0 out of 84 |
| Not Spiked | 112 | . | |
| False Positives | 0 | 0% | 0 out of 112 |
| BQS ORGANIC BLIND SAMPLES |
| METHOMYL, |
| Schedule: 2060 Testid: 49296LCM29 |
| Measured in MICROGRAMS PER LITER |
| 02/09/07 TO 12/21/12 |
| Open Data Set |
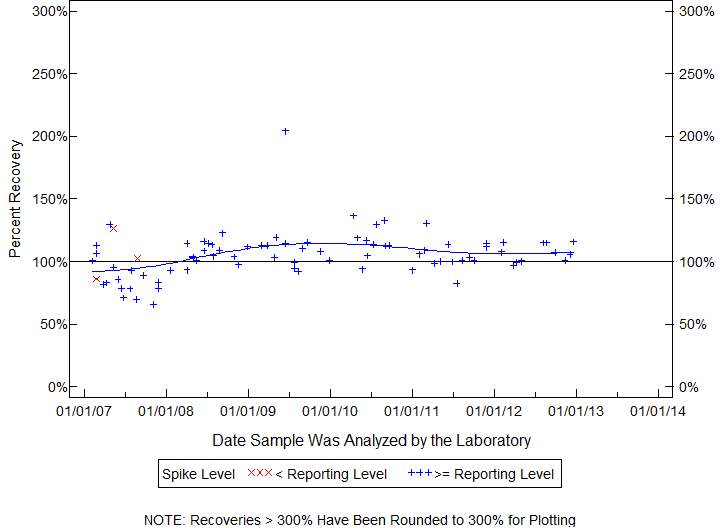
| Statistics for the Plotted Points |
| METHOMYL |
| Spike Level | N | Mean | Std-Dev. | Median | F_Pseudo |
|---|---|---|---|---|---|
| < Reporting Level | 3 | 105% | 20% | 103% | 30% |
| >= Reporting Level | 81 | 105% | 18% | 105% | 12% |
| Total | 84 | 105% | 18% | 105% | 13% |
| Miscellaneous Statistics for the Samples |
| METHOMYL |
| Characteristic | N | % | % Basis |
|---|---|---|---|
| Plotted | 84 | 100% | Spiked |
| Estimated Values | 60 | 71% | Spiked |
| Deleted Values | 4 | 2% | Spiked + Not Spiked |
| Spiked, Censored | 0 | 0% | Spiked |
| Spiked | 85 | . | |
| False Negatives | 0 | 0% | 0 out of 84 |
| Not Spiked | 111 | . | |
| False Positives | 0 | 0% | 0 out of 108 |
| BQS ORGANIC BLIND SAMPLES |
| FENURON, |
| Schedule: 2060 Testid: 49297LCM29 |
| Measured in MICROGRAMS PER LITER |
| 02/09/07 TO 12/05/12 |
| Open Data Set |
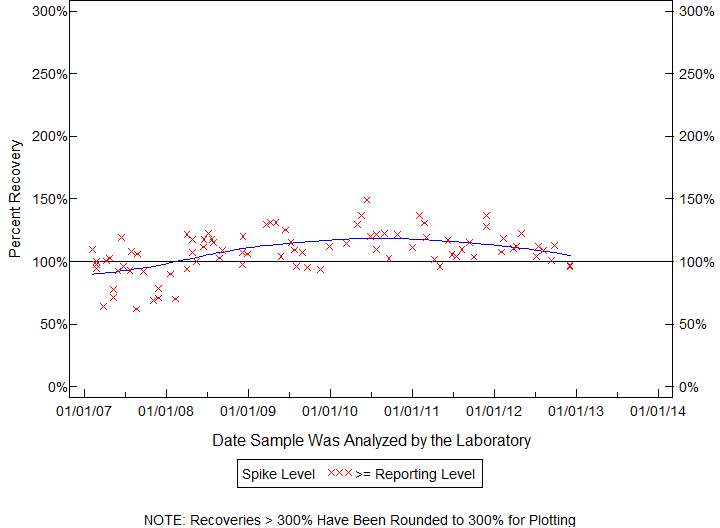
| Statistics for the Plotted Points |
| FENURON |
| Spike Level | N | Mean | Std-Dev. | Median | F_Pseudo |
|---|---|---|---|---|---|
| >= Reporting Level | 86 | 108% | 17% | 109% | 16% |
| Total | 86 | 108% | 17% | 109% | 16% |
| Miscellaneous Statistics for the Samples |
| FENURON |
| Characteristic | N | % | % Basis |
|---|---|---|---|
| Plotted | 86 | 100% | Spiked |
| Estimated Values | 57 | 66% | Spiked |
| Deleted Values | 0 | 0% | Spiked + Not Spiked |
| Spiked, Censored | 0 | 0% | Spiked |
| Spiked | 86 | . | |
| False Negatives | 0 | 0% | 0 out of 86 |
| Not Spiked | 110 | . | |
| False Positives | 0 | 0% | 0 out of 110 |
| BQS ORGANIC BLIND SAMPLES |
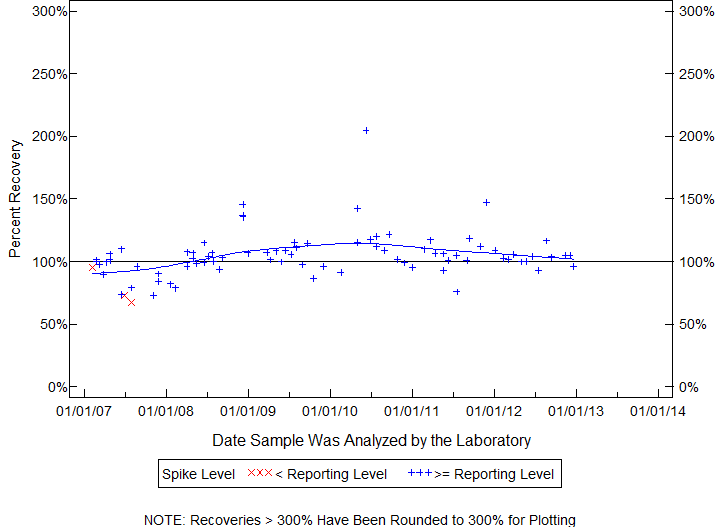
| DIURON, |
| Schedule: 2060 Testid: 49300LCM29 |
| Measured in MICROGRAMS PER LITER |
| 02/09/07 TO 12/21/12 |
| Open Data Set |
| Statistics for the Plotted Points |
| DIURON |
| Spike Level | N | Mean | Std-Dev. | Median | F_Pseudo |
|---|---|---|---|---|---|
| < Reporting Level | 3 | 79% | 15% | 73% | 21% |
| >= Reporting Level | 81 | 105% | 18% | 104% | 9% |
| Total | 84 | 105% | 19% | 103% | 10% |
| Miscellaneous Statistics for the Samples |
| DIURON |
| Characteristic | N | % | % Basis |
|---|---|---|---|
| Plotted | 84 | 100% | Spiked |
| Estimated Values | 9 | 11% | Spiked |
| Deleted Values | 0 | 0% | Spiked + Not Spiked |
| Spiked, Censored | 0 | 0% | Spiked |
| Spiked | 84 | . | |
| False Negatives | 0 | 0% | 0 out of 84 |
| Not Spiked | 112 | . | |
| False Positives | 0 | 0% | 0 out of 112 |
| BQS ORGANIC BLIND SAMPLES |
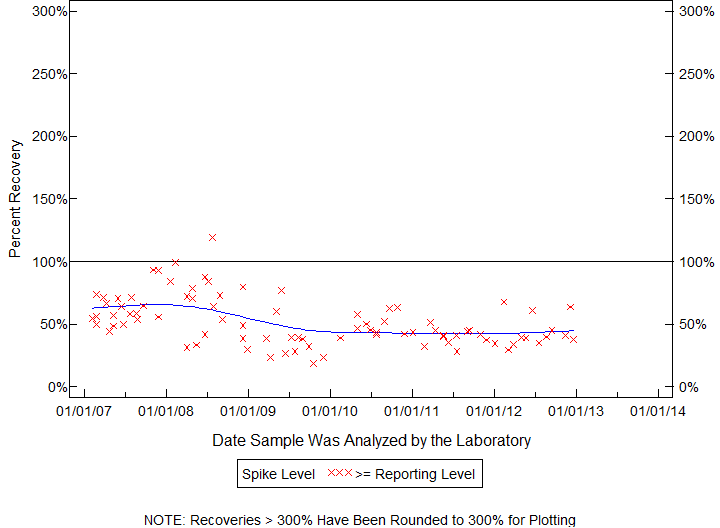
| DINOSEB, |
| Schedule: 2060 Testid: 49301LCM29 |
| Measured in MICROGRAMS PER LITER |
| 02/09/07 TO 12/21/12 |
| Open Data Set |
| Statistics for the Plotted Points |
| DINOSEB |
| Spike Level | N | Mean | Std-Dev. | Median | F_Pseudo |
|---|---|---|---|---|---|
| >= Reporting Level | 87 | 52% | 19% | 47% | 19% |
| Total | 87 | 52% | 19% | 47% | 19% |
| Miscellaneous Statistics for the Samples |
| DINOSEB |
| Characteristic | N | % | % Basis |
|---|---|---|---|
| Plotted | 87 | 100% | Spiked |
| Estimated Values | 12 | 14% | Spiked |
| Deleted Values | 0 | 0% | Spiked + Not Spiked |
| Spiked, Censored | 0 | 0% | Spiked |
| Spiked | 87 | . | |
| False Negatives | 0 | 0% | 0 out of 87 |
| Not Spiked | 109 | . | |
| False Positives | 1 | 1% | 1 out of 109 |
| BQS ORGANIC BLIND SAMPLES |
| DICHLOROPROP (DICHLORPROP), |
| Schedule: 2060 Testid: 49302LCM29 |
| Measured in MICROGRAMS PER LITER |
| 02/09/07 TO 12/21/12 |
| Open Data Set |

| Statistics for the Plotted Points |
| DICHLOROPROP (DICHLORPROP) |
| Spike Level | N | Mean | Std-Dev. | Median | F_Pseudo |
|---|---|---|---|---|---|
| >= Reporting Level | 86 | 84% | 13% | 84% | 15% |
| Total | 86 | 84% | 13% | 84% | 15% |
| Miscellaneous Statistics for the Samples |
| DICHLOROPROP (DICHLORPROP) |
| Characteristic | N | % | % Basis |
|---|---|---|---|
| Plotted | 86 | 100% | Spiked |
| Estimated Values | 8 | 9% | Spiked |
| Deleted Values | 0 | 0% | Spiked + Not Spiked |
| Spiked, Censored | 0 | 0% | Spiked |
| Spiked | 86 | . | |
| False Negatives | 0 | 0% | 0 out of 86 |
| Not Spiked | 110 | . | |
| False Positives | 0 | 0% | 0 out of 110 |
| BQS ORGANIC BLIND SAMPLES |
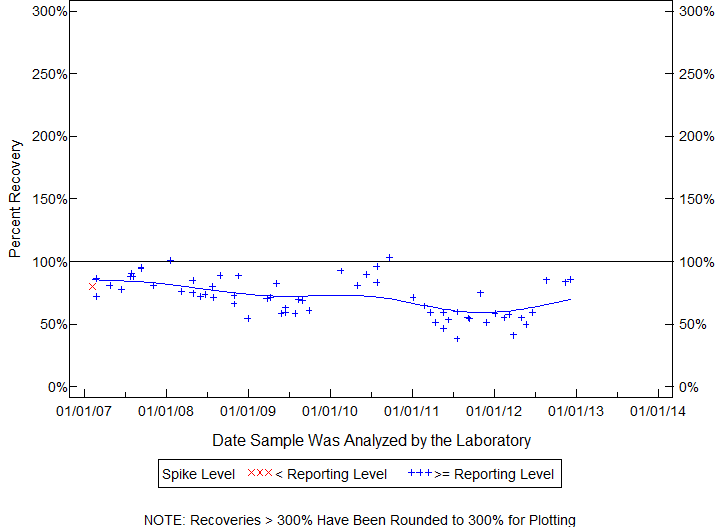
| DACTHAL MONOACID, |
| Schedule: 2060 Testid: 49304LCM29 |
| Measured in MICROGRAMS PER LITER |
| 02/09/07 TO 12/06/12 |
| Open Data Set |
| Statistics for the Plotted Points |
| DACTHAL MONOACID |
| Spike Level | N | Mean | Std-Dev. | Median | F_Pseudo |
|---|---|---|---|---|---|
| < Reporting Level | 1 | 80% | . | 80% | 0% |
| >= Reporting Level | 62 | 72% | 16% | 72% | 19% |
| Total | 63 | 72% | 15% | 72% | 19% |
| Miscellaneous Statistics for the Samples |
| DACTHAL MONOACID |
| Characteristic | N | % | % Basis |
|---|---|---|---|
| Plotted | 63 | 91% | Spiked |
| Estimated Values | 4 | 6% | Spiked |
| Deleted Values | 0 | 0% | Spiked + Not Spiked |
| Spiked, Censored | 0 | 0% | Spiked |
| Spiked | 69 | . | |
| False Negatives | 6 | 9% | 6 out of 69 |
| Not Spiked | 127 | . | |
| False Positives | 0 | 0% | 0 out of 127 |
| BQS ORGANIC BLIND SAMPLES |
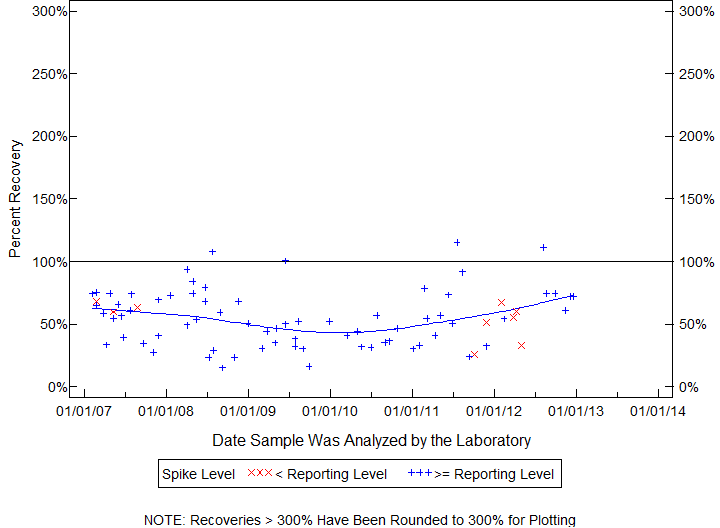
| CLOPYRALID, |
| Schedule: 2060 Testid: 49305LCM29 |
| Measured in MICROGRAMS PER LITER |
| 02/09/07 TO 12/21/12 |
| Open Data Set |
| Statistics for the Plotted Points |
| CLOPYRALID |
| Spike Level | N | Mean | Std-Dev. | Median | F_Pseudo |
|---|---|---|---|---|---|
| < Reporting Level | 9 | 54% | 15% | 60% | 9% |
| >= Reporting Level | 71 | 55% | 23% | 54% | 28% |
| Total | 80 | 55% | 22% | 54% | 26% |
| Miscellaneous Statistics for the Samples |
| CLOPYRALID |
| Characteristic | N | % | % Basis |
|---|---|---|---|
| Plotted | 80 | 94% | Spiked |
| Estimated Values | 60 | 71% | Spiked |
| Deleted Values | 0 | 0% | Spiked + Not Spiked |
| Spiked, Censored | 0 | 0% | Spiked |
| Spiked | 85 | . | |
| False Negatives | 5 | 6% | 5 out of 85 |
| Not Spiked | 111 | . | |
| False Positives | 0 | 0% | 0 out of 111 |
| BQS ORGANIC BLIND SAMPLES |
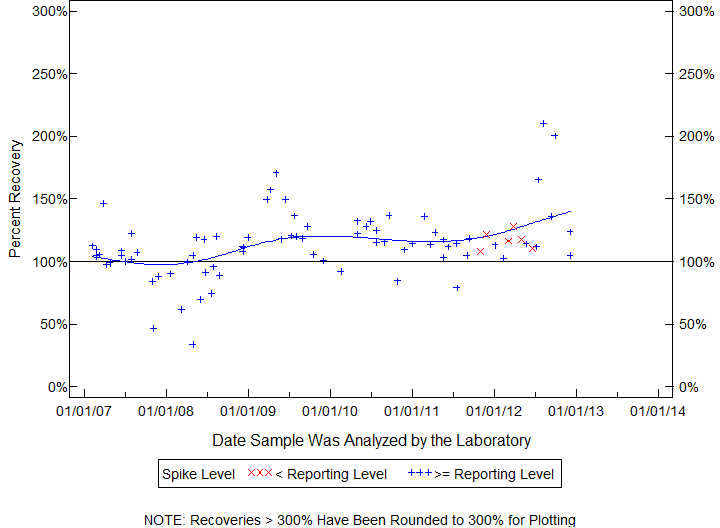
| 3-HYDROXYCARBOFURAN, |
| Schedule: 2060 Testid: 49308LCM29 |
| Measured in MICROGRAMS PER LITER |
| 02/09/07 TO 12/05/12 |
| Open Data Set |
| Statistics for the Plotted Points |
| 3-HYDROXYCARBOFURAN |
| Spike Level | N | Mean | Std-Dev. | Median | F_Pseudo |
|---|---|---|---|---|---|
| < Reporting Level | 6 | 117% | 7% | 117% | 8% |
| >= Reporting Level | 78 | 113% | 27% | 112% | 16% |
| Total | 84 | 114% | 26% | 113% | 15% |
| Miscellaneous Statistics for the Samples |
| 3-HYDROXYCARBOFURAN |
| Characteristic | N | % | % Basis |
|---|---|---|---|
| Plotted | 84 | 100% | Spiked |
| Estimated Values | 10 | 12% | Spiked |
| Deleted Values | 3 | 2% | Spiked + Not Spiked |
| Spiked, Censored | 0 | 0% | Spiked |
| Spiked | 85 | . | |
| False Negatives | 0 | 0% | 0 out of 84 |
| Not Spiked | 111 | . | |
| False Positives | 1 | 1% | 1 out of 109 |
| BQS ORGANIC BLIND SAMPLES |
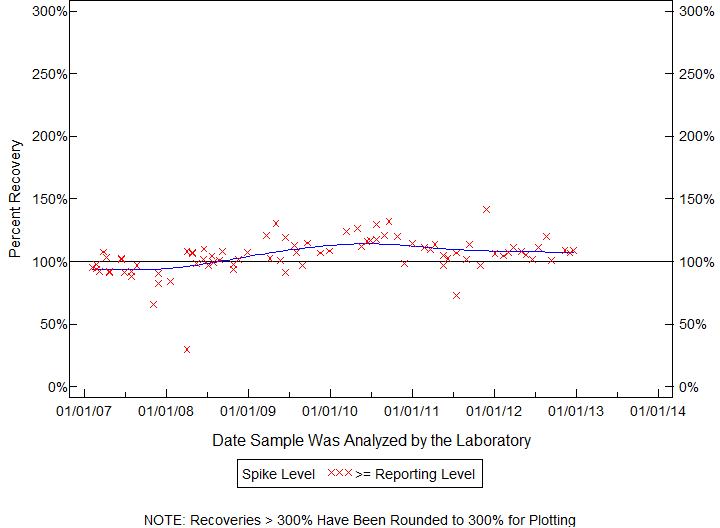
| CARBOFURAN, |
| Schedule: 2060 Testid: 49309LCM29 |
| Measured in MICROGRAMS PER LITER |
| 02/09/07 TO 12/21/12 |
| Open Data Set |
| Statistics for the Plotted Points |
| CARBOFURAN |
| Spike Level | N | Mean | Std-Dev. | Median | F_Pseudo |
|---|---|---|---|---|---|
| >= Reporting Level | 83 | 104% | 15% | 106% | 11% |
| Total | 83 | 104% | 15% | 106% | 11% |
| Miscellaneous Statistics for the Samples |
| CARBOFURAN |
| Characteristic | N | % | % Basis |
|---|---|---|---|
| Plotted | 83 | 100% | Spiked |
| Estimated Values | 1 | 1% | Spiked |
| Deleted Values | 3 | 2% | Spiked + Not Spiked |
| Spiked, Censored | 0 | 0% | Spiked |
| Spiked | 84 | . | |
| False Negatives | 0 | 0% | 0 out of 83 |
| Not Spiked | 112 | . | |
| False Positives | 0 | 0% | 0 out of 110 |
| BQS ORGANIC BLIND SAMPLES |
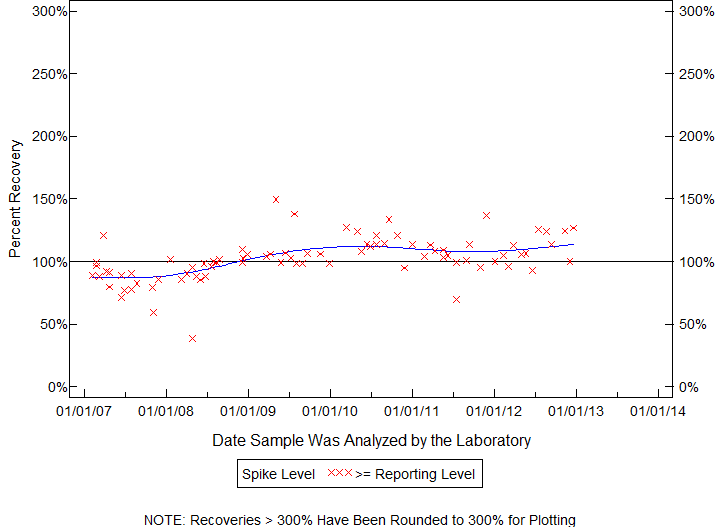
| CARBARYL, |
| Schedule: 2060 Testid: 49310LCM29 |
| Measured in MICROGRAMS PER LITER |
| 02/09/07 TO 12/21/12 |
| Open Data Set |
| Statistics for the Plotted Points |
| CARBARYL |
| Spike Level | N | Mean | Std-Dev. | Median | F_Pseudo |
|---|---|---|---|---|---|
| >= Reporting Level | 83 | 102% | 17% | 102% | 16% |
| Total | 83 | 102% | 17% | 102% | 16% |
| Miscellaneous Statistics for the Samples |
| CARBARYL |
| Characteristic | N | % | % Basis |
|---|---|---|---|
| Plotted | 83 | 100% | Spiked |
| Estimated Values | 5 | 6% | Spiked |
| Deleted Values | 3 | 2% | Spiked + Not Spiked |
| Spiked, Censored | 0 | 0% | Spiked |
| Spiked | 84 | . | |
| False Negatives | 0 | 0% | 0 out of 83 |
| Not Spiked | 112 | . | |
| False Positives | 0 | 0% | 0 out of 110 |
| BQS ORGANIC BLIND SAMPLES |
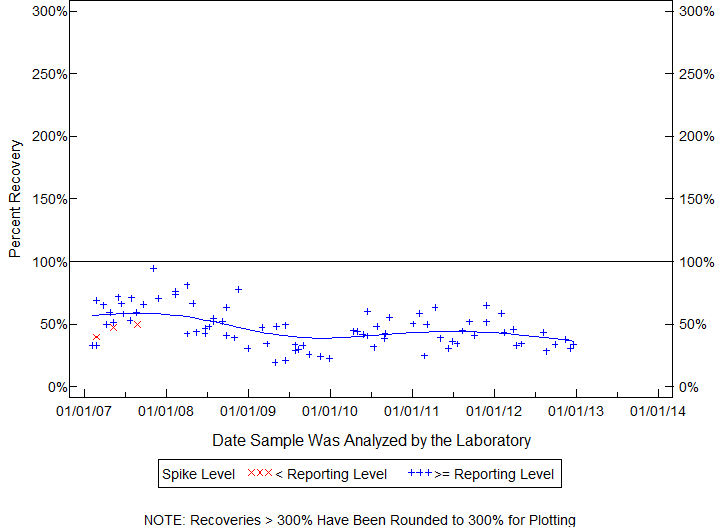
| BROMOXYNIL |
| Permanently Estimated Compound |
| Schedule: 2060 Testid: 49311LCM29 |
| 02/09/07 TO 12/21/12 |
| Open Data Set |
| Statistics for the Plotted Points |
| BROMOXYNIL |
| Spike Level | N | Mean | Std-Dev. | Median | F_Pseudo |
|---|---|---|---|---|---|
| < Reporting Level | 3 | 46% | 5% | 48% | 7% |
| >= Reporting Level | 81 | 47% | 16% | 45% | 18% |
| Total | 84 | 47% | 15% | 45% | 18% |
| Miscellaneous Statistics for the Samples |
| BROMOXYNIL |
| Characteristic | N | % | % Basis |
|---|---|---|---|
| Plotted | 84 | 100% | Spiked |
| Estimated Values | 84 | 100% | Spiked |
| Deleted Values | 1 | 1% | Spiked + Not Spiked |
| Spiked, Censored | 0 | 0% | Spiked |
| Spiked | 85 | . | |
| False Negatives | 0 | 0% | 0 out of 84 |
| Not Spiked | 111 | . | |
| False Positives | 1 | 1% | 1 out of 111 |
| BQS ORGANIC BLIND SAMPLES |
| ALDICARB |
| Permanently Estimated Compound |
| Schedule: 2060 Testid: 49312LCM29 |
| 02/09/07 TO 12/21/12 |
| Open Data Set |
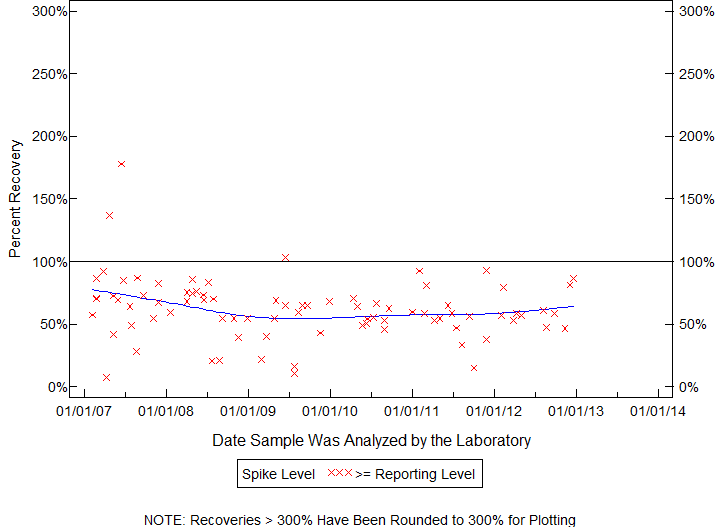
| Statistics for the Plotted Points |
| ALDICARB |
| Spike Level | N | Mean | Std-Dev. | Median | F_Pseudo |
|---|---|---|---|---|---|
| >= Reporting Level | 84 | 62% | 25% | 60% | 16% |
| Total | 84 | 62% | 25% | 60% | 16% |
| Miscellaneous Statistics for the Samples |
| ALDICARB |
| Characteristic | N | % | % Basis |
|---|---|---|---|
| Plotted | 84 | 99% | Spiked |
| Estimated Values | 76 | 89% | Spiked |
| Deleted Values | 2 | 1% | Spiked + Not Spiked |
| Spiked, Censored | 0 | 0% | Spiked |
| Spiked | 85 | . | |
| False Negatives | 1 | 1% | 1 out of 85 |
| Not Spiked | 111 | . | |
| False Positives | 0 | 0% | 0 out of 109 |
| BQS ORGANIC BLIND SAMPLES |
| ALDICARB SULFONE |
| Permanently Estimated Compound |
| Schedule: 2060 Testid: 49313LCM29 |
| 02/09/07 TO 12/05/12 |
| Open Data Set |
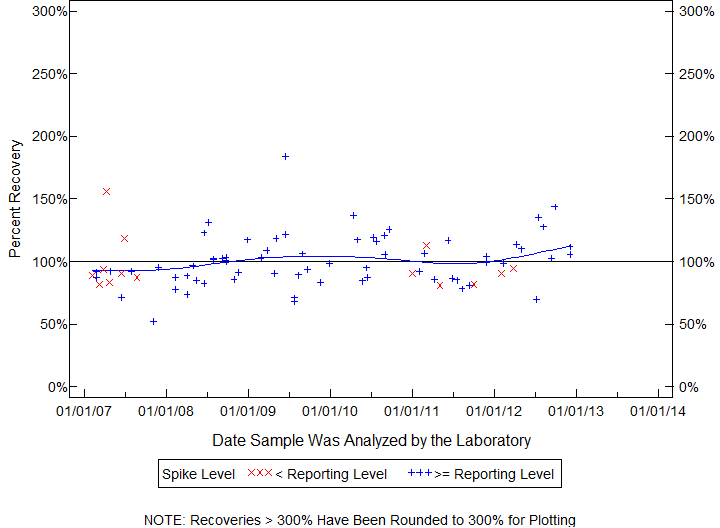
| Statistics for the Plotted Points |
| ALDICARB SULFONE |
| Spike Level | N | Mean | Std-Dev. | Median | F_Pseudo |
|---|---|---|---|---|---|
| < Reporting Level | 14 | 97% | 20% | 91% | 8% |
| >= Reporting Level | 67 | 101% | 21% | 99% | 20% |
| Total | 81 | 100% | 21% | 95% | 19% |
| Miscellaneous Statistics for the Samples |
| ALDICARB SULFONE |
| Characteristic | N | % | % Basis |
|---|---|---|---|
| Plotted | 81 | 99% | Spiked |
| Estimated Values | 12 | 15% | Spiked |
| Deleted Values | 3 | 2% | Spiked + Not Spiked |
| Spiked, Censored | 1 | 1% | Spiked |
| Spiked | 83 | . | |
| False Negatives | 0 | 0% | 0 out of 82 |
| Not Spiked | 113 | . | |
| False Positives | 9 | 8% | 9 out of 111 |
| BQS ORGANIC BLIND SAMPLES |
| ALDICARB SULFOXIDE |
| Permanently Estimated Compound |
| Schedule: 2060 Testid: 49314LCM29 |
| 02/09/07 TO 12/05/12 |
| Open Data Set |
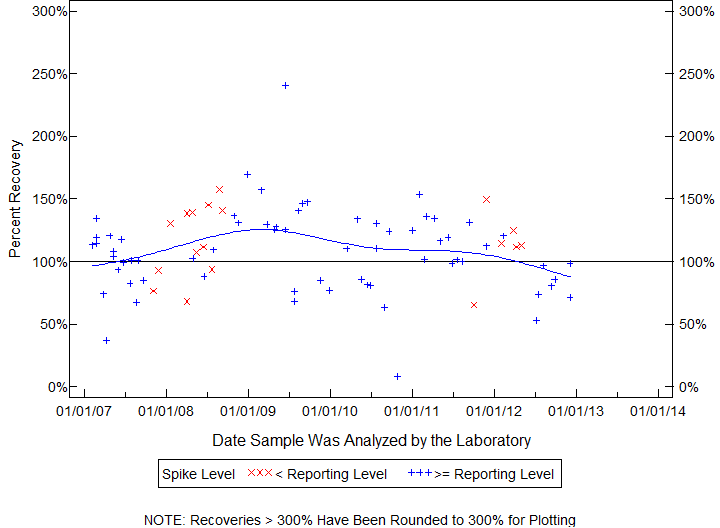
| Statistics for the Plotted Points |
| ALDICARB SULFOXIDE |
| Spike Level | N | Mean | Std-Dev. | Median | F_Pseudo |
|---|---|---|---|---|---|
| < Reporting Level | 18 | 116% | 28% | 114% | 34% |
| >= Reporting Level | 66 | 108% | 34% | 109% | 32% |
| Total | 84 | 109% | 32% | 111% | 33% |
| Miscellaneous Statistics for the Samples |
| ALDICARB SULFOXIDE |
| Characteristic | N | % | % Basis |
|---|---|---|---|
| Plotted | 84 | 99% | Spiked |
| Estimated Values | 67 | 79% | Spiked |
| Deleted Values | 3 | 2% | Spiked + Not Spiked |
| Spiked, Censored | 1 | 1% | Spiked |
| Spiked | 86 | . | |
| False Negatives | 0 | 0% | 0 out of 85 |
| Not Spiked | 77 | . | |
| False Positives | 3 | 4% | 3 out of 75 |
| BQS ORGANIC BLIND SAMPLES |
| ACIFLUORFEN, |
| Schedule: 2060 Testid: 49315LCM29 |
| Measured in MICROGRAMS PER LITER |
| 02/09/07 TO 12/21/12 |
| Open Data Set |
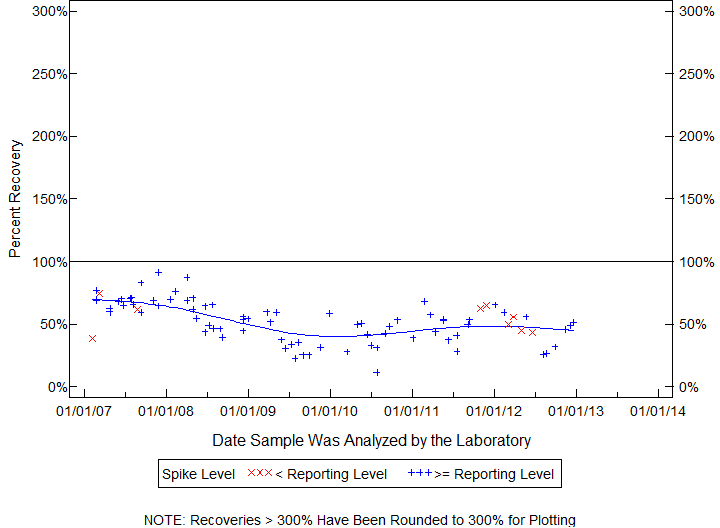
| Statistics for the Plotted Points |
| ACIFLUORFEN |
| Spike Level | N | Mean | Std-Dev. | Median | F_Pseudo |
|---|---|---|---|---|---|
| < Reporting Level | 9 | 55% | 12% | 56% | 13% |
| >= Reporting Level | 76 | 52% | 17% | 53% | 18% |
| Total | 85 | 53% | 16% | 53% | 17% |
| Miscellaneous Statistics for the Samples |
| ACIFLUORFEN |
| Characteristic | N | % | % Basis |
|---|---|---|---|
| Plotted | 85 | 99% | Spiked |
| Estimated Values | 42 | 49% | Spiked |
| Deleted Values | 1 | 1% | Spiked + Not Spiked |
| Spiked, Censored | 0 | 0% | Spiked |
| Spiked | 86 | . | |
| False Negatives | 1 | 1% | 1 out of 86 |
| Not Spiked | 110 | . | |
| False Positives | 0 | 0% | 0 out of 109 |
| BQS ORGANIC BLIND SAMPLES |
| BENDIOCARB, |
| Schedule: 2060 Testid: 50299LCM29 |
| Measured in MICROGRAMS PER LITER |
| 02/09/07 TO 12/21/12 |
| Open Data Set |
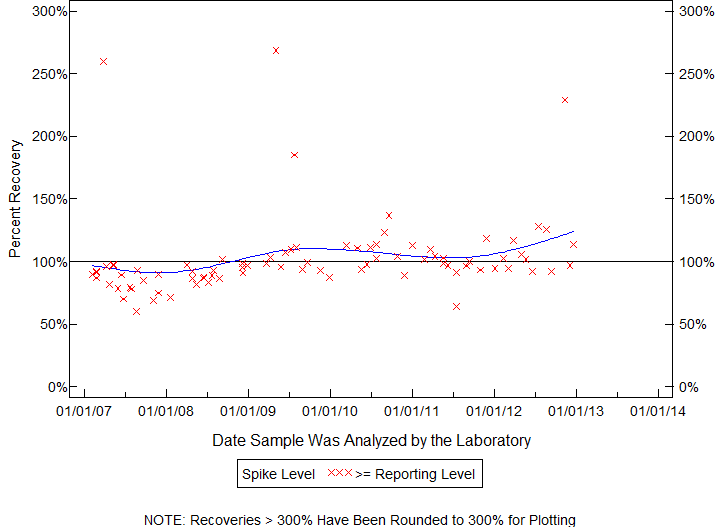
| Statistics for the Plotted Points |
| BENDIOCARB |
| Spike Level | N | Mean | Std-Dev. | Median | F_Pseudo |
|---|---|---|---|---|---|
| >= Reporting Level | 85 | 103% | 33% | 97% | 11% |
| Total | 85 | 103% | 33% | 97% | 11% |
| Miscellaneous Statistics for the Samples |
| BENDIOCARB |
| Characteristic | N | % | % Basis |
|---|---|---|---|
| Plotted | 85 | 99% | Spiked |
| Estimated Values | 46 | 53% | Spiked |
| Deleted Values | 3 | 2% | Spiked + Not Spiked |
| Spiked, Censored | 0 | 0% | Spiked |
| Spiked | 87 | . | |
| False Negatives | 1 | 1% | 1 out of 86 |
| Not Spiked | 109 | . | |
| False Positives | 4 | 4% | 4 out of 107 |
| BQS ORGANIC BLIND SAMPLES |
| BENOMYL |
| Permanently Estimated Compound |
| Schedule: 2060 Testid: 50300LCM29 |
| 02/09/07 TO 12/05/12 |
| Open Data Set |
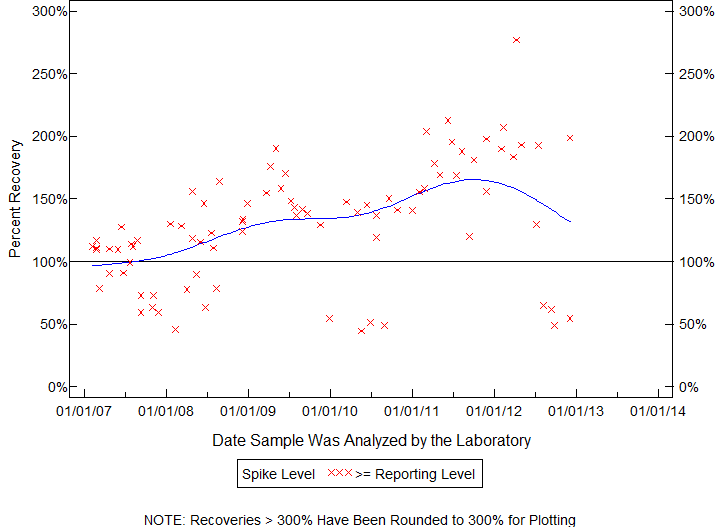
| Statistics for the Plotted Points |
| BENOMYL |
| Spike Level | N | Mean | Std-Dev. | Median | F_Pseudo |
|---|---|---|---|---|---|
| >= Reporting Level | 85 | 130% | 48% | 130% | 44% |
| Total | 85 | 130% | 48% | 130% | 44% |
| Miscellaneous Statistics for the Samples |
| BENOMYL |
| Characteristic | N | % | % Basis |
|---|---|---|---|
| Plotted | 85 | 100% | Spiked |
| Estimated Values | 63 | 74% | Spiked |
| Deleted Values | 0 | 0% | Spiked + Not Spiked |
| Spiked, Censored | 0 | 0% | Spiked |
| Spiked | 85 | . | |
| False Negatives | 0 | 0% | 0 out of 85 |
| Not Spiked | 111 | . | |
| False Positives | 0 | 0% | 0 out of 111 |
| BQS ORGANIC BLIND SAMPLES |
| CAFFEINE, |
| Schedule: 2060 Testid: 50305LCM29 |
| Measured in MICROGRAMS PER LITER |
| 02/09/07 TO 12/21/12 |
| Open Data Set |
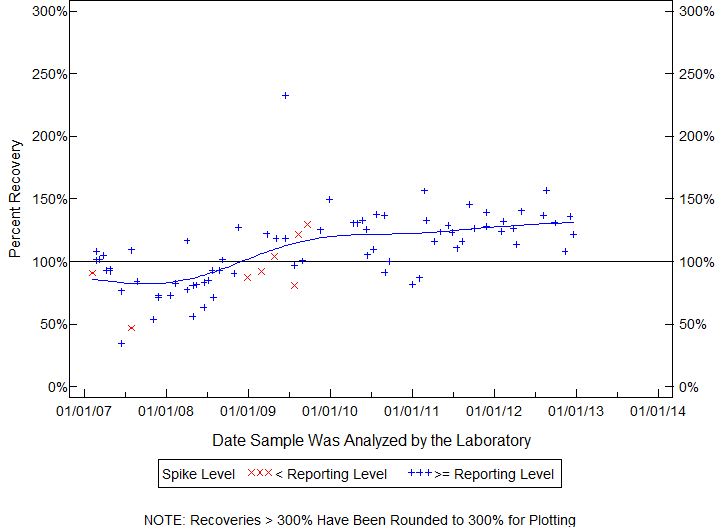
| Statistics for the Plotted Points |
| CAFFEINE |
| Spike Level | N | Mean | Std-Dev. | Median | F_Pseudo |
|---|---|---|---|---|---|
| < Reporting Level | 8 | 94% | 25% | 92% | 21% |
| >= Reporting Level | 73 | 109% | 30% | 110% | 28% |
| Total | 81 | 108% | 29% | 108% | 29% |
| Miscellaneous Statistics for the Samples |
| CAFFEINE |
| Characteristic | N | % | % Basis |
|---|---|---|---|
| Plotted | 81 | 100% | Spiked |
| Estimated Values | 14 | 17% | Spiked |
| Deleted Values | 1 | 1% | Spiked + Not Spiked |
| Spiked, Censored | 0 | 0% | Spiked |
| Spiked | 82 | . | |
| False Negatives | 0 | 0% | 0 out of 81 |
| Not Spiked | 114 | . | |
| False Positives | 1 | 1% | 1 out of 114 |
| BQS ORGANIC BLIND SAMPLES |
| CHLORIMURON ETHYL |
| Permanently Estimated Compound |
| Schedule: 2060 Testid: 50306LCM29 |
| 02/09/07 TO 12/21/12 |
| Open Data Set |
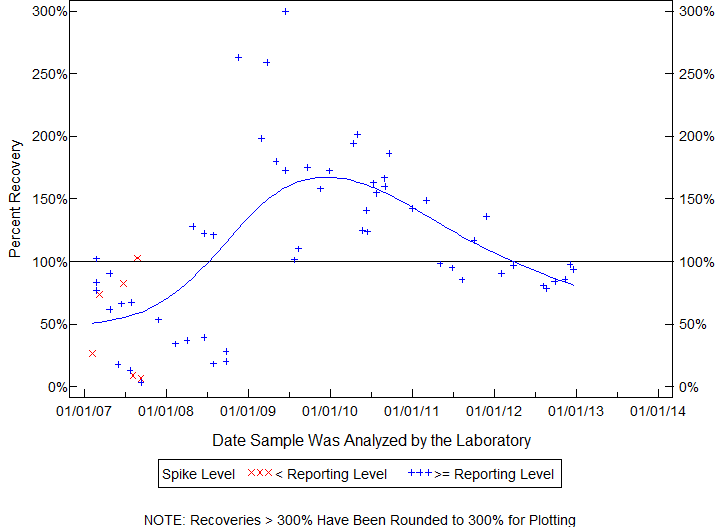
| Statistics for the Plotted Points |
| CHLORIMURON ETHYL |
| Spike Level | N | Mean | Std-Dev. | Median | F_Pseudo |
|---|---|---|---|---|---|
| < Reporting Level | 6 | 50% | 41% | 50% | 54% |
| >= Reporting Level | 56 | 115% | 65% | 102% | 60% |
| Total | 62 | 109% | 65% | 98% | 65% |
| Miscellaneous Statistics for the Samples |
| CHLORIMURON ETHYL |
| Characteristic | N | % | % Basis |
|---|---|---|---|
| Plotted | 62 | 100% | Spiked |
| Estimated Values | 62 | 100% | Spiked |
| Deleted Values | 0 | 0% | Spiked + Not Spiked |
| Spiked, Censored | 0 | 0% | Spiked |
| Spiked | 62 | . | |
| False Negatives | 0 | 0% | 0 out of 62 |
| Not Spiked | 112 | . | |
| False Positives | 0 | 0% | 0 out of 112 |
| BQS ORGANIC BLIND SAMPLES |
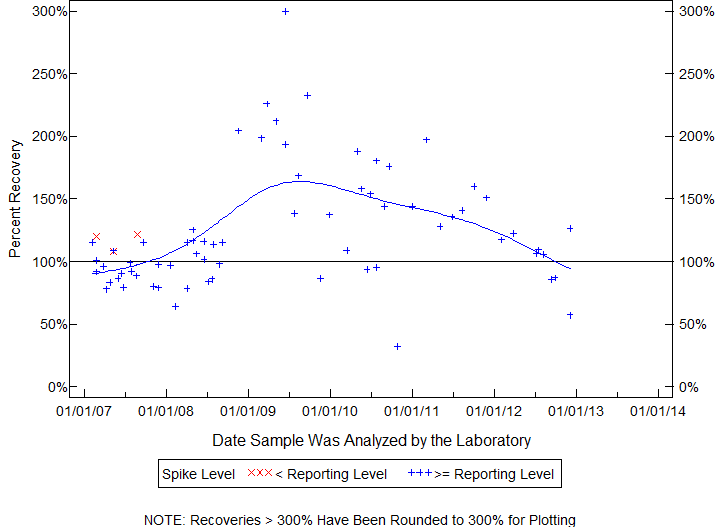
| SULFOMETURON METHYL, |
| Schedule: 2060 Testid: 50337LCM29 |
| Measured in MICROGRAMS PER LITER |
| 02/09/07 TO 12/05/12 |
| Open Data Set |
| Statistics for the Plotted Points |
| SULFOMETURON METHYL |
| Spike Level | N | Mean | Std-Dev. | Median | F_Pseudo |
|---|---|---|---|---|---|
| < Reporting Level | 3 | 117% | 7% | 120% | 10% |
| >= Reporting Level | 68 | 124% | 47% | 112% | 39% |
| Total | 71 | 123% | 46% | 114% | 39% |
| Miscellaneous Statistics for the Samples |
| SULFOMETURON METHYL |
| Characteristic | N | % | % Basis |
|---|---|---|---|
| Plotted | 71 | 100% | Spiked |
| Estimated Values | 43 | 61% | Spiked |
| Deleted Values | 0 | 0% | Spiked + Not Spiked |
| Spiked, Censored | 0 | 0% | Spiked |
| Spiked | 71 | . | |
| False Negatives | 0 | 0% | 0 out of 71 |
| Not Spiked | 103 | . | |
| False Positives | 0 | 0% | 0 out of 103 |
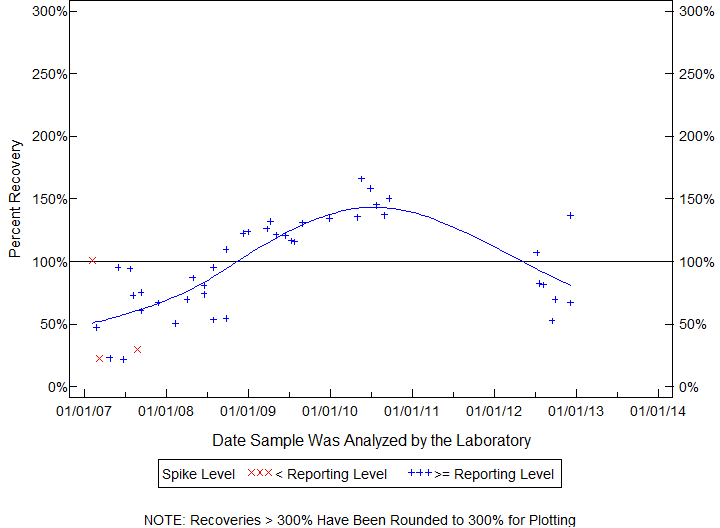
| BQS ORGANIC BLIND SAMPLES |
| 2-HYDROXYATRAZINE (2-HYDROXY-4-ISOPROPYLAMINO-6-ETHYLAMINO-S-TRIAZINE) OIET |
| Permanently Estimated Compound |
| Schedule: 2060 Testid: 50355LCM29 |
| 02/09/07 TO 12/06/12 |
| Open Data Set |
| Statistics for the Plotted Points |
| 2-HYDROXYATRAZINE (2-HYDROXY-4-ISOPROPYLAMINO-6-ETHYLAMINO-S-TRIAZINE) OIET |
| Spike Level | N | Mean | Std-Dev. | Median | F_Pseudo |
|---|---|---|---|---|---|
| < Reporting Level | 3 | 51% | 43% | 30% | 58% |
| >= Reporting Level | 41 | 97% | 37% | 95% | 42% |
| Total | 44 | 94% | 39% | 95% | 43% |
| Miscellaneous Statistics for the Samples |
| 2-HYDROXYATRAZINE (2-HYDROXY-4-ISOPROPYLAMINO-6-ETHYLAMINO-S-TRIAZINE) OIET |
| Characteristic | N | % | % Basis |
|---|---|---|---|
| Plotted | 44 | 100% | Spiked |
| Estimated Values | 9 | 20% | Spiked |
| Deleted Values | 0 | 0% | Spiked + Not Spiked |
| Spiked, Censored | 0 | 0% | Spiked |
| Spiked | 44 | . | |
| False Negatives | 0 | 0% | 0 out of 44 |
| Not Spiked | 130 | . | |
| False Positives | 36 | 28% | 36 out of 130 |
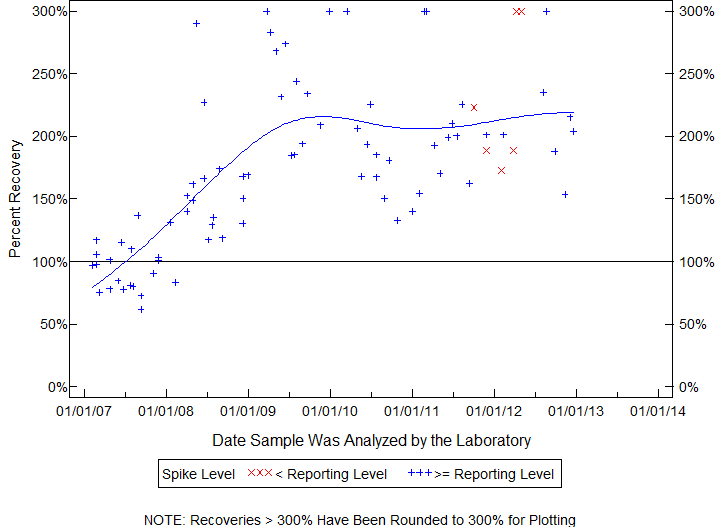
| BQS ORGANIC BLIND SAMPLES |
| IMAZAQUIN |
| Permanently Estimated Compound |
| Schedule: 2060 Testid: 50356LCM29 |
| 02/09/07 TO 12/21/12 |
| Open Data Set |
| Statistics for the Plotted Points |
| IMAZAQUIN |
| Spike Level | N | Mean | Std-Dev. | Median | F_Pseudo |
|---|---|---|---|---|---|
| < Reporting Level | 6 | 229% | 57% | 206% | 83% |
| >= Reporting Level | 78 | 171% | 65% | 168% | 68% |
| Total | 84 | 175% | 66% | 170% | 66% |
| Miscellaneous Statistics for the Samples |
| IMAZAQUIN |
| Characteristic | N | % | % Basis |
|---|---|---|---|
| Plotted | 84 | 100% | Spiked |
| Estimated Values | 84 | 100% | Spiked |
| Deleted Values | 1 | 1% | Spiked + Not Spiked |
| Spiked, Censored | 0 | 0% | Spiked |
| Spiked | 84 | . | |
| False Negatives | 0 | 0% | 0 out of 84 |
| Not Spiked | 112 | . | |
| False Positives | 0 | 0% | 0 out of 111 |
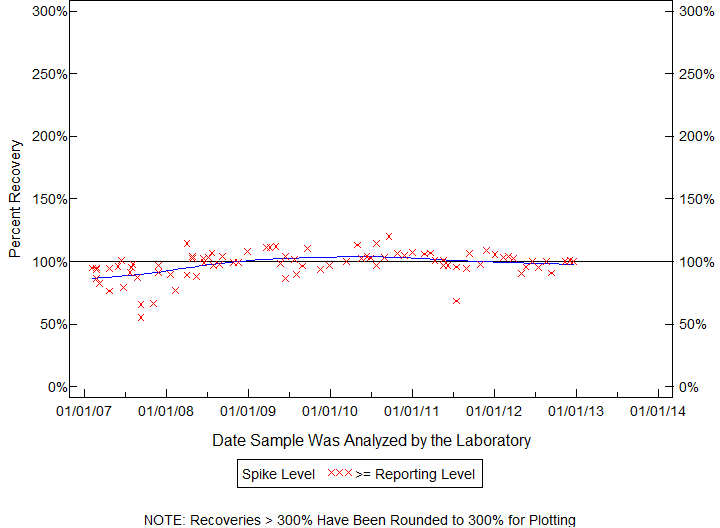
| BQS ORGANIC BLIND SAMPLES |
| METALAXYL, |
| Schedule: 2060 Testid: 50359LCM29 |
| Measured in MICROGRAMS PER LITER |
| 02/09/07 TO 12/21/12 |
| Open Data Set |
| Statistics for the Plotted Points |
| METALAXYL |
| Spike Level | N | Mean | Std-Dev. | Median | F_Pseudo |
|---|---|---|---|---|---|
| >= Reporting Level | 86 | 98% | 11% | 100% | 7% |
| Total | 86 | 98% | 11% | 100% | 7% |
| Miscellaneous Statistics for the Samples |
| METALAXYL |
| Characteristic | N | % | % Basis |
|---|---|---|---|
| Plotted | 86 | 100% | Spiked |
| Estimated Values | 6 | 7% | Spiked |
| Deleted Values | 0 | 0% | Spiked + Not Spiked |
| Spiked, Censored | 0 | 0% | Spiked |
| Spiked | 86 | . | |
| False Negatives | 0 | 0% | 0 out of 86 |
| Not Spiked | 110 | . | |
| False Positives | 0 | 0% | 0 out of 110 |
| BQS ORGANIC BLIND SAMPLES |
| NICOSULFURON |
| Permanently Estimated Compound |
| Schedule: 2060 Testid: 50364LCM29 |
| 02/27/07 TO 12/05/12 |
| Open Data Set |
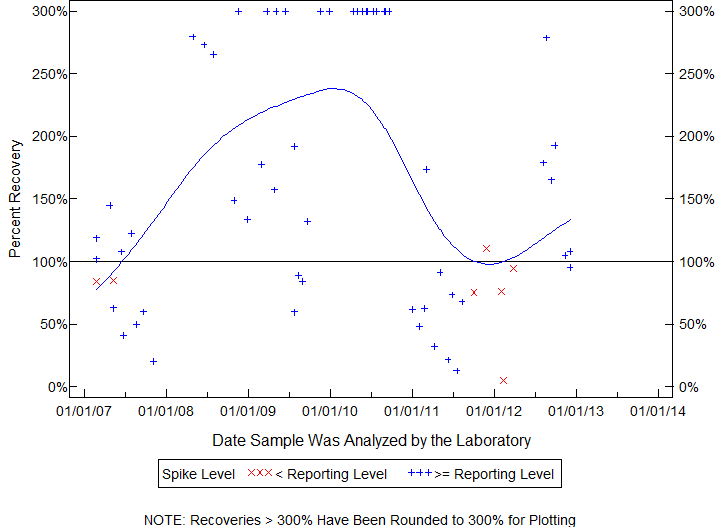
| Statistics for the Plotted Points |
| NICOSULFURON |
| Spike Level | N | Mean | Std-Dev. | Median | F_Pseudo |
|---|---|---|---|---|---|
| < Reporting Level | 7 | 76% | 33% | 84% | 14% |
| >= Reporting Level | 56 | 173% | 104% | 153% | 164% |
| Total | 63 | 162% | 103% | 132% | 167% |
| Miscellaneous Statistics for the Samples |
| NICOSULFURON |
| Characteristic | N | % | % Basis |
|---|---|---|---|
| Plotted | 63 | 80% | Spiked |
| Estimated Values | 63 | 80% | Spiked |
| Deleted Values | 1 | 1% | Spiked + Not Spiked |
| Spiked, Censored | 3 | 4% | Spiked |
| Spiked | 80 | . | |
| False Negatives | 13 | 16% | 13 out of 79 |
| Not Spiked | 116 | . | |
| False Positives | 0 | 0% | 0 out of 116 |
| BQS ORGANIC BLIND SAMPLES |
| IMAZETHAPYR |
| Permanently Estimated Compound |
| Schedule: 2060 Testid: 50407LCM29 |
| 02/09/07 TO 12/21/12 |
| Open Data Set |
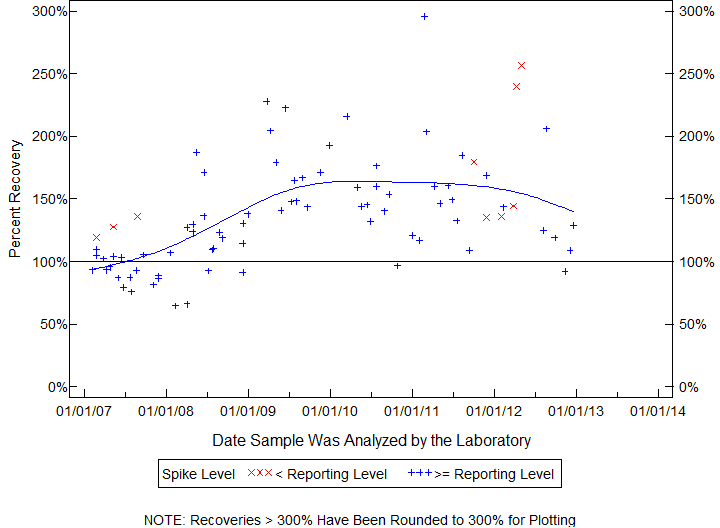
| Statistics for the Plotted Points |
| IMAZETHAPYR |
| Spike Level | N | Mean | Std-Dev. | Median | F_Pseudo |
|---|---|---|---|---|---|
| < Reporting Level | 9 | 164% | 51% | 136% | 33% |
| >= Reporting Level | 76 | 135% | 43% | 129% | 42% |
| Total | 85 | 138% | 44% | 132% | 41% |
| Miscellaneous Statistics for the Samples |
| IMAZETHAPYR |
| Characteristic | N | % | % Basis |
|---|---|---|---|
| Plotted | 85 | 100% | Spiked |
| Estimated Values | 33 | 39% | Spiked |
| Deleted Values | 0 | 0% | Spiked + Not Spiked |
| Spiked, Censored | 0 | 0% | Spiked |
| Spiked | 85 | . | |
| False Negatives | 0 | 0% | 0 out of 85 |
| Not Spiked | 111 | . | |
| False Positives | 0 | 0% | 0 out of 111 |
| BQS ORGANIC BLIND SAMPLES |
| 2,4-D METHYL ESTER, |
| Schedule: 2060 Testid: 50470LCM29 |
| Measured in MICROGRAMS PER LITER |
| 02/09/07 TO 12/05/12 |
| Open Data Set |
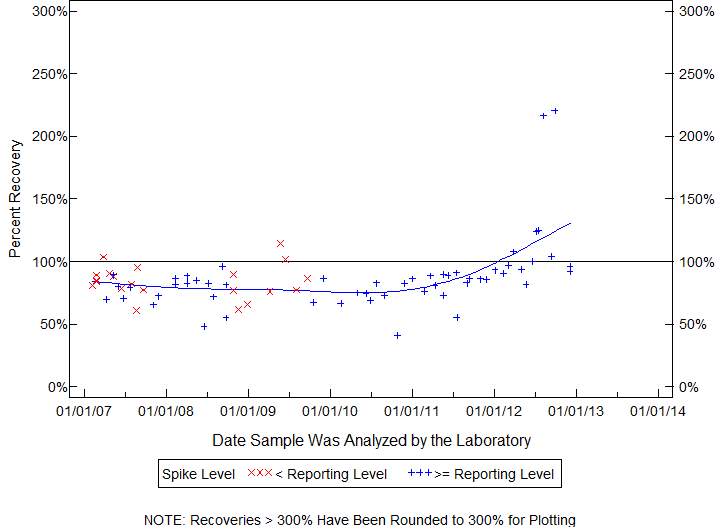
| Statistics for the Plotted Points |
| 2,4-D METHYL ESTER |
| Spike Level | N | Mean | Std-Dev. | Median | F_Pseudo |
|---|---|---|---|---|---|
| < Reporting Level | 21 | 84% | 13% | 84% | 9% |
| >= Reporting Level | 55 | 88% | 30% | 83% | 13% |
| Total | 76 | 87% | 26% | 84% | 11% |
| Miscellaneous Statistics for the Samples |
| 2,4-D METHYL ESTER |
| Characteristic | N | % | % Basis |
|---|---|---|---|
| Plotted | 76 | 97% | Spiked |
| Estimated Values | 68 | 87% | Spiked |
| Deleted Values | 0 | 0% | Spiked + Not Spiked |
| Spiked, Censored | 1 | 1% | Spiked |
| Spiked | 78 | . | |
| False Negatives | 1 | 1% | 1 out of 78 |
| Not Spiked | 118 | . | |
| False Positives | 2 | 2% | 2 out of 118 |
| BQS ORGANIC BLIND SAMPLES |
| PROPICONAZOLE (TILT), |
| Schedule: 2060 Testid: 50471LCM29 |
| Measured in MICROGRAMS PER LITER |
| 02/09/07 TO 12/21/12 |
| Open Data Set |
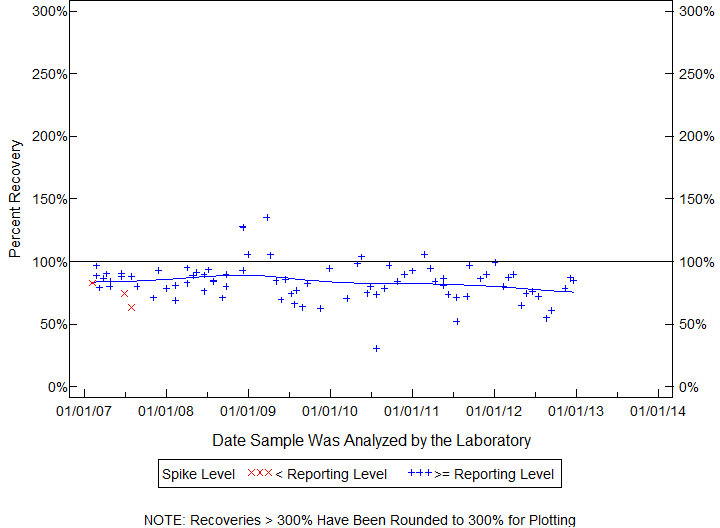
| Statistics for the Plotted Points |
| PROPICONAZOLE (TILT) |
| Spike Level | N | Mean | Std-Dev. | Median | F_Pseudo |
|---|---|---|---|---|---|
| < Reporting Level | 3 | 74% | 10% | 75% | 14% |
| >= Reporting Level | 81 | 84% | 15% | 84% | 12% |
| Total | 84 | 84% | 15% | 84% | 12% |
| Miscellaneous Statistics for the Samples |
| PROPICONAZOLE (TILT) |
| Characteristic | N | % | % Basis |
|---|---|---|---|
| Plotted | 84 | 100% | Spiked |
| Estimated Values | 14 | 17% | Spiked |
| Deleted Values | 0 | 0% | Spiked + Not Spiked |
| Spiked, Censored | 0 | 0% | Spiked |
| Spiked | 84 | . | |
| False Negatives | 0 | 0% | 0 out of 84 |
| Not Spiked | 112 | . | |
| False Positives | 0 | 0% | 0 out of 112 |
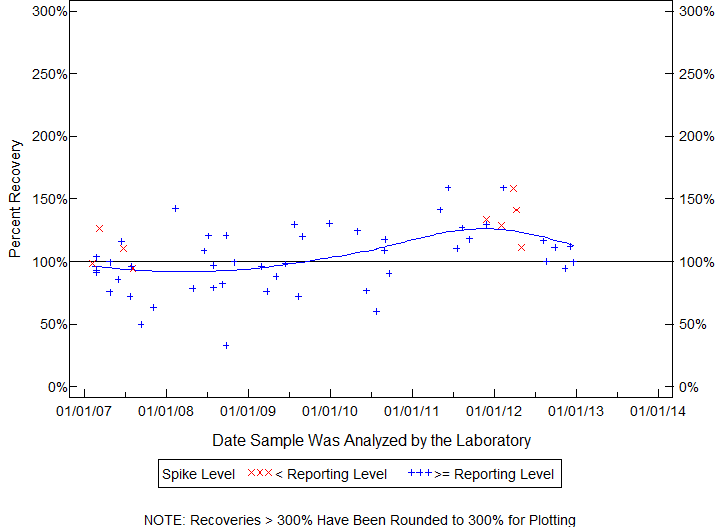
| BQS ORGANIC BLIND SAMPLES |
| CHLORAMBEN, METHYL ESTER |
| Permanently Estimated Compound |
| Schedule: 2060 Testid: 61188LCM29 |
| 02/09/07 TO 12/21/12 |
| Open Data Set |
| Statistics for the Plotted Points |
| CHLORAMBEN, METHYL ESTER |
| Spike Level | N | Mean | Std-Dev. | Median | F_Pseudo |
|---|---|---|---|---|---|
| < Reporting Level | 9 | 123% | 21% | 127% | 17% |
| >= Reporting Level | 48 | 102% | 26% | 100% | 26% |
| Total | 57 | 105% | 26% | 104% | 23% |
| Miscellaneous Statistics for the Samples |
| CHLORAMBEN, METHYL ESTER |
| Characteristic | N | % | % Basis |
|---|---|---|---|
| Plotted | 57 | 68% | Spiked |
| Estimated Values | 10 | 12% | Spiked |
| Deleted Values | 2 | 1% | Spiked + Not Spiked |
| Spiked, Censored | 4 | 5% | Spiked |
| Spiked | 84 | . | |
| False Negatives | 23 | 27% | 23 out of 84 |
| Not Spiked | 112 | . | |
| False Positives | 3 | 3% | 3 out of 110 |
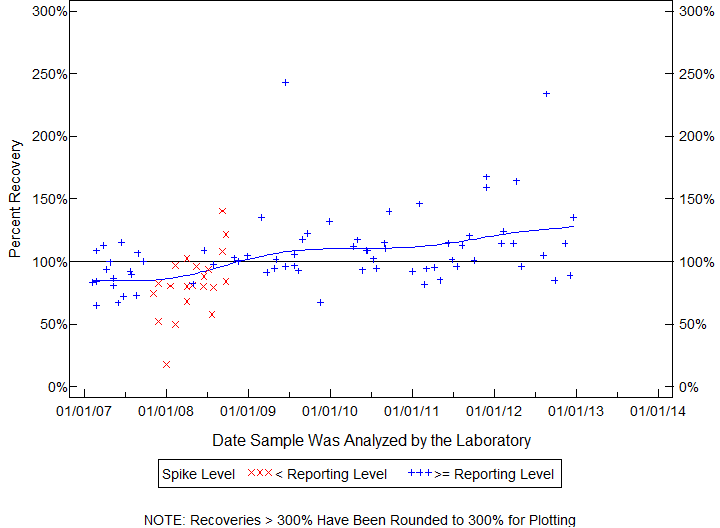
| BQS ORGANIC BLIND SAMPLES |
| 3(4-CHLOROPHENYL) METHYL UREA, |
| Schedule: 2060 Testid: 61692LCM29 |
| Measured in MICROGRAMS PER LITER |
| 02/09/07 TO 12/21/12 |
| Open Data Set |
| Statistics for the Plotted Points |
| 3(4-CHLOROPHENYL) METHYL UREA |
| Spike Level | N | Mean | Std-Dev. | Median | F_Pseudo |
|---|---|---|---|---|---|
| < Reporting Level | 21 | 83% | 26% | 81% | 16% |
| >= Reporting Level | 71 | 108% | 31% | 102% | 17% |
| Total | 92 | 102% | 31% | 97% | 21% |
| Miscellaneous Statistics for the Samples |
| 3(4-CHLOROPHENYL) METHYL UREA |
| Characteristic | N | % | % Basis |
|---|---|---|---|
| Plotted | 92 | 100% | Spiked |
| Estimated Values | 27 | 29% | Spiked |
| Deleted Values | 0 | 0% | Spiked + Not Spiked |
| Spiked, Censored | 0 | 0% | Spiked |
| Spiked | 92 | . | |
| False Negatives | 0 | 0% | 0 out of 92 |
| Not Spiked | 104 | . | |
| False Positives | 0 | 0% | 0 out of 104 |
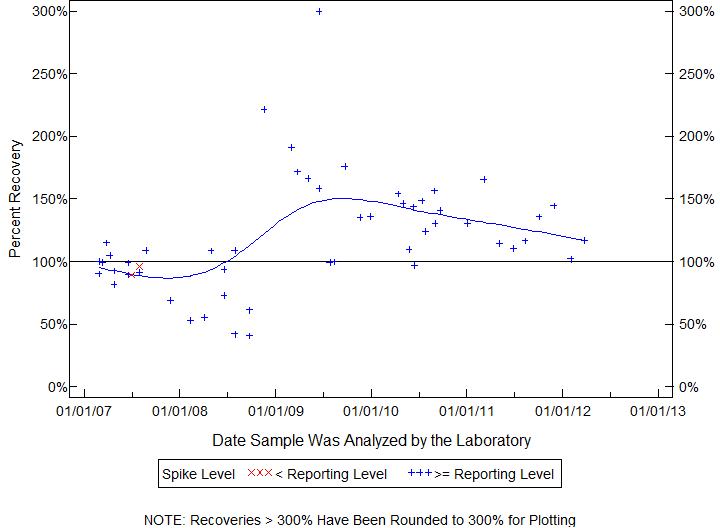
| BQS ORGANIC BLIND SAMPLES |
| BENSULFURON-METHYL, |
| Schedule: 2060 Testid: 61693LCM29 |
| Measured in MICROGRAMS PER LITER |
| 02/27/07 TO 03/26/12 |
| Open Data Set |
| Statistics for the Plotted Points |
| BENSULFURON-METHYL |
| Spike Level | N | Mean | Std-Dev. | Median | F_Pseudo |
|---|---|---|---|---|---|
| < Reporting Level | 2 | 93% | 5% | 93% | 5% |
| >= Reporting Level | 51 | 120% | 46% | 110% | 38% |
| Total | 53 | 119% | 45% | 110% | 37% |
| Miscellaneous Statistics for the Samples |
| BENSULFURON-METHYL |
| Characteristic | N | % | % Basis |
|---|---|---|---|
| Plotted | 53 | 98% | Spiked |
| Estimated Values | 31 | 57% | Spiked |
| Deleted Values | 0 | 0% | Spiked + Not Spiked |
| Spiked, Censored | 1 | 2% | Spiked |
| Spiked | 54 | . | |
| False Negatives | 0 | 0% | 0 out of 54 |
| Not Spiked | 120 | . | |
| False Positives | 0 | 0% | 0 out of 120 |
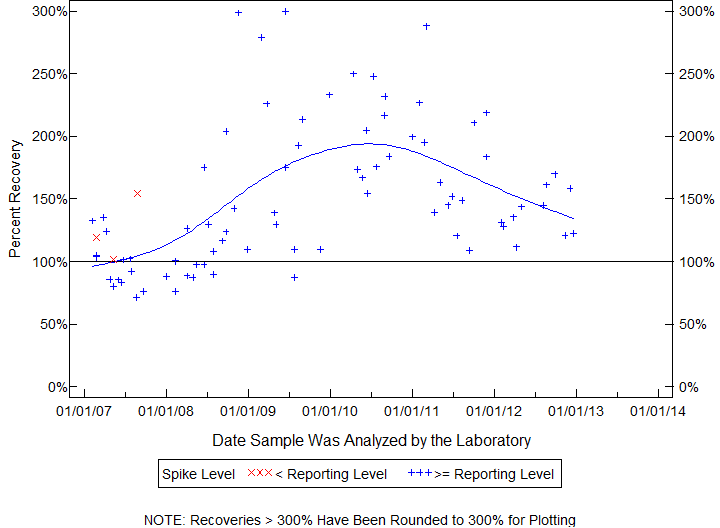
| BQS ORGANIC BLIND SAMPLES |
| FLUMETSULAM |
| Permanently Estimated Compound |
| Schedule: 2060 Testid: 61694LCM29 |
| 02/09/07 TO 12/21/12 |
| Open Data Set |
| Statistics for the Plotted Points |
| FLUMETSULAM |
| Spike Level | N | Mean | Std-Dev. | Median | F_Pseudo |
|---|---|---|---|---|---|
| < Reporting Level | 3 | 125% | 27% | 120% | 39% |
| >= Reporting Level | 79 | 150% | 57% | 136% | 59% |
| Total | 82 | 149% | 56% | 136% | 58% |
| Miscellaneous Statistics for the Samples |
| FLUMETSULAM |
| Characteristic | N | % | % Basis |
|---|---|---|---|
| Plotted | 82 | 96% | Spiked |
| Estimated Values | 69 | 81% | Spiked |
| Deleted Values | 2 | 1% | Spiked + Not Spiked |
| Spiked, Censored | 1 | 1% | Spiked |
| Spiked | 85 | . | |
| False Negatives | 2 | 2% | 2 out of 85 |
| Not Spiked | 111 | . | |
| False Positives | 0 | 0% | 0 out of 109 |
| BQS ORGANIC BLIND SAMPLES |
| IMIDACLOPRID, |
| Schedule: 2060 Testid: 61695LCM29 |
| Measured in MICROGRAMS PER LITER |
| 02/09/07 TO 12/21/12 |
| Open Data Set |
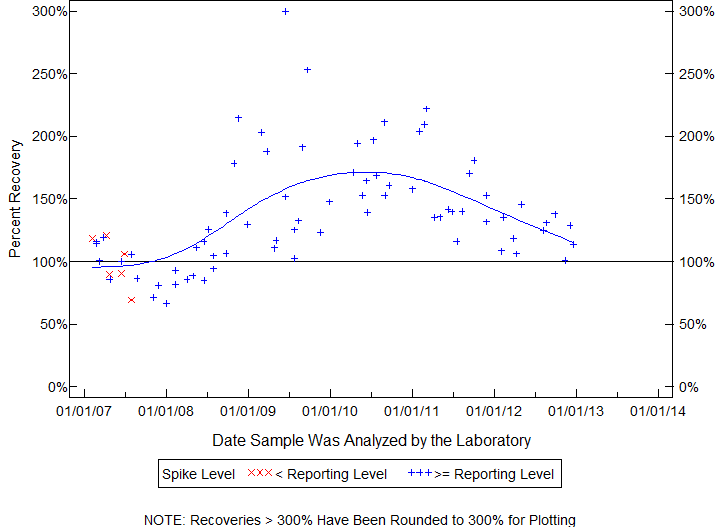
| Statistics for the Plotted Points |
| IMIDACLOPRID |
| Spike Level | N | Mean | Std-Dev. | Median | F_Pseudo |
|---|---|---|---|---|---|
| < Reporting Level | 6 | 99% | 20% | 99% | 21% |
| >= Reporting Level | 74 | 139% | 44% | 131% | 40% |
| Total | 80 | 136% | 44% | 127% | 37% |
| Miscellaneous Statistics for the Samples |
| IMIDACLOPRID |
| Characteristic | N | % | % Basis |
|---|---|---|---|
| Plotted | 80 | 98% | Spiked |
| Estimated Values | 49 | 60% | Spiked |
| Deleted Values | 0 | 0% | Spiked + Not Spiked |
| Spiked, Censored | 0 | 0% | Spiked |
| Spiked | 82 | . | |
| False Negatives | 2 | 2% | 2 out of 82 |
| Not Spiked | 114 | . | |
| False Positives | 0 | 0% | 0 out of 114 |
| BQS ORGANIC BLIND SAMPLES |
| METSULFURON METHYL |
| Permanently Estimated Compound |
| Schedule: 2060 Testid: 61697LCM29 |
| 02/09/07 TO 12/21/12 |
| Open Data Set |
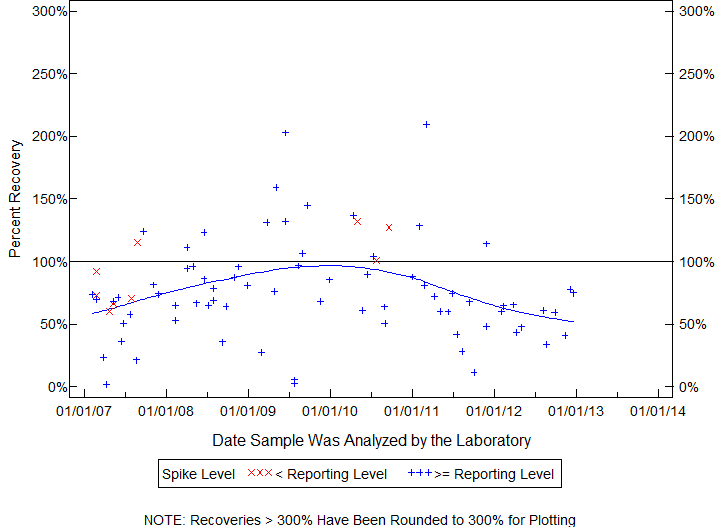
| Statistics for the Plotted Points |
| METSULFURON METHYL |
| Spike Level | N | Mean | Std-Dev. | Median | F_Pseudo |
|---|---|---|---|---|---|
| < Reporting Level | 9 | 93% | 27% | 92% | 33% |
| >= Reporting Level | 73 | 75% | 40% | 69% | 27% |
| Total | 82 | 77% | 39% | 71% | 27% |
| Miscellaneous Statistics for the Samples |
| METSULFURON METHYL |
| Characteristic | N | % | % Basis |
|---|---|---|---|
| Plotted | 82 | 99% | Spiked |
| Estimated Values | 82 | 99% | Spiked |
| Deleted Values | 2 | 1% | Spiked + Not Spiked |
| Spiked, Censored | 0 | 0% | Spiked |
| Spiked | 85 | . | |
| False Negatives | 1 | 1% | 1 out of 83 |
| Not Spiked | 111 | . | |
| False Positives | 0 | 0% | 0 out of 111 |
| BQS ORGANIC BLIND SAMPLES |
| 2,4-D + 2,4-D METHYL ESTER (SUM), |
| Schedule: 2060 Testid: 66496CAL13 |
| Measured in MICROGRAMS PER LITER |
| 11/28/07 TO 06/20/12 |
| Open Data Set |
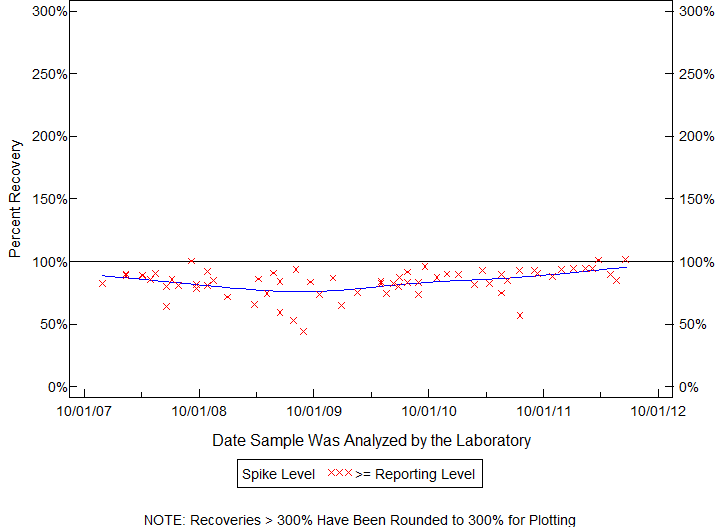
| Statistics for the Plotted Points |
| 2,4-D + 2,4-D METHYL ESTER (SUM) |
| Spike Level | N | Mean | Std-Dev. | Median | F_Pseudo |
|---|---|---|---|---|---|
| >= Reporting Level | 66 | 84% | 11% | 85% | 8% |
| Total | 66 | 84% | 11% | 85% | 8% |
| Miscellaneous Statistics for the Samples |
| 2,4-D + 2,4-D METHYL ESTER (SUM) |
| Characteristic | N | % | % Basis |
|---|---|---|---|
| Plotted | 66 | 99% | Spiked |
| Estimated Values | 27 | 40% | Spiked |
| Deleted Values | 0 | 0% | Spiked + Not Spiked |
| Spiked, Censored | 0 | 0% | Spiked |
| Spiked | 67 | . | |
| False Negatives | 1 | 1% | 1 out of 67 |
| Not Spiked | 88 | . | |
| False Positives | 7 | 8% | 7 out of 88 |
| BQS ORGANIC BLIND SAMPLES |
| TEBUTHIURON, |
| Schedule: 2060 Testid: 82670LCM29 |
| Measured in MICROGRAMS PER LITER |
| 02/09/07 TO 12/05/12 |
| Open Data Set |
