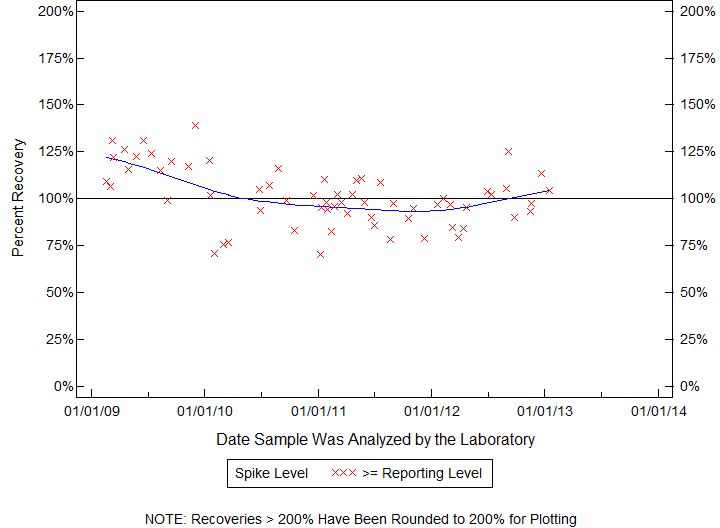
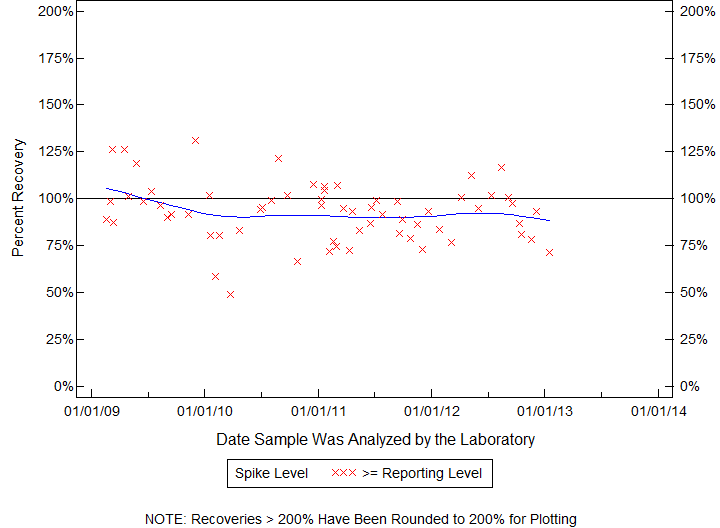
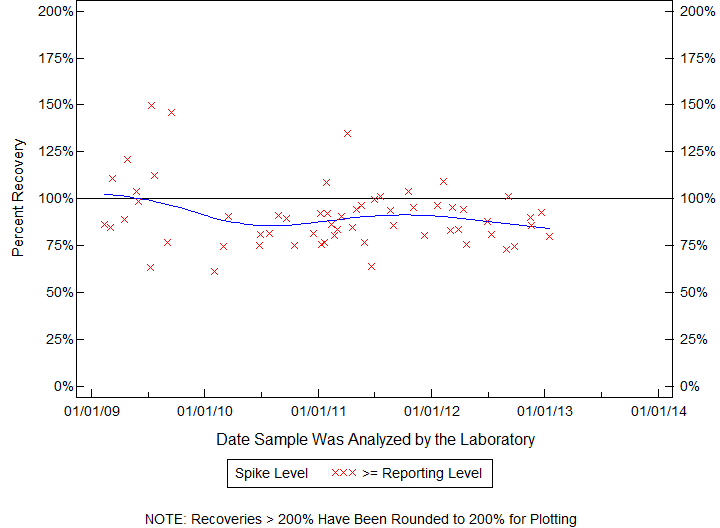
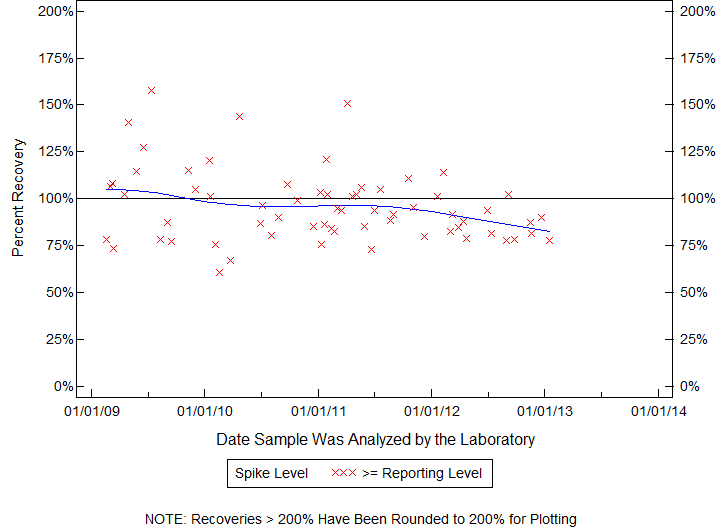
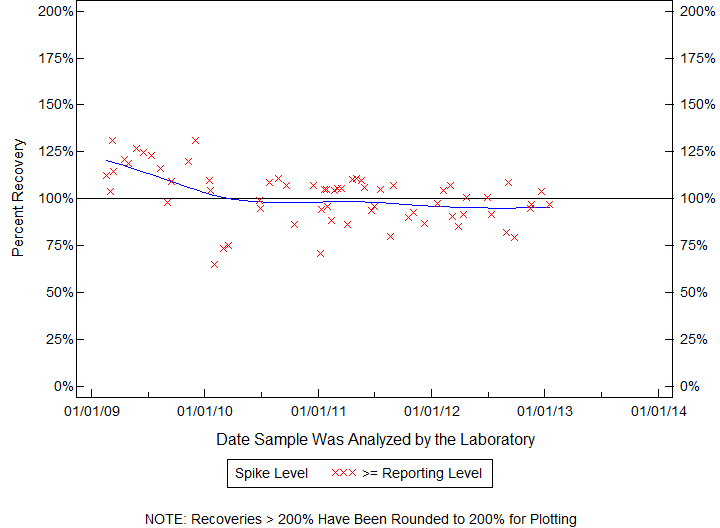
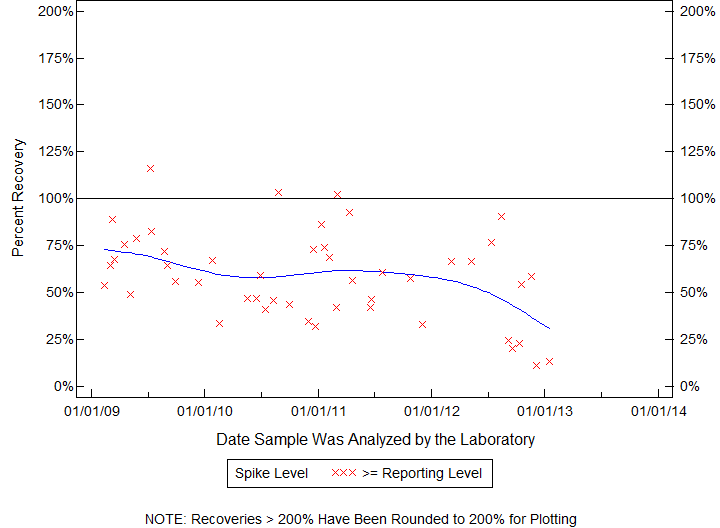
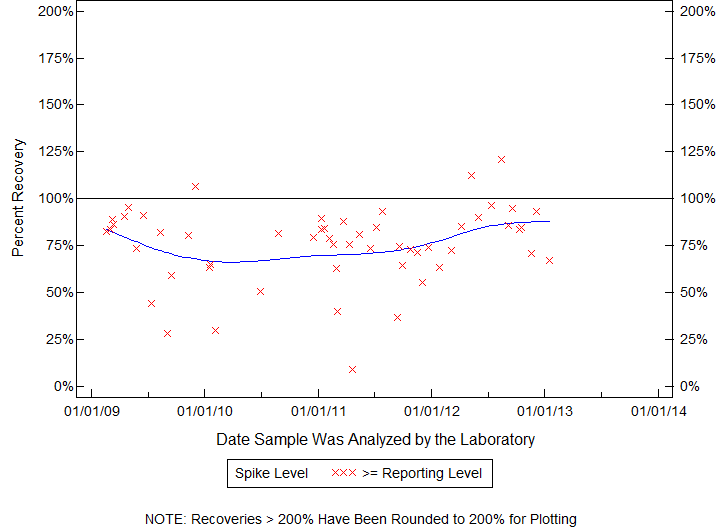
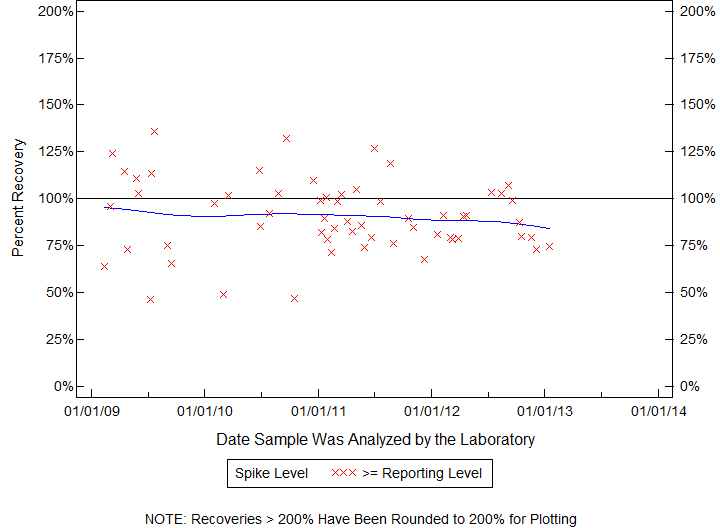
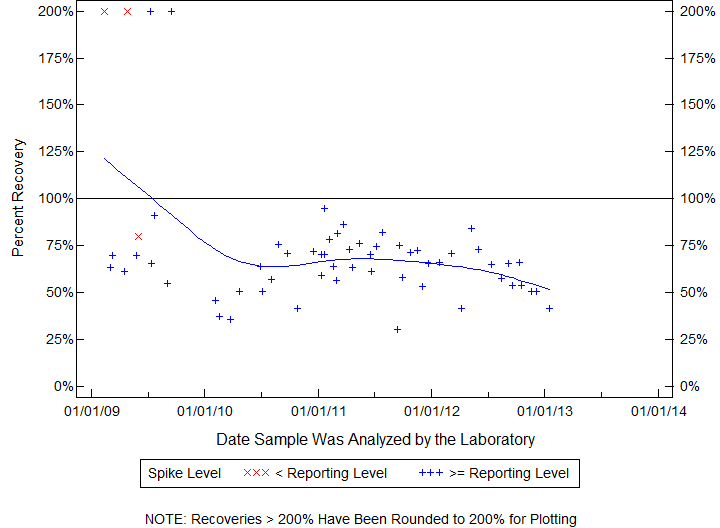
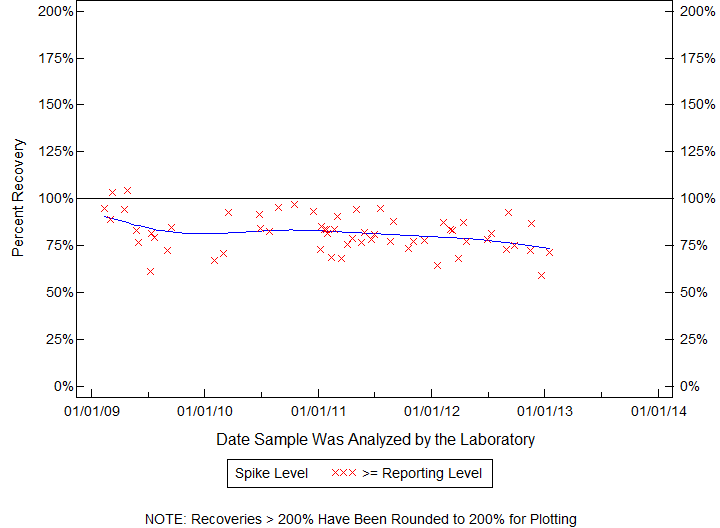
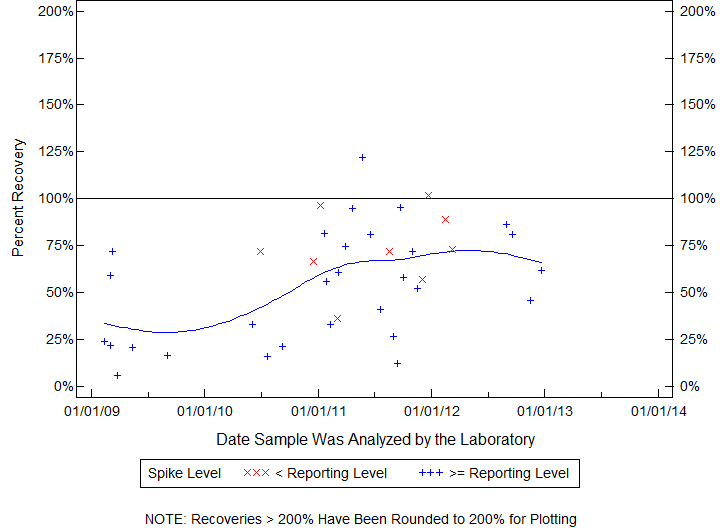
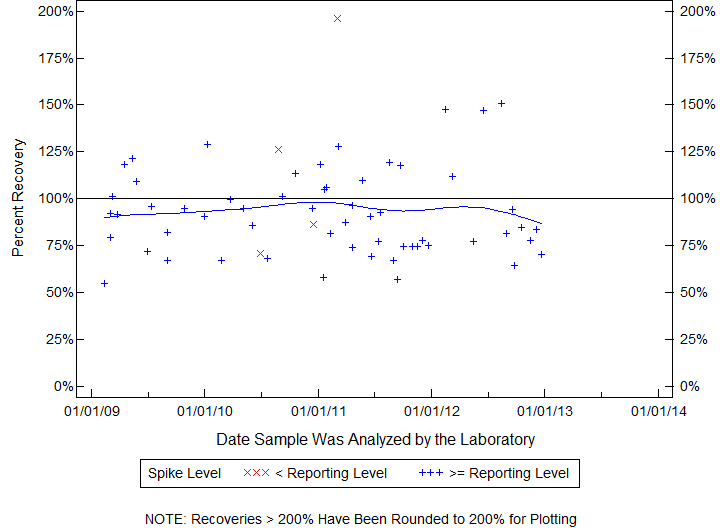
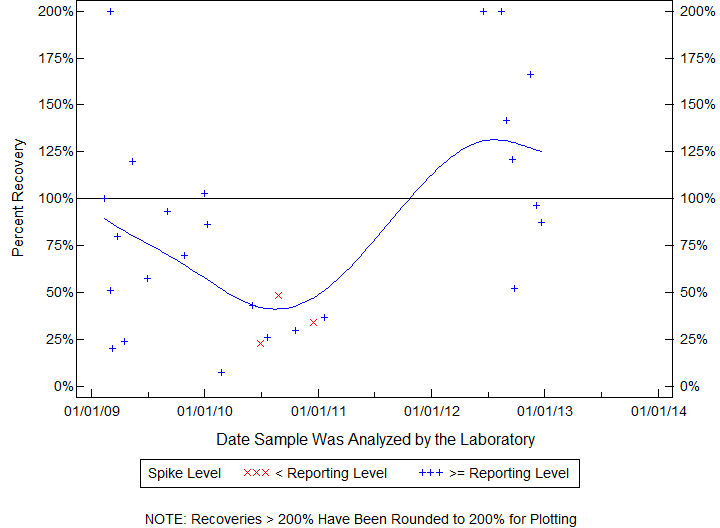
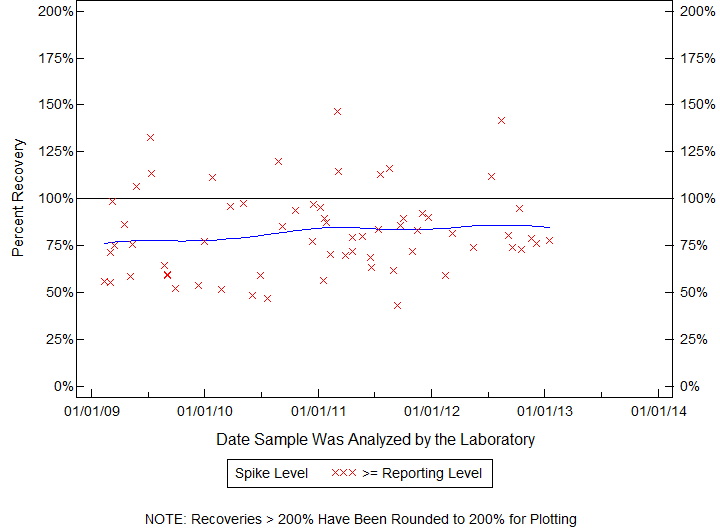
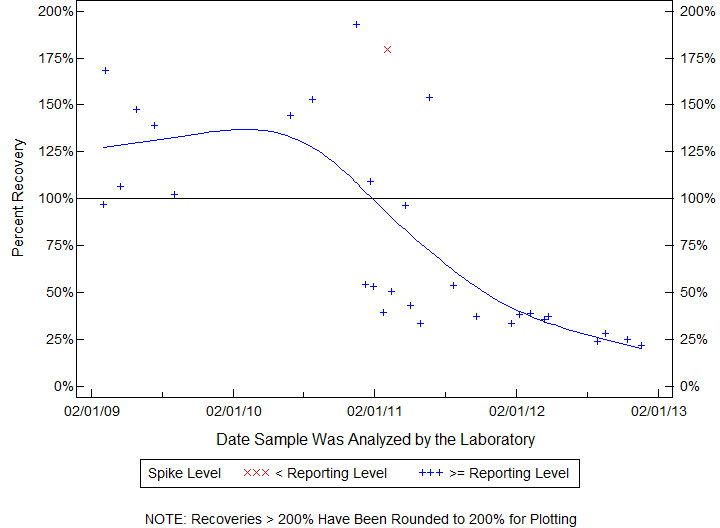
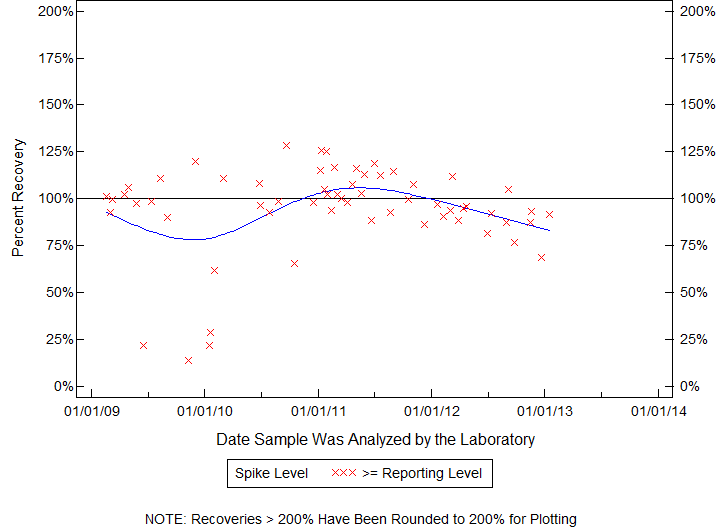
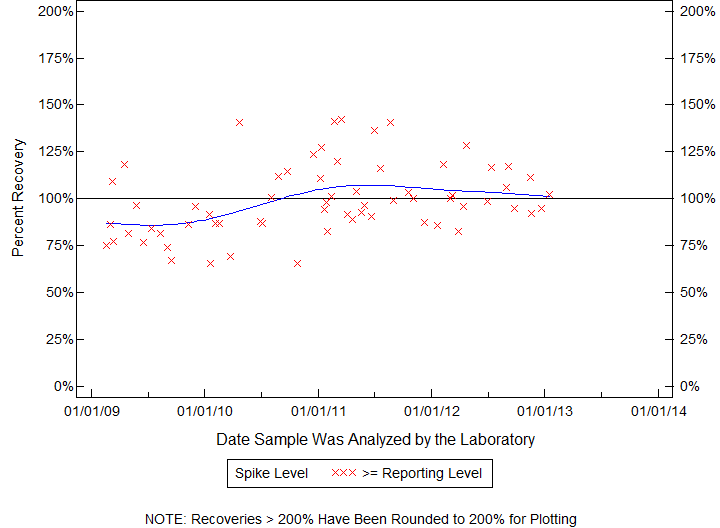
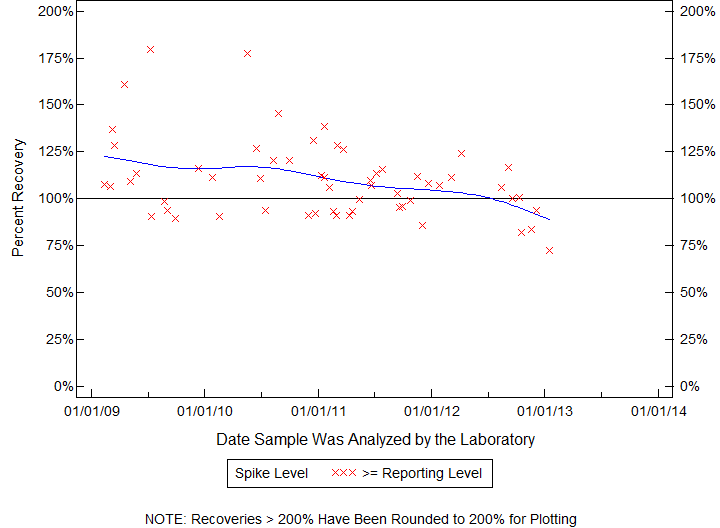
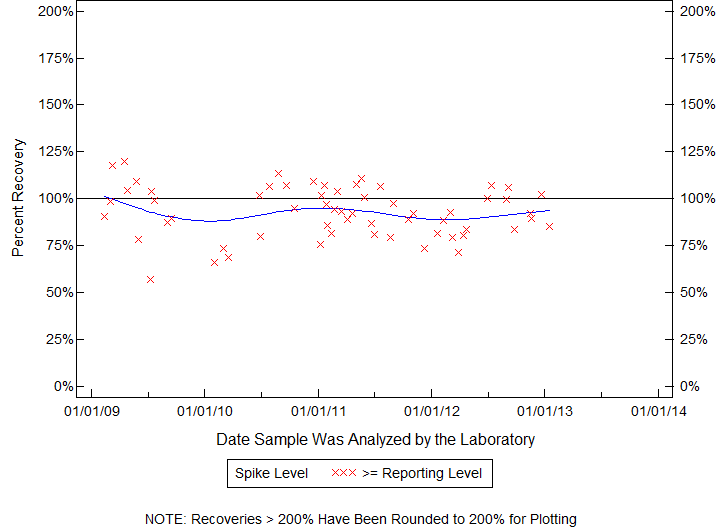
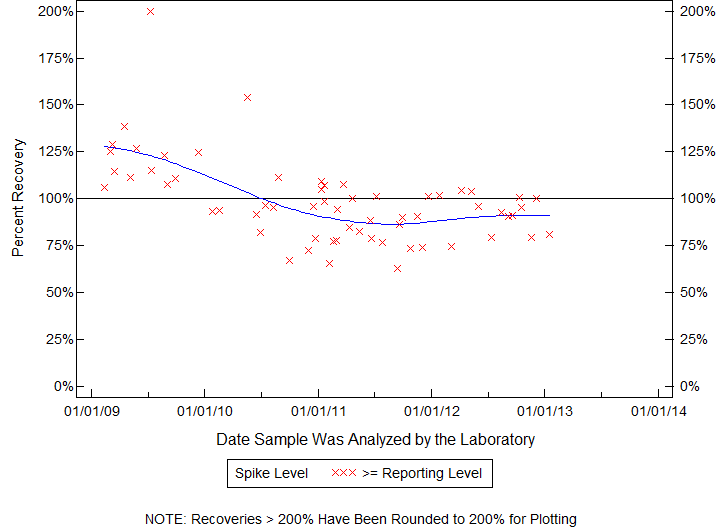
| BQS ORGANIC BLIND SAMPLES |
| TERBUTHYLAZINE, |
| Schedule: 2033 Testid: 04022GCM39 |
| Measured in MICROGRAMS PER LITER |
| 02/18/09 TO 01/15/13 |
| Open Data Set |
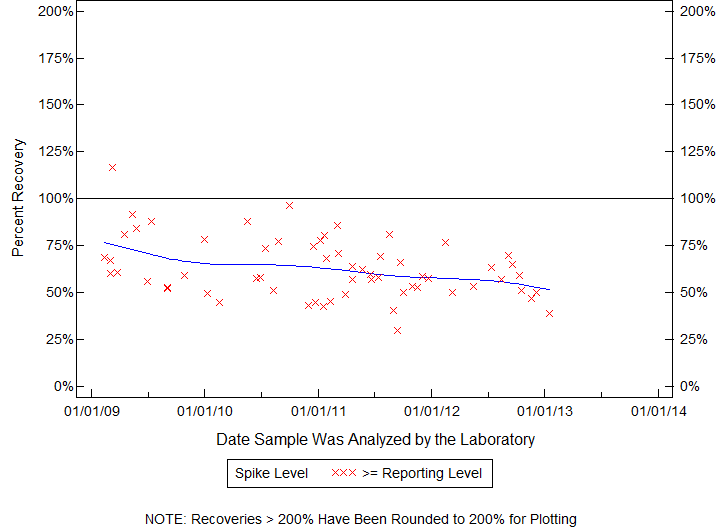
| BQS ORGANIC BLIND SAMPLES |
| TERBUTHYLAZINE, |
| Schedule: 2033 Testid: 04022GCM39 |
| Measured in MICROGRAMS PER LITER |
| 02/18/09 TO 01/15/13 |
| Open Data Set |
| Statistics for the Plotted Points |
| TERBUTHYLAZINE |
| Spike Level | N | Mean | Std-Dev. | Median | F_Pseudo |
|---|---|---|---|---|---|
| >= Reporting Level | 64 | 101% | 15% | 100% | 13% |
| Total | 64 | 101% | 15% | 100% | 13% |
| Miscellaneous Statistics for the Samples |
| TERBUTHYLAZINE |
| Characteristic | N | % | % Basis |
|---|---|---|---|
| Plotted | 64 | 100% | Spiked |
| Estimated Values | 1 | 2% | Spiked |
| Deleted Values | 0 | 0% | Spiked + Not Spiked |
| Spiked, Censored | 0 | 0% | Spiked |
| Spiked | 64 | . | |
| False Negatives | 0 | 0% | 0 out of 64 |
| Not Spiked | 100 | . | |
| False Positives | 1 | 1% | 1 out of 100 |
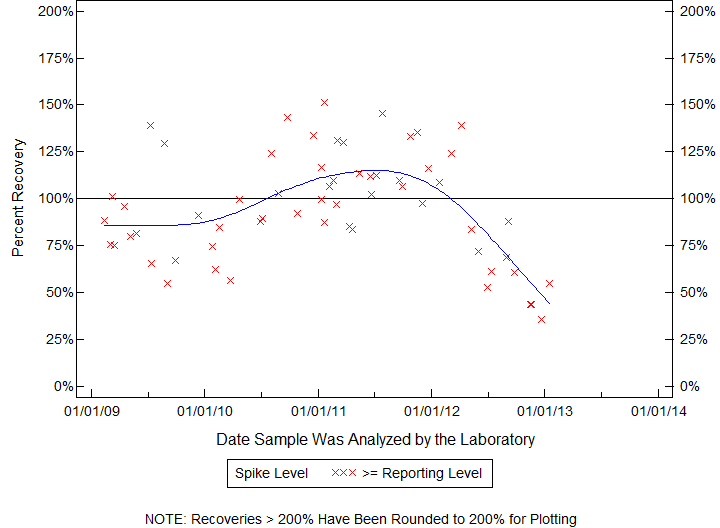
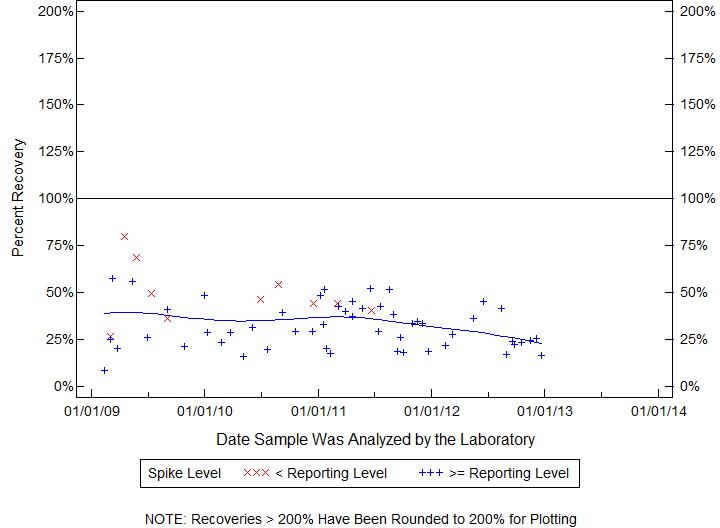
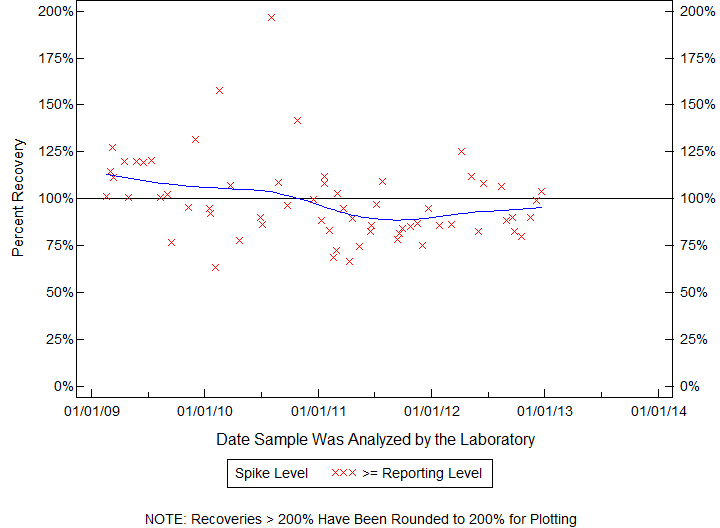
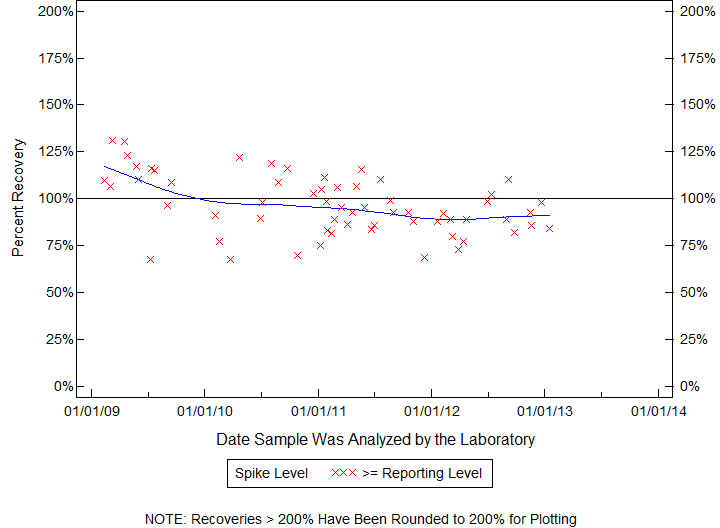
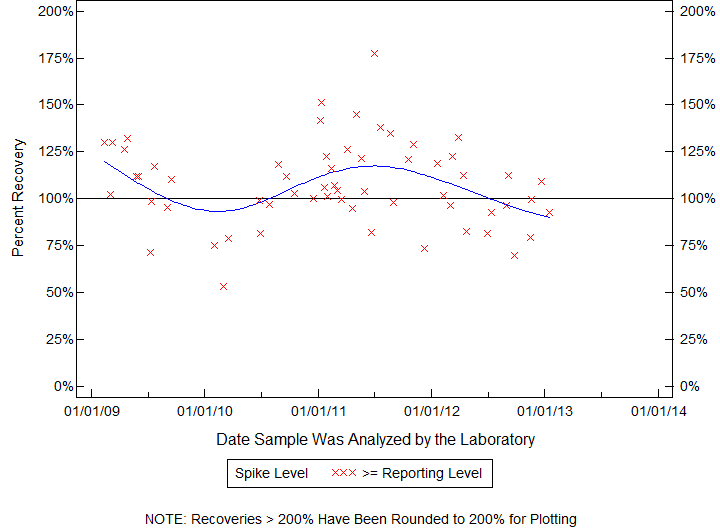
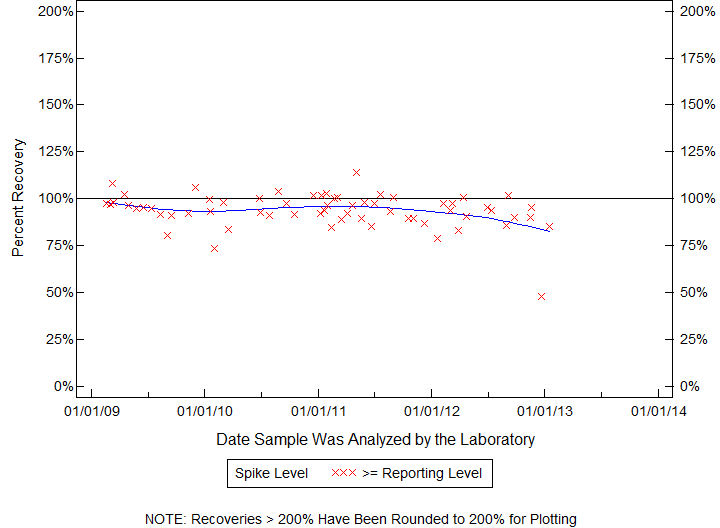
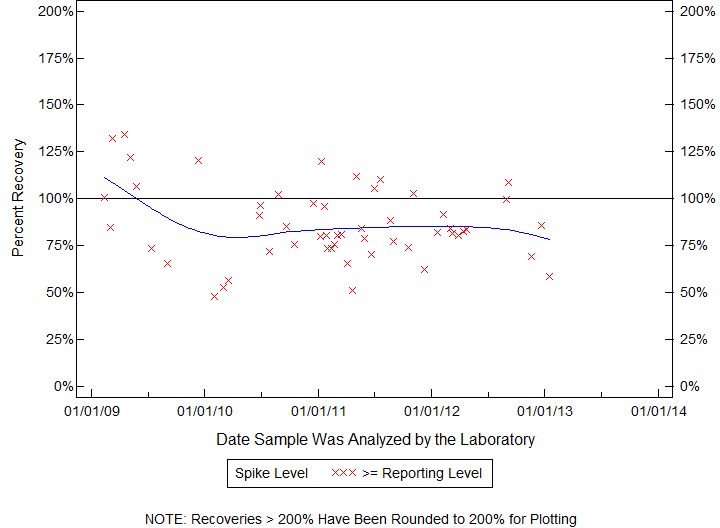
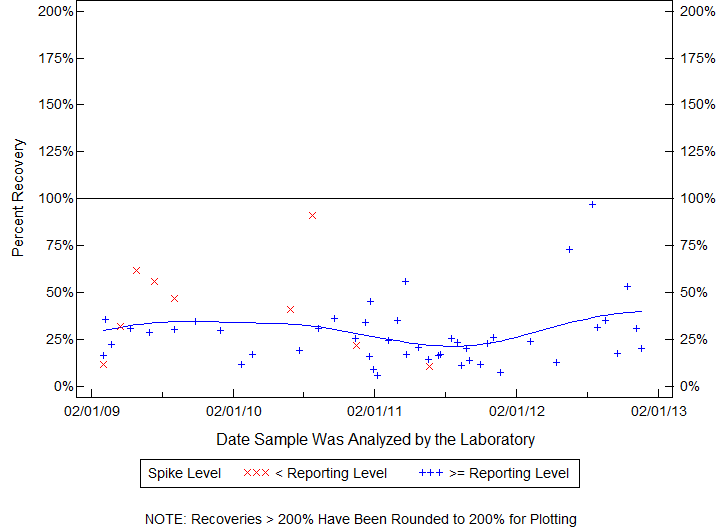
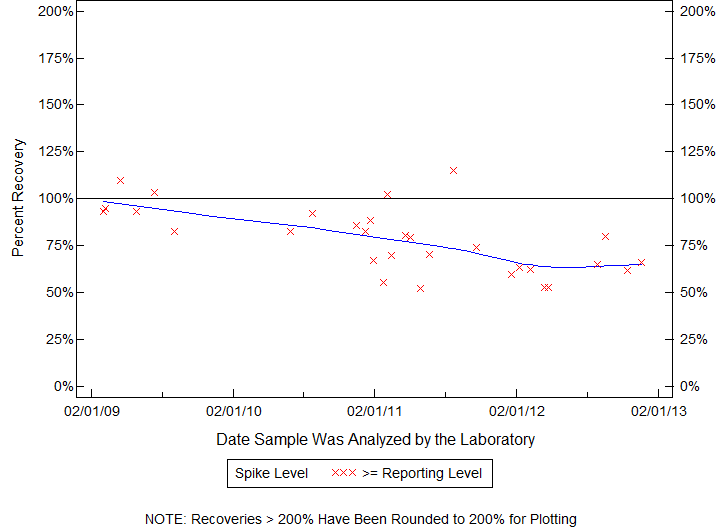
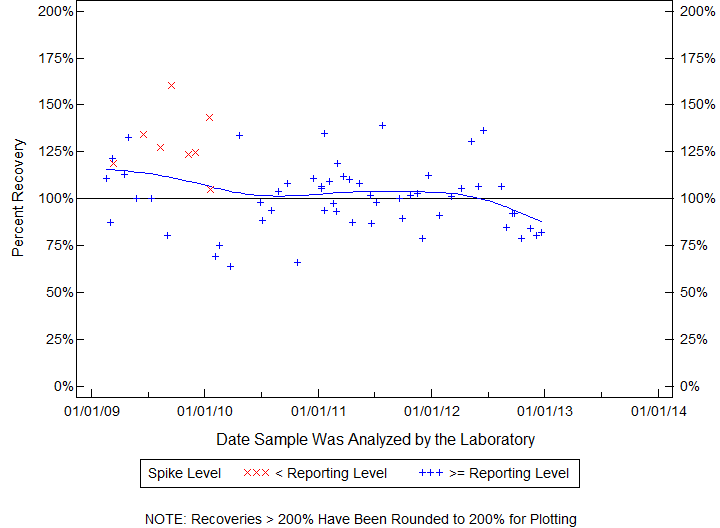
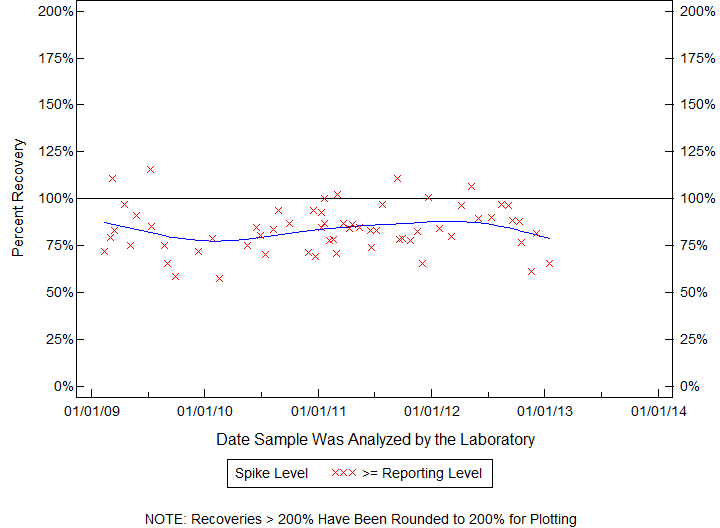
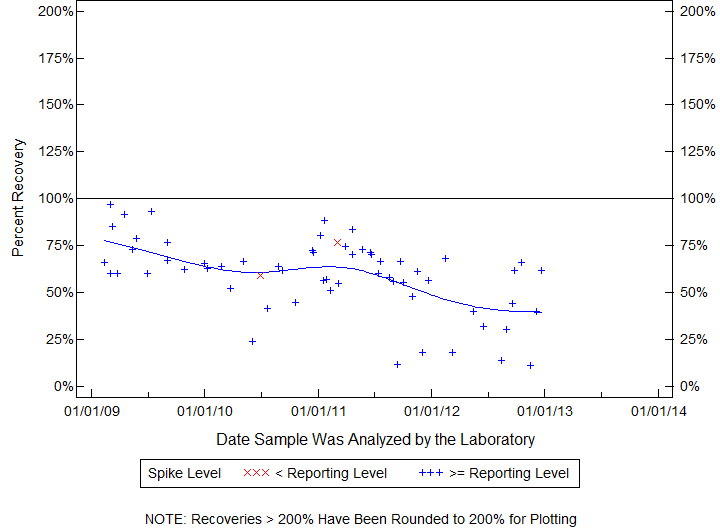
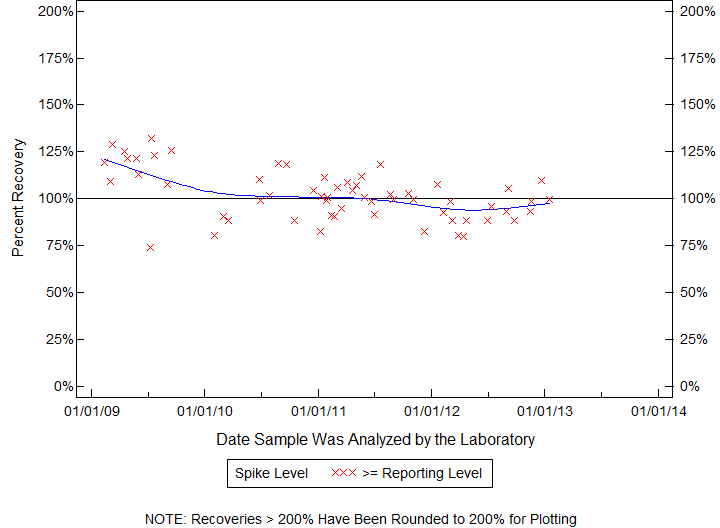
| BQS ORGANIC BLIND SAMPLES |
| HEXAZINONE, |
| Schedule: 2033 Testid: 04025GCM39 |
| Measured in MICROGRAMS PER LITER |
| 02/18/09 TO 01/15/13 |
| Open Data Set |
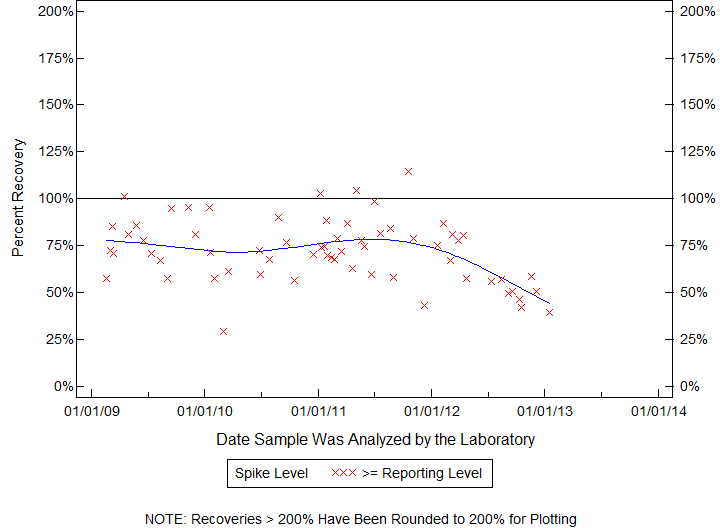
| Statistics for the Plotted Points |
| HEXAZINONE |
| Spike Level | N | Mean | Std-Dev. | Median | F_Pseudo |
|---|---|---|---|---|---|
| >= Reporting Level | 64 | 72% | 17% | 72% | 17% |
| Total | 64 | 72% | 17% | 72% | 17% |
| Miscellaneous Statistics for the Samples |
| HEXAZINONE |
| Characteristic | N | % | % Basis |
|---|---|---|---|
| Plotted | 64 | 98% | Spiked |
| Estimated Values | 6 | 9% | Spiked |
| Deleted Values | 0 | 0% | Spiked + Not Spiked |
| Spiked, Censored | 0 | 0% | Spiked |
| Spiked | 65 | . | |
| False Negatives | 1 | 2% | 1 out of 65 |
| Not Spiked | 99 | . | |
| False Positives | 0 | 0% | 0 out of 99 |
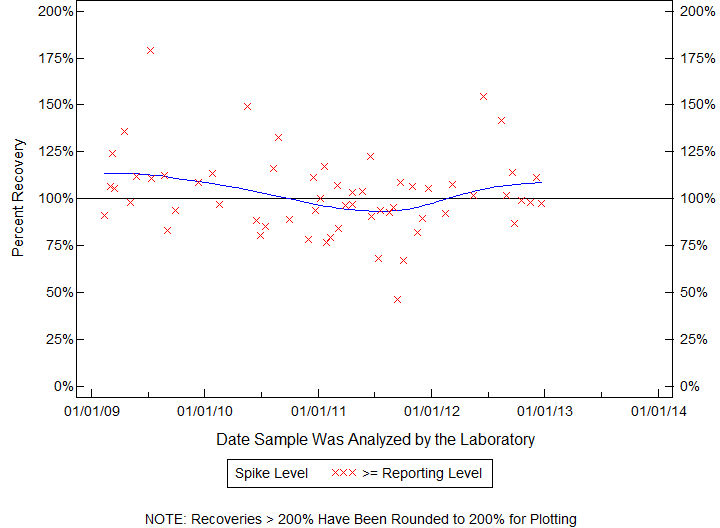
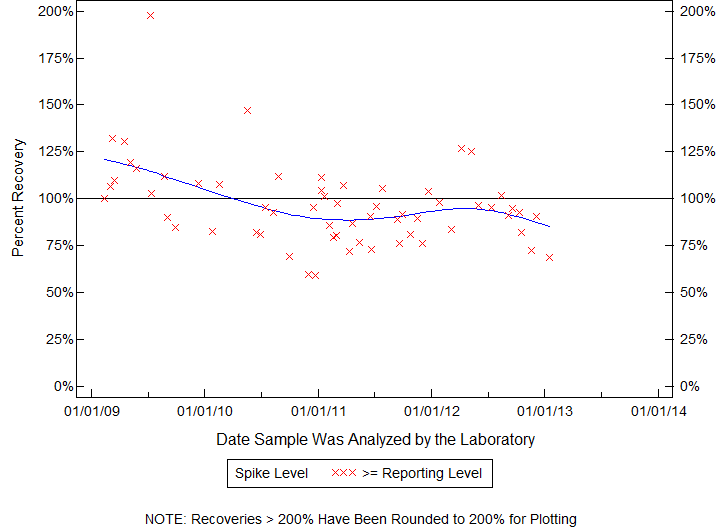
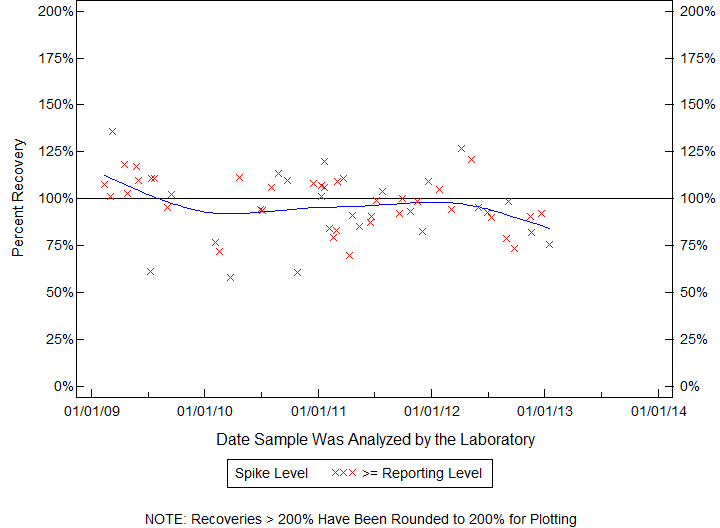
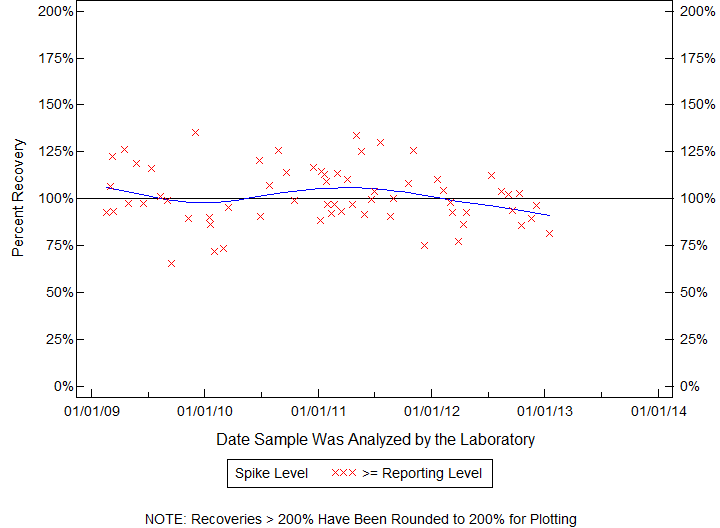
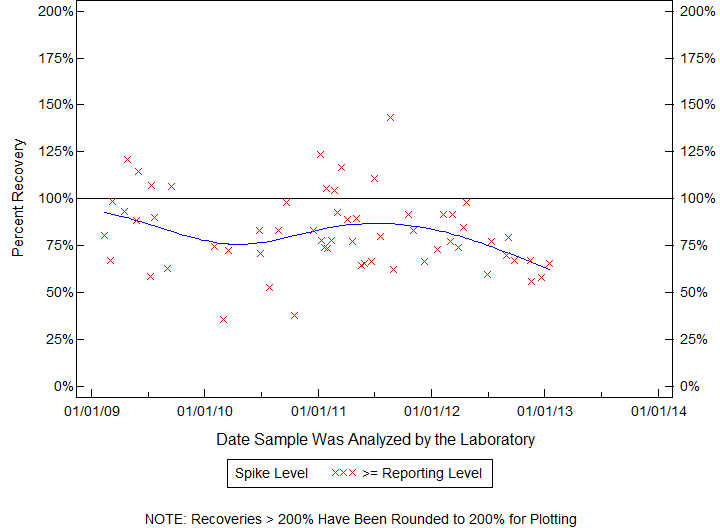
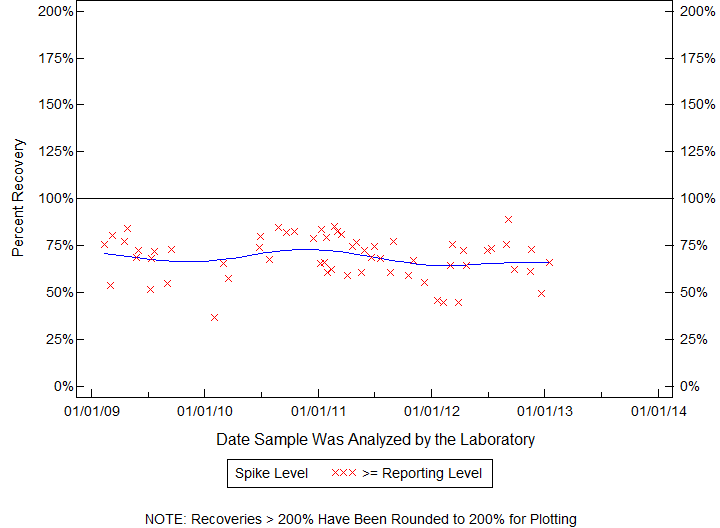
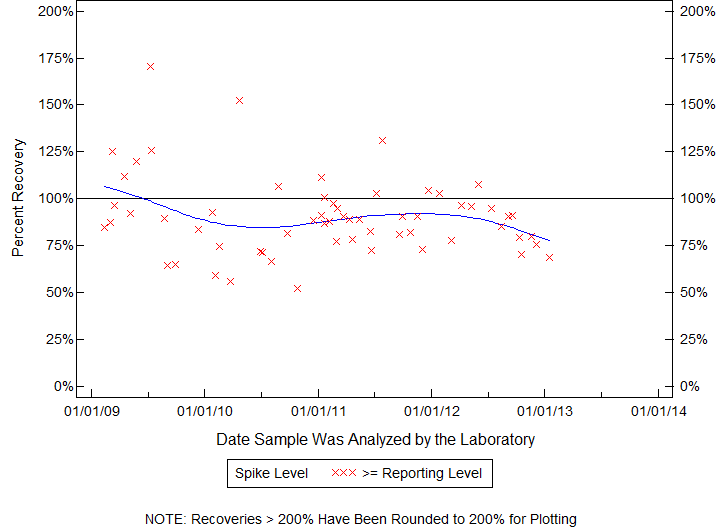
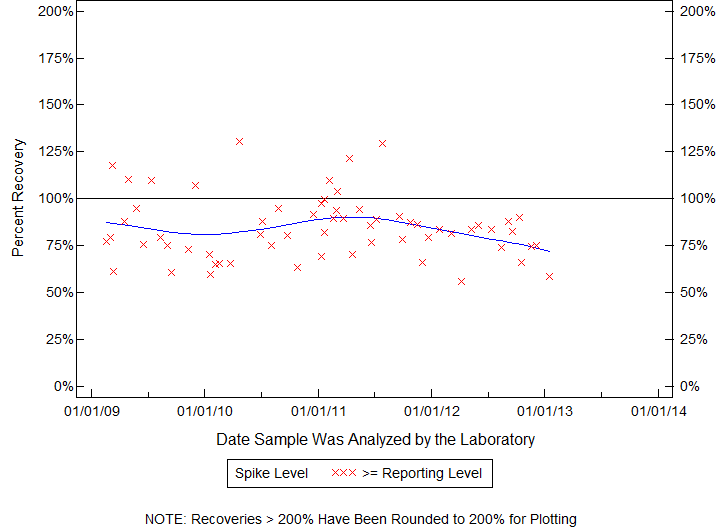
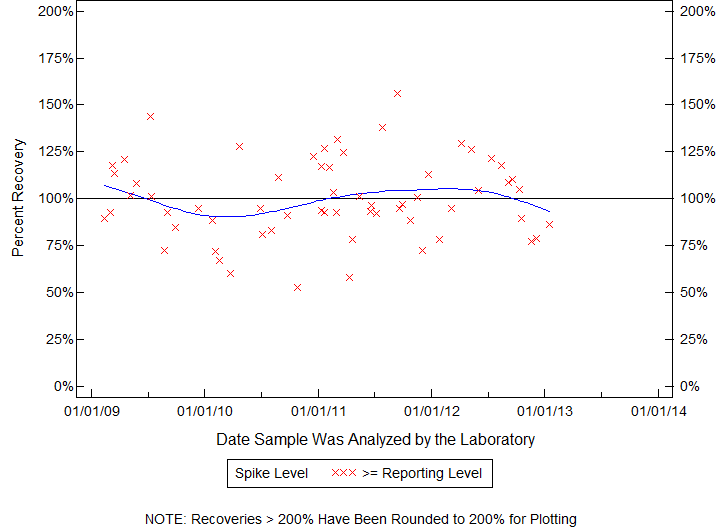
| BQS ORGANIC BLIND SAMPLES |
| SIMAZINE, |
| Schedule: 2033 Testid: 04035GCM35 |
| Measured in MICROGRAMS PER LITER |
| 02/11/09 TO 01/15/13 |
| Open Data Set |
| Statistics for the Plotted Points |
| SIMAZINE |
| Spike Level | N | Mean | Std-Dev. | Median | F_Pseudo |
|---|---|---|---|---|---|
| >= Reporting Level | 61 | 94% | 17% | 93% | 15% |
| Total | 61 | 94% | 17% | 93% | 15% |
| Miscellaneous Statistics for the Samples |
| SIMAZINE |
| Characteristic | N | % | % Basis |
|---|---|---|---|
| Plotted | 61 | 100% | Spiked |
| Estimated Values | 1 | 2% | Spiked |
| Deleted Values | 0 | 0% | Spiked + Not Spiked |
| Spiked, Censored | 0 | 0% | Spiked |
| Spiked | 61 | . | |
| False Negatives | 0 | 0% | 0 out of 61 |
| Not Spiked | 103 | . | |
| False Positives | 10 | 10% | 10 out of 103 |
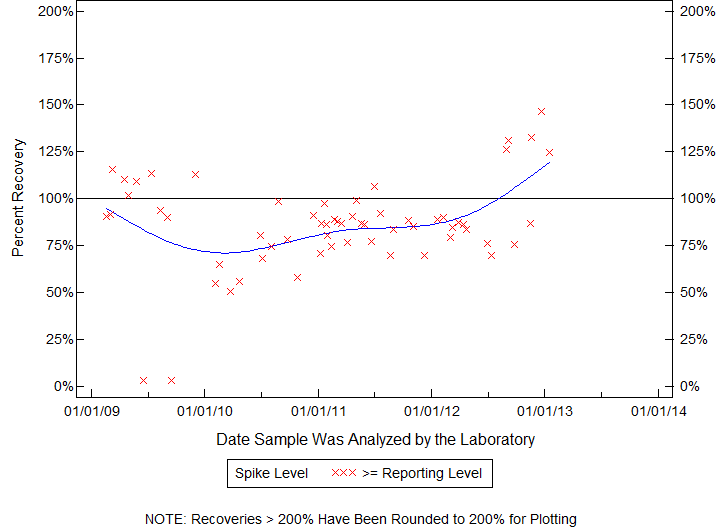
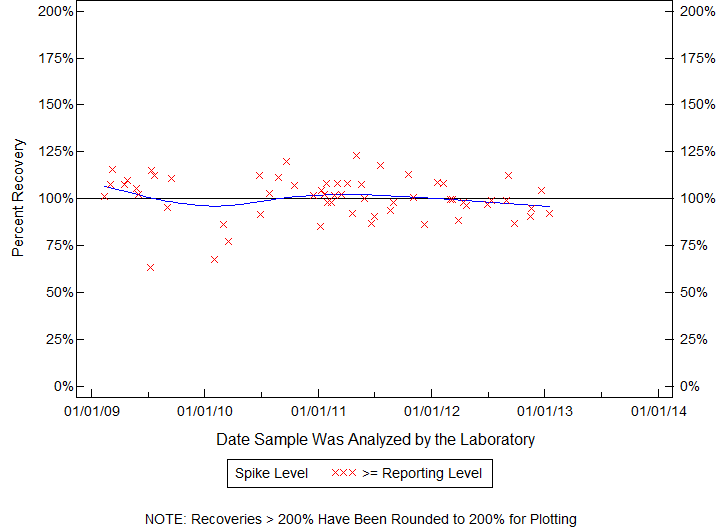
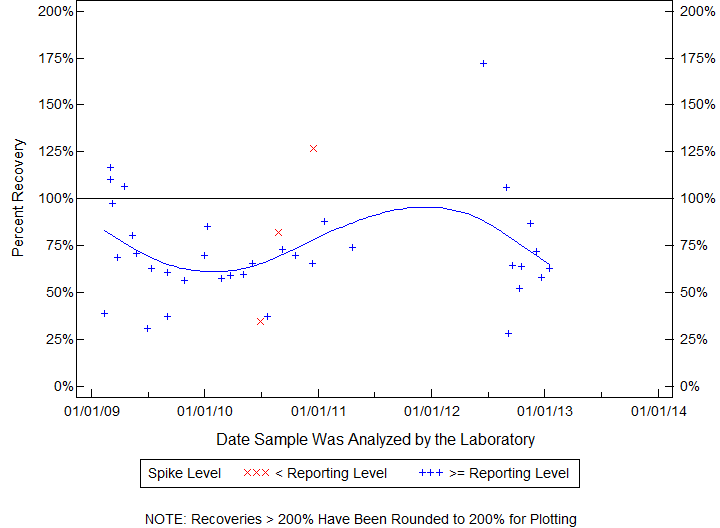
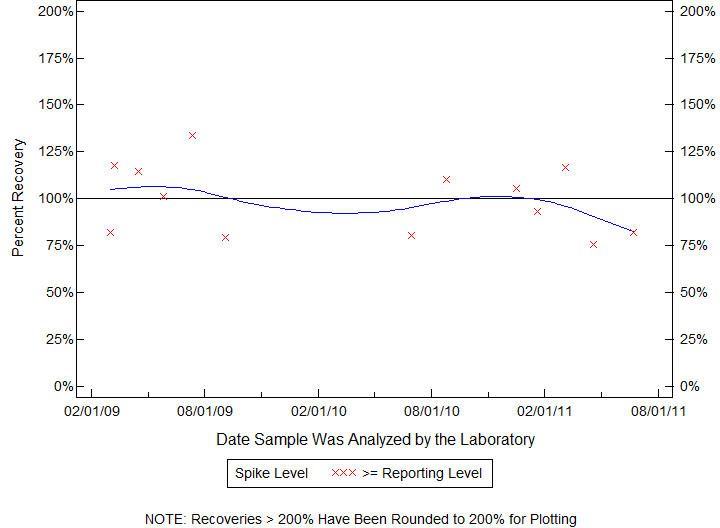
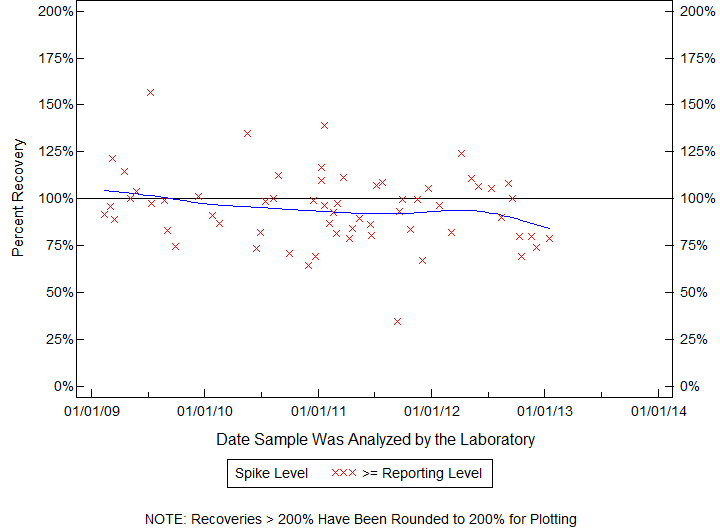
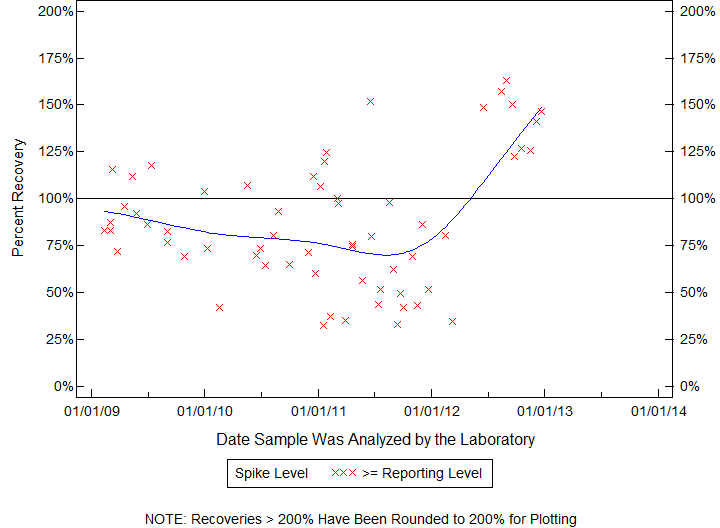
| BQS ORGANIC BLIND SAMPLES |
| PROMETRYN, |
| Schedule: 2033 Testid: 04036GCM39 |
| Measured in MICROGRAMS PER LITER |
| 02/11/09 TO 01/15/13 |
| Open Data Set |
| Statistics for the Plotted Points |
| PROMETRYN |
| Spike Level | N | Mean | Std-Dev. | Median | F_Pseudo |
|---|---|---|---|---|---|
| >= Reporting Level | 60 | 96% | 19% | 94% | 16% |
| Total | 60 | 96% | 19% | 94% | 16% |
| Miscellaneous Statistics for the Samples |
| PROMETRYN |
| Characteristic | N | % | % Basis |
|---|---|---|---|
| Plotted | 60 | 100% | Spiked |
| Estimated Values | 3 | 5% | Spiked |
| Deleted Values | 0 | 0% | Spiked + Not Spiked |
| Spiked, Censored | 0 | 0% | Spiked |
| Spiked | 60 | . | |
| False Negatives | 0 | 0% | 0 out of 60 |
| Not Spiked | 103 | . | |
| False Positives | 0 | 0% | 0 out of 103 |
| BQS ORGANIC BLIND SAMPLES |
| PROMETON, |
| Schedule: 2033 Testid: 04037GCM35 |
| Measured in MICROGRAMS PER LITER |
| 02/18/09 TO 01/15/13 |
| Open Data Set |
| Statistics for the Plotted Points |
| PROMETON |
| Spike Level | N | Mean | Std-Dev. | Median | F_Pseudo |
|---|---|---|---|---|---|
| >= Reporting Level | 64 | 93% | 16% | 94% | 14% |
| Total | 64 | 93% | 16% | 94% | 14% |
| Miscellaneous Statistics for the Samples |
| PROMETON |
| Characteristic | N | % | % Basis |
|---|---|---|---|
| Plotted | 64 | 100% | Spiked |
| Estimated Values | 1 | 2% | Spiked |
| Deleted Values | 0 | 0% | Spiked + Not Spiked |
| Spiked, Censored | 0 | 0% | Spiked |
| Spiked | 64 | . | |
| False Negatives | 0 | 0% | 0 out of 64 |
| Not Spiked | 100 | . | |
| False Positives | 4 | 4% | 4 out of 100 |
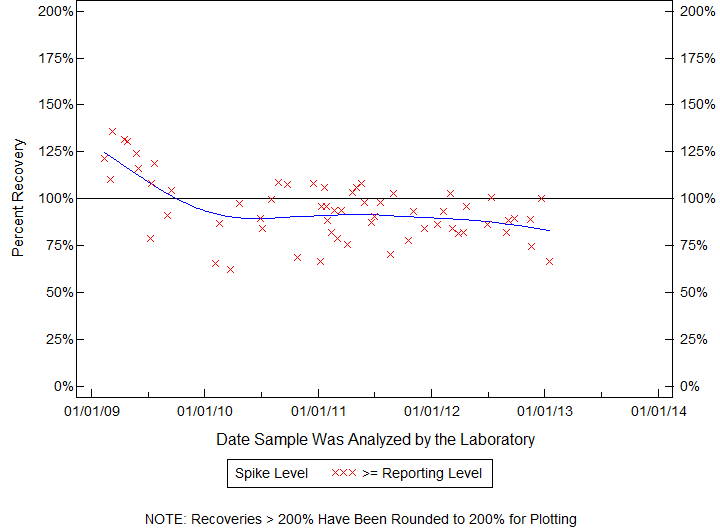
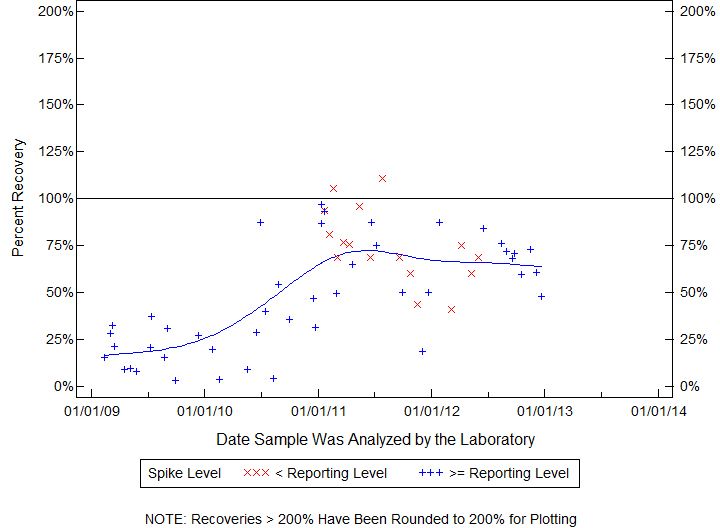
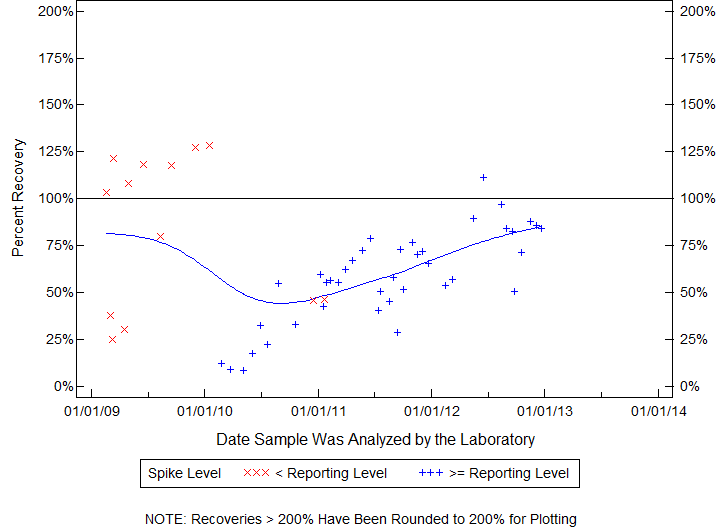
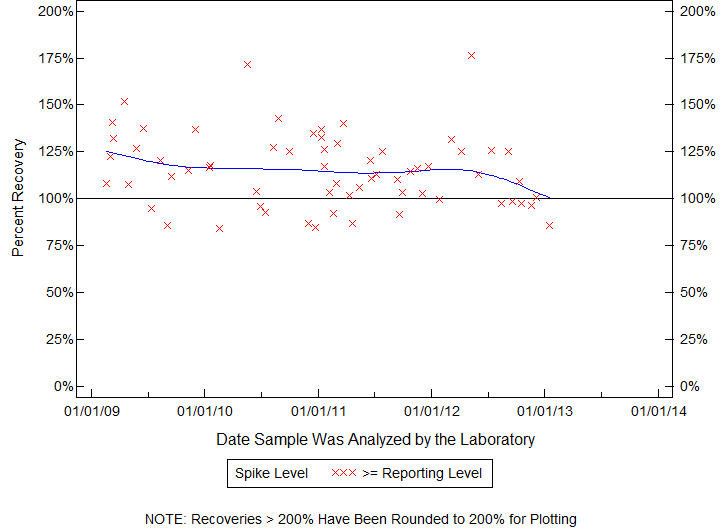
| BQS ORGANIC BLIND SAMPLES |
| DEETHYLATRAZINE (DESETHYL ATRAZINE) (2-CHLORO-4-ISOPROPYLAMINO-6-S-TRIAZINE) CIAT |
| Permanently Estimated Compound |
| Schedule: 2033 Testid: 04040GCM35 |
| 02/11/09 TO 01/15/13 |
| Open Data Set |
| Statistics for the Plotted Points |
| DEETHYLATRAZINE (DESETHYL ATRAZINE) (2-CHLORO-4-ISOPROPYLAMINO-6-S-TRIAZINE) CIAT |
| Spike Level | N | Mean | Std-Dev. | Median | F_Pseudo |
|---|---|---|---|---|---|
| >= Reporting Level | 61 | 95% | 28% | 96% | 28% |
| Total | 61 | 95% | 28% | 96% | 28% |
| Miscellaneous Statistics for the Samples |
| DEETHYLATRAZINE (DESETHYL ATRAZINE) (2-CHLORO-4-ISOPROPYLAMINO-6-S-TRIAZINE) CIAT |
| Characteristic | N | % | % Basis |
|---|---|---|---|
| Plotted | 61 | 100% | Spiked |
| Estimated Values | 61 | 100% | Spiked |
| Deleted Values | 0 | 0% | Spiked + Not Spiked |
| Spiked, Censored | 0 | 0% | Spiked |
| Spiked | 61 | . | |
| False Negatives | 0 | 0% | 0 out of 61 |
| Not Spiked | 103 | . | |
| False Positives | 1 | 1% | 1 out of 103 |
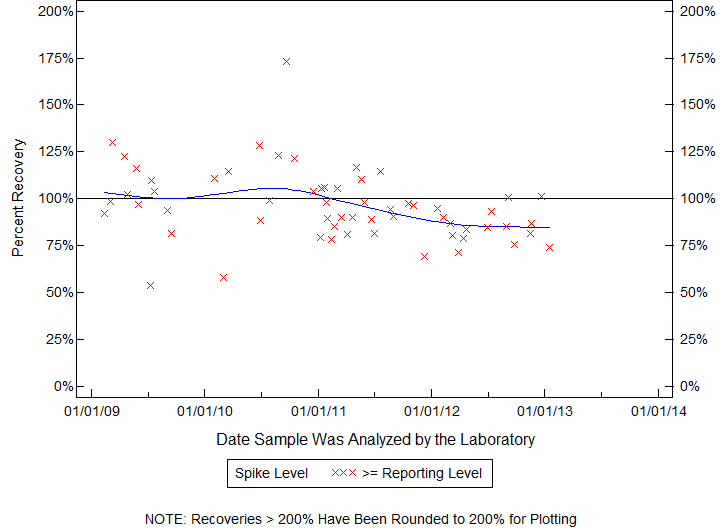
| BQS ORGANIC BLIND SAMPLES |
| CYANAZINE, |
| Schedule: 2033 Testid: 04041GCM35 |
| Measured in MICROGRAMS PER LITER |
| 02/11/09 TO 12/20/12 |
| Open Data Set |
| Statistics for the Plotted Points |
| CYANAZINE |
| Spike Level | N | Mean | Std-Dev. | Median | F_Pseudo |
|---|---|---|---|---|---|
| >= Reporting Level | 60 | 102% | 22% | 99% | 16% |
| Total | 60 | 102% | 22% | 99% | 16% |
| Miscellaneous Statistics for the Samples |
| CYANAZINE |
| Characteristic | N | % | % Basis |
|---|---|---|---|
| Plotted | 60 | 98% | Spiked |
| Estimated Values | 2 | 3% | Spiked |
| Deleted Values | 0 | 0% | Spiked + Not Spiked |
| Spiked, Censored | 0 | 0% | Spiked |
| Spiked | 61 | . | |
| False Negatives | 1 | 2% | 1 out of 61 |
| Not Spiked | 103 | . | |
| False Positives | 0 | 0% | 0 out of 103 |
| BQS ORGANIC BLIND SAMPLES |
| FONOFOS, |
| Schedule: 2033 Testid: 04095GCM35 |
| Measured in MICROGRAMS PER LITER |
| 02/18/09 TO 01/15/13 |
| Open Data Set |
| Statistics for the Plotted Points |
| FONOFOS |
| Spike Level | N | Mean | Std-Dev. | Median | F_Pseudo |
|---|---|---|---|---|---|
| >= Reporting Level | 61 | 86% | 24% | 87% | 13% |
| Total | 61 | 86% | 24% | 87% | 13% |
| Miscellaneous Statistics for the Samples |
| FONOFOS |
| Characteristic | N | % | % Basis |
|---|---|---|---|
| Plotted | 61 | 94% | Spiked |
| Estimated Values | 2 | 3% | Spiked |
| Deleted Values | 0 | 0% | Spiked + Not Spiked |
| Spiked, Censored | 0 | 0% | Spiked |
| Spiked | 65 | . | |
| False Negatives | 4 | 6% | 4 out of 65 |
| Not Spiked | 99 | . | |
| False Positives | 0 | 0% | 0 out of 99 |
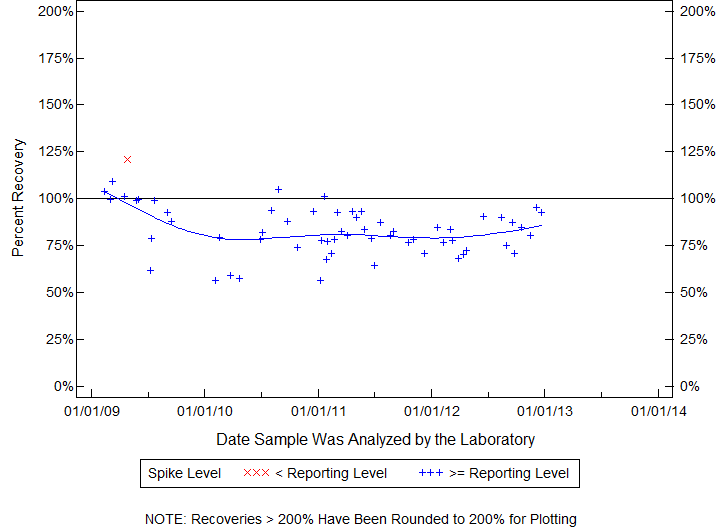
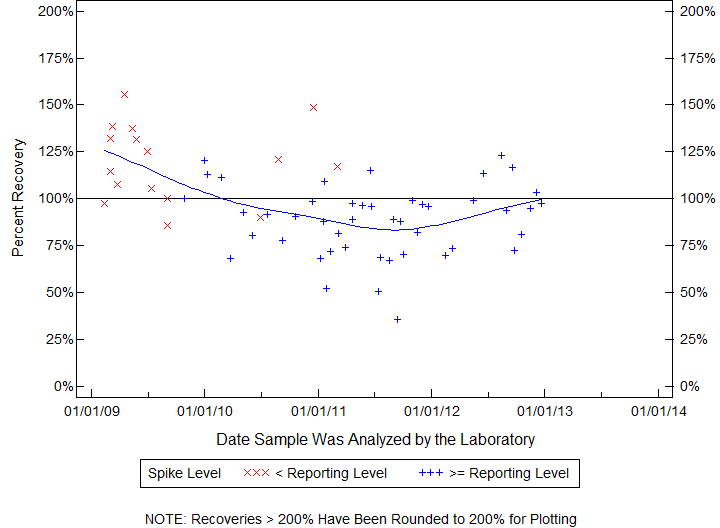
| BQS ORGANIC BLIND SAMPLES |
| ALPHA-ENDOSULFAN (ENDOSULFAN I), |
| Schedule: 2033 Testid: 34362GCM39 |
| Measured in MICROGRAMS PER LITER |
| 02/11/09 TO 01/15/13 |
| Open Data Set |
| Statistics for the Plotted Points |
| ALPHA-ENDOSULFAN (ENDOSULFAN I) |
| Spike Level | N | Mean | Std-Dev. | Median | F_Pseudo |
|---|---|---|---|---|---|
| >= Reporting Level | 60 | 91% | 17% | 89% | 12% |
| Total | 60 | 91% | 17% | 89% | 12% |
| Miscellaneous Statistics for the Samples |
| ALPHA-ENDOSULFAN (ENDOSULFAN I) |
| Characteristic | N | % | % Basis |
|---|---|---|---|
| Plotted | 60 | 100% | Spiked |
| Estimated Values | 3 | 5% | Spiked |
| Deleted Values | 0 | 0% | Spiked + Not Spiked |
| Spiked, Censored | 0 | 0% | Spiked |
| Spiked | 60 | . | |
| False Negatives | 0 | 0% | 0 out of 60 |
| Not Spiked | 104 | . | |
| False Positives | 0 | 0% | 0 out of 104 |
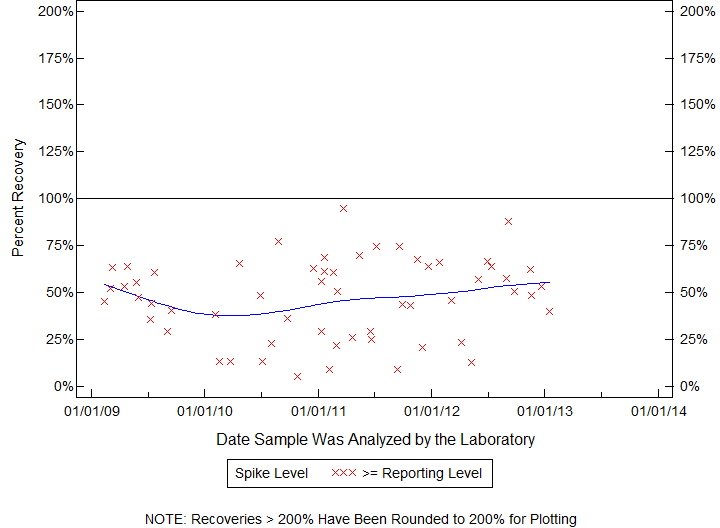
| BQS ORGANIC BLIND SAMPLES |
| DICROTOPHOS |
| Permanently Estimated Compound |
| Schedule: 2033 Testid: 38454GCM39 |
| 02/11/09 TO 12/20/12 |
| Open Data Set |
| Statistics for the Plotted Points |
| DICROTOPHOS |
| Spike Level | N | Mean | Std-Dev. | Median | F_Pseudo |
|---|---|---|---|---|---|
| < Reporting Level | 10 | 49% | 15% | 45% | 10% |
| >= Reporting Level | 52 | 32% | 12% | 29% | 14% |
| Total | 62 | 35% | 14% | 34% | 15% |
| Miscellaneous Statistics for the Samples |
| DICROTOPHOS |
| Characteristic | N | % | % Basis |
|---|---|---|---|
| Plotted | 62 | 100% | Spiked |
| Estimated Values | 62 | 100% | Spiked |
| Deleted Values | 0 | 0% | Spiked + Not Spiked |
| Spiked, Censored | 0 | 0% | Spiked |
| Spiked | 62 | . | |
| False Negatives | 0 | 0% | 0 out of 62 |
| Not Spiked | 102 | . | |
| False Positives | 1 | 1% | 1 out of 102 |
| BQS ORGANIC BLIND SAMPLES |
| DICHLOROVOS (DICHLORVOS) |
| Permanently Estimated Compound |
| Schedule: 2033 Testid: 38775GCM39 |
| 02/11/09 TO 12/20/12 |
| Open Data Set |
| Statistics for the Plotted Points |
| DICHLOROVOS (DICHLORVOS) |
| Spike Level | N | Mean | Std-Dev. | Median | F_Pseudo |
|---|---|---|---|---|---|
| < Reporting Level | 16 | 75% | 20% | 72% | 17% |
| >= Reporting Level | 44 | 45% | 29% | 43% | 38% |
| Total | 60 | 53% | 29% | 57% | 35% |
| Miscellaneous Statistics for the Samples |
| DICHLOROVOS (DICHLORVOS) |
| Characteristic | N | % | % Basis |
|---|---|---|---|
| Plotted | 60 | 98% | Spiked |
| Estimated Values | 60 | 98% | Spiked |
| Deleted Values | 0 | 0% | Spiked + Not Spiked |
| Spiked, Censored | 0 | 0% | Spiked |
| Spiked | 61 | . | |
| False Negatives | 1 | 2% | 1 out of 61 |
| Not Spiked | 103 | . | |
| False Positives | 1 | 1% | 1 out of 103 |
| BQS ORGANIC BLIND SAMPLES |
| CHLORPYRIFOS, |
| Schedule: 2033 Testid: 38933GCM35 |
| Measured in MICROGRAMS PER LITER |
| 02/11/09 TO 12/20/12 |
| Open Data Set |
| Statistics for the Plotted Points |
| CHLORPYRIFOS |
| Spike Level | N | Mean | Std-Dev. | Median | F_Pseudo |
|---|---|---|---|---|---|
| < Reporting Level | 1 | 121% | . | 121% | 0% |
| >= Reporting Level | 60 | 83% | 13% | 82% | 12% |
| Total | 61 | 83% | 13% | 83% | 12% |
| Miscellaneous Statistics for the Samples |
| CHLORPYRIFOS |
| Characteristic | N | % | % Basis |
|---|---|---|---|
| Plotted | 61 | 100% | Spiked |
| Estimated Values | 3 | 5% | Spiked |
| Deleted Values | 0 | 0% | Spiked + Not Spiked |
| Spiked, Censored | 0 | 0% | Spiked |
| Spiked | 61 | . | |
| False Negatives | 0 | 0% | 0 out of 61 |
| Not Spiked | 103 | . | |
| False Positives | 0 | 0% | 0 out of 103 |
| BQS ORGANIC BLIND SAMPLES |
| DIELDRIN, |
| Schedule: 2033 Testid: 39381GCM35 |
| Measured in MICROGRAMS PER LITER |
| 02/18/09 TO 01/15/13 |
| Open Data Set |
| Statistics for the Plotted Points |
| DIELDRIN |
| Spike Level | N | Mean | Std-Dev. | Median | F_Pseudo |
|---|---|---|---|---|---|
| >= Reporting Level | 65 | 96% | 19% | 92% | 17% |
| Total | 65 | 96% | 19% | 92% | 17% |
| Miscellaneous Statistics for the Samples |
| DIELDRIN |
| Characteristic | N | % | % Basis |
|---|---|---|---|
| Plotted | 65 | 100% | Spiked |
| Estimated Values | 3 | 5% | Spiked |
| Deleted Values | 0 | 0% | Spiked + Not Spiked |
| Spiked, Censored | 0 | 0% | Spiked |
| Spiked | 65 | . | |
| False Negatives | 0 | 0% | 0 out of 65 |
| Not Spiked | 99 | . | |
| False Positives | 0 | 0% | 0 out of 99 |
| BQS ORGANIC BLIND SAMPLES |
| METOLACHLOR, |
| Schedule: 2033 Testid: 39415GCM35 |
| Measured in MICROGRAMS PER LITER |
| 02/18/09 TO 12/20/12 |
| Open Data Set |
| Statistics for the Plotted Points |
| METOLACHLOR |
| Spike Level | N | Mean | Std-Dev. | Median | F_Pseudo |
|---|---|---|---|---|---|
| >= Reporting Level | 64 | 99% | 22% | 95% | 18% |
| Total | 64 | 99% | 22% | 95% | 18% |
| Miscellaneous Statistics for the Samples |
| METOLACHLOR |
| Characteristic | N | % | % Basis |
|---|---|---|---|
| Plotted | 64 | 100% | Spiked |
| Estimated Values | 2 | 3% | Spiked |
| Deleted Values | 0 | 0% | Spiked + Not Spiked |
| Spiked, Censored | 0 | 0% | Spiked |
| Spiked | 64 | . | |
| False Negatives | 0 | 0% | 0 out of 64 |
| Not Spiked | 100 | . | |
| False Positives | 1 | 1% | 1 out of 100 |
| BQS ORGANIC BLIND SAMPLES |
| MALATHION, |
| Schedule: 2033 Testid: 39532GCM35 |
| Measured in MICROGRAMS PER LITER |
| 02/11/09 TO 01/15/13 |
| Open Data Set |
| Statistics for the Plotted Points |
| MALATHION |
| Spike Level | N | Mean | Std-Dev. | Median | F_Pseudo |
|---|---|---|---|---|---|
| >= Reporting Level | 62 | 97% | 22% | 95% | 18% |
| Total | 62 | 97% | 22% | 95% | 18% |
| Miscellaneous Statistics for the Samples |
| MALATHION |
| Characteristic | N | % | % Basis |
|---|---|---|---|
| Plotted | 62 | 100% | Spiked |
| Estimated Values | 2 | 3% | Spiked |
| Deleted Values | 0 | 0% | Spiked + Not Spiked |
| Spiked, Censored | 0 | 0% | Spiked |
| Spiked | 62 | . | |
| False Negatives | 0 | 0% | 0 out of 62 |
| Not Spiked | 102 | . | |
| False Positives | 0 | 0% | 0 out of 102 |
| BQS ORGANIC BLIND SAMPLES |
| DIAZINON, |
| Schedule: 2033 Testid: 39572GCM35 |
| Measured in MICROGRAMS PER LITER |
| 02/11/09 TO 01/15/13 |
| Open Data Set |
| Statistics for the Plotted Points |
| DIAZINON |
| Spike Level | N | Mean | Std-Dev. | Median | F_Pseudo |
|---|---|---|---|---|---|
| >= Reporting Level | 60 | 101% | 11% | 101% | 10% |
| Total | 60 | 101% | 11% | 101% | 10% |
| Miscellaneous Statistics for the Samples |
| DIAZINON |
| Characteristic | N | % | % Basis |
|---|---|---|---|
| Plotted | 60 | 100% | Spiked |
| Estimated Values | 1 | 2% | Spiked |
| Deleted Values | 0 | 0% | Spiked + Not Spiked |
| Spiked, Censored | 0 | 0% | Spiked |
| Spiked | 60 | . | |
| False Negatives | 0 | 0% | 0 out of 60 |
| Not Spiked | 104 | . | |
| False Positives | 0 | 0% | 0 out of 104 |
| BQS ORGANIC BLIND SAMPLES |
| ATRAZINE, |
| Schedule: 2033 Testid: 39632GCM35 |
| Measured in MICROGRAMS PER LITER |
| 02/18/09 TO 01/15/13 |
| Open Data Set |
| Statistics for the Plotted Points |
| ATRAZINE |
| Spike Level | N | Mean | Std-Dev. | Median | F_Pseudo |
|---|---|---|---|---|---|
| >= Reporting Level | 64 | 101% | 14% | 104% | 13% |
| Total | 64 | 101% | 14% | 104% | 13% |
| Miscellaneous Statistics for the Samples |
| ATRAZINE |
| Characteristic | N | % | % Basis |
|---|---|---|---|
| Plotted | 64 | 100% | Spiked |
| Estimated Values | 1 | 2% | Spiked |
| Deleted Values | 0 | 0% | Spiked + Not Spiked |
| Spiked, Censored | 0 | 0% | Spiked |
| Spiked | 64 | . | |
| False Negatives | 0 | 0% | 0 out of 64 |
| Not Spiked | 100 | . | |
| False Positives | 1 | 1% | 1 out of 100 |
| BQS ORGANIC BLIND SAMPLES |
| ALACHLOR, |
| Schedule: 2033 Testid: 46342GCM35 |
| Measured in MICROGRAMS PER LITER |
| 02/11/09 TO 01/15/13 |
| Open Data Set |
| Statistics for the Plotted Points |
| ALACHLOR |
| Spike Level | N | Mean | Std-Dev. | Median | F_Pseudo |
|---|---|---|---|---|---|
| >= Reporting Level | 61 | 97% | 16% | 95% | 17% |
| Total | 61 | 97% | 16% | 95% | 17% |
| Miscellaneous Statistics for the Samples |
| ALACHLOR |
| Characteristic | N | % | % Basis |
|---|---|---|---|
| Plotted | 61 | 100% | Spiked |
| Estimated Values | 2 | 3% | Spiked |
| Deleted Values | 0 | 0% | Spiked + Not Spiked |
| Spiked, Censored | 0 | 0% | Spiked |
| Spiked | 61 | . | |
| False Negatives | 0 | 0% | 0 out of 61 |
| Not Spiked | 103 | . | |
| False Positives | 0 | 0% | 0 out of 103 |
| BQS ORGANIC BLIND SAMPLES |
| ACETOCHLOR, |
| Schedule: 2033 Testid: 49260GCM33 |
| Measured in MICROGRAMS PER LITER |
| 02/11/09 TO 01/15/13 |
| Open Data Set |
| Statistics for the Plotted Points |
| ACETOCHLOR |
| Spike Level | N | Mean | Std-Dev. | Median | F_Pseudo |
|---|---|---|---|---|---|
| >= Reporting Level | 59 | 97% | 16% | 99% | 17% |
| Total | 59 | 97% | 16% | 99% | 17% |
| Miscellaneous Statistics for the Samples |
| ACETOCHLOR |
| Characteristic | N | % | % Basis |
|---|---|---|---|
| Plotted | 59 | 100% | Spiked |
| Estimated Values | 3 | 5% | Spiked |
| Deleted Values | 0 | 0% | Spiked + Not Spiked |
| Spiked, Censored | 0 | 0% | Spiked |
| Spiked | 59 | . | |
| False Negatives | 0 | 0% | 0 out of 59 |
| Not Spiked | 105 | . | |
| False Positives | 1 | 1% | 1 out of 105 |
| BQS ORGANIC BLIND SAMPLES |
| 1-NAPHTHOL |
| Permanently Estimated Compound |
| Schedule: 2033 Testid: 49295GCM39 |
| 02/11/09 TO 12/20/12 |
| Open Data Set |
| Statistics for the Plotted Points |
| 1-NAPHTHOL |
| Spike Level | N | Mean | Std-Dev. | Median | F_Pseudo |
|---|---|---|---|---|---|
| < Reporting Level | 1 | 78% | . | 78% | 0% |
| >= Reporting Level | 61 | 80% | 42% | 72% | 38% |
| Total | 62 | 80% | 42% | 72% | 38% |
| Miscellaneous Statistics for the Samples |
| 1-NAPHTHOL |
| Characteristic | N | % | % Basis |
|---|---|---|---|
| Plotted | 62 | 100% | Spiked |
| Estimated Values | 62 | 100% | Spiked |
| Deleted Values | 0 | 0% | Spiked + Not Spiked |
| Spiked, Censored | 0 | 0% | Spiked |
| Spiked | 62 | . | |
| False Negatives | 0 | 0% | 0 out of 62 |
| Not Spiked | 102 | . | |
| False Positives | 0 | 0% | 0 out of 102 |
| BQS ORGANIC BLIND SAMPLES |
| CYFLUTHRIN |
| Permanently Estimated Compound |
| Schedule: 2033 Testid: 61585GCM39 |
| 02/11/09 TO 01/15/13 |
| Open Data Set |
| Statistics for the Plotted Points |
| CYFLUTHRIN |
| Spike Level | N | Mean | Std-Dev. | Median | F_Pseudo |
|---|---|---|---|---|---|
| >= Reporting Level | 48 | 59% | 24% | 58% | 23% |
| Total | 48 | 59% | 24% | 58% | 23% |
| Miscellaneous Statistics for the Samples |
| CYFLUTHRIN |
| Characteristic | N | % | % Basis |
|---|---|---|---|
| Plotted | 48 | 100% | Spiked |
| Estimated Values | 48 | 100% | Spiked |
| Deleted Values | 0 | 0% | Spiked + Not Spiked |
| Spiked, Censored | 0 | 0% | Spiked |
| Spiked | 48 | . | |
| False Negatives | 0 | 0% | 0 out of 48 |
| Not Spiked | 103 | . | |
| False Positives | 1 | 1% | 1 out of 103 |
| BQS ORGANIC BLIND SAMPLES |
| CYPERMETHRIN |
| Permanently Estimated Compound |
| Schedule: 2033 Testid: 61586GCM39 |
| 02/11/09 TO 12/20/12 |
| Open Data Set |
| Statistics for the Plotted Points |
| CYPERMETHRIN |
| Spike Level | N | Mean | Std-Dev. | Median | F_Pseudo |
|---|---|---|---|---|---|
| >= Reporting Level | 61 | 67% | 18% | 66% | 17% |
| Total | 61 | 67% | 18% | 66% | 17% |
| Miscellaneous Statistics for the Samples |
| CYPERMETHRIN |
| Characteristic | N | % | % Basis |
|---|---|---|---|
| Plotted | 61 | 100% | Spiked |
| Estimated Values | 61 | 100% | Spiked |
| Deleted Values | 0 | 0% | Spiked + Not Spiked |
| Spiked, Censored | 0 | 0% | Spiked |
| Spiked | 61 | . | |
| False Negatives | 0 | 0% | 0 out of 61 |
| Not Spiked | 103 | . | |
| False Positives | 1 | 1% | 1 out of 103 |
| BQS ORGANIC BLIND SAMPLES |
| ENDOSULFAN SULFATE, |
| Schedule: 2033 Testid: 61590GCM39 |
| Measured in MICROGRAMS PER LITER |
| 02/11/09 TO 01/15/13 |
| Open Data Set |
| Statistics for the Plotted Points |
| ENDOSULFAN SULFATE |
| Spike Level | N | Mean | Std-Dev. | Median | F_Pseudo |
|---|---|---|---|---|---|
| >= Reporting Level | 62 | 88% | 14% | 90% | 13% |
| Total | 62 | 88% | 14% | 90% | 13% |
| Miscellaneous Statistics for the Samples |
| ENDOSULFAN SULFATE |
| Characteristic | N | % | % Basis |
|---|---|---|---|
| Plotted | 62 | 98% | Spiked |
| Estimated Values | 3 | 5% | Spiked |
| Deleted Values | 0 | 0% | Spiked + Not Spiked |
| Spiked, Censored | 0 | 0% | Spiked |
| Spiked | 63 | . | |
| False Negatives | 1 | 2% | 1 out of 63 |
| Not Spiked | 101 | . | |
| False Positives | 0 | 0% | 0 out of 101 |
| BQS ORGANIC BLIND SAMPLES |
| FENAMIPHOS, |
| Schedule: 2033 Testid: 61591GCM39 |
| Measured in MICROGRAMS PER LITER |
| 02/11/09 TO 12/20/12 |
| Open Data Set |
| Statistics for the Plotted Points |
| FENAMIPHOS |
| Spike Level | N | Mean | Std-Dev. | Median | F_Pseudo |
|---|---|---|---|---|---|
| < Reporting Level | 1 | 114% | . | 114% | 0% |
| >= Reporting Level | 61 | 90% | 21% | 87% | 21% |
| Total | 62 | 90% | 21% | 87% | 21% |
| Miscellaneous Statistics for the Samples |
| FENAMIPHOS |
| Characteristic | N | % | % Basis |
|---|---|---|---|
| Plotted | 62 | 100% | Spiked |
| Estimated Values | 3 | 5% | Spiked |
| Deleted Values | 0 | 0% | Spiked + Not Spiked |
| Spiked, Censored | 0 | 0% | Spiked |
| Spiked | 62 | . | |
| False Negatives | 0 | 0% | 0 out of 62 |
| Not Spiked | 102 | . | |
| False Positives | 1 | 1% | 1 out of 102 |
| BQS ORGANIC BLIND SAMPLES |
| IPRODIONE |
| Permanently Estimated Compound |
| Schedule: 2033 Testid: 61593GCM39 |
| 02/18/09 TO 01/15/13 |
| Open Data Set |
| Statistics for the Plotted Points |
| IPRODIONE |
| Spike Level | N | Mean | Std-Dev. | Median | F_Pseudo |
|---|---|---|---|---|---|
| >= Reporting Level | 56 | 76% | 20% | 81% | 16% |
| Total | 56 | 76% | 20% | 81% | 16% |
| Miscellaneous Statistics for the Samples |
| IPRODIONE |
| Characteristic | N | % | % Basis |
|---|---|---|---|
| Plotted | 56 | 88% | Spiked |
| Estimated Values | 56 | 88% | Spiked |
| Deleted Values | 0 | 0% | Spiked + Not Spiked |
| Spiked, Censored | 0 | 0% | Spiked |
| Spiked | 64 | . | |
| False Negatives | 8 | 13% | 8 out of 64 |
| Not Spiked | 100 | . | |
| False Positives | 0 | 0% | 0 out of 100 |
| BQS ORGANIC BLIND SAMPLES |
| ISOFENPHOS, |
| Schedule: 2033 Testid: 61594GCM39 |
| Measured in MICROGRAMS PER LITER |
| 02/11/09 TO 01/15/13 |
| Open Data Set |
| Statistics for the Plotted Points |
| ISOFENPHOS |
| Spike Level | N | Mean | Std-Dev. | Median | F_Pseudo |
|---|---|---|---|---|---|
| >= Reporting Level | 60 | 108% | 22% | 105% | 19% |
| Total | 60 | 108% | 22% | 105% | 19% |
| Miscellaneous Statistics for the Samples |
| ISOFENPHOS |
| Characteristic | N | % | % Basis |
|---|---|---|---|
| Plotted | 60 | 100% | Spiked |
| Estimated Values | 2 | 3% | Spiked |
| Deleted Values | 0 | 0% | Spiked + Not Spiked |
| Spiked, Censored | 0 | 0% | Spiked |
| Spiked | 60 | . | |
| False Negatives | 0 | 0% | 0 out of 60 |
| Not Spiked | 104 | . | |
| False Positives | 0 | 0% | 0 out of 104 |
| BQS ORGANIC BLIND SAMPLES |
| CYHALOTHRIN |
| Permanently Estimated Compound |
| Schedule: 2033 Testid: 61595GCM39 |
| 02/11/09 TO 01/15/13 |
| Open Data Set |
| Statistics for the Plotted Points |
| CYHALOTHRIN |
| Spike Level | N | Mean | Std-Dev. | Median | F_Pseudo |
|---|---|---|---|---|---|
| >= Reporting Level | 58 | 47% | 21% | 50% | 25% |
| Total | 58 | 47% | 21% | 50% | 25% |
| Miscellaneous Statistics for the Samples |
| CYHALOTHRIN |
| Characteristic | N | % | % Basis |
|---|---|---|---|
| Plotted | 58 | 97% | Spiked |
| Estimated Values | 58 | 97% | Spiked |
| Deleted Values | 0 | 0% | Spiked + Not Spiked |
| Spiked, Censored | 0 | 0% | Spiked |
| Spiked | 60 | . | |
| False Negatives | 2 | 3% | 2 out of 60 |
| Not Spiked | 104 | . | |
| False Positives | 0 | 0% | 0 out of 104 |
| BQS ORGANIC BLIND SAMPLES |
| METALAXYL, |
| Schedule: 2033 Testid: 61596GCM39 |
| Measured in MICROGRAMS PER LITER |
| 02/18/09 TO 01/15/13 |
| Open Data Set |
| Statistics for the Plotted Points |
| METALAXYL |
| Spike Level | N | Mean | Std-Dev. | Median | F_Pseudo |
|---|---|---|---|---|---|
| >= Reporting Level | 64 | 102% | 15% | 99% | 16% |
| Total | 64 | 102% | 15% | 99% | 16% |
| Miscellaneous Statistics for the Samples |
| METALAXYL |
| Characteristic | N | % | % Basis |
|---|---|---|---|
| Plotted | 64 | 98% | Spiked |
| Estimated Values | 1 | 2% | Spiked |
| Deleted Values | 0 | 0% | Spiked + Not Spiked |
| Spiked, Censored | 0 | 0% | Spiked |
| Spiked | 65 | . | |
| False Negatives | 1 | 2% | 1 out of 65 |
| Not Spiked | 99 | . | |
| False Positives | 0 | 0% | 0 out of 99 |
| BQS ORGANIC BLIND SAMPLES |
| METHIDATHION (SUPRACIDE), |
| Schedule: 2033 Testid: 61598GCM39 |
| Measured in MICROGRAMS PER LITER |
| 02/11/09 TO 01/15/13 |
| Open Data Set |
| Statistics for the Plotted Points |
| METHIDATHION (SUPRACIDE) |
| Spike Level | N | Mean | Std-Dev. | Median | F_Pseudo |
|---|---|---|---|---|---|
| >= Reporting Level | 60 | 91% | 19% | 90% | 18% |
| Total | 60 | 91% | 19% | 90% | 18% |
| Miscellaneous Statistics for the Samples |
| METHIDATHION (SUPRACIDE) |
| Characteristic | N | % | % Basis |
|---|---|---|---|
| Plotted | 60 | 98% | Spiked |
| Estimated Values | 4 | 7% | Spiked |
| Deleted Values | 0 | 0% | Spiked + Not Spiked |
| Spiked, Censored | 0 | 0% | Spiked |
| Spiked | 61 | . | |
| False Negatives | 1 | 2% | 1 out of 61 |
| Not Spiked | 103 | . | |
| False Positives | 0 | 0% | 0 out of 103 |
| BQS ORGANIC BLIND SAMPLES |
| MYCLOBUTANIL, |
| Schedule: 2033 Testid: 61599GCM39 |
| Measured in MICROGRAMS PER LITER |
| 02/18/09 TO 01/15/13 |
| Open Data Set |
| Statistics for the Plotted Points |
| MYCLOBUTANIL |
| Spike Level | N | Mean | Std-Dev. | Median | F_Pseudo |
|---|---|---|---|---|---|
| >= Reporting Level | 64 | 80% | 17% | 80% | 16% |
| Total | 64 | 80% | 17% | 80% | 16% |
| Miscellaneous Statistics for the Samples |
| MYCLOBUTANIL |
| Characteristic | N | % | % Basis |
|---|---|---|---|
| Plotted | 64 | 100% | Spiked |
| Estimated Values | 0 | 0% | Spiked |
| Deleted Values | 0 | 0% | Spiked + Not Spiked |
| Spiked, Censored | 0 | 0% | Spiked |
| Spiked | 64 | . | |
| False Negatives | 0 | 0% | 0 out of 64 |
| Not Spiked | 100 | . | |
| False Positives | 0 | 0% | 0 out of 100 |
| BQS ORGANIC BLIND SAMPLES |
| OXYFLUORFEN, |
| Schedule: 2033 Testid: 61600GCM39 |
| Measured in MICROGRAMS PER LITER |
| 02/11/09 TO 01/15/13 |
| Open Data Set |
| Statistics for the Plotted Points |
| OXYFLUORFEN |
| Spike Level | N | Mean | Std-Dev. | Median | F_Pseudo |
|---|---|---|---|---|---|
| >= Reporting Level | 60 | 82% | 20% | 79% | 18% |
| Total | 60 | 82% | 20% | 79% | 18% |
| Miscellaneous Statistics for the Samples |
| OXYFLUORFEN |
| Characteristic | N | % | % Basis |
|---|---|---|---|
| Plotted | 60 | 100% | Spiked |
| Estimated Values | 4 | 7% | Spiked |
| Deleted Values | 0 | 0% | Spiked + Not Spiked |
| Spiked, Censored | 0 | 0% | Spiked |
| Spiked | 60 | . | |
| False Negatives | 0 | 0% | 0 out of 60 |
| Not Spiked | 104 | . | |
| False Positives | 0 | 0% | 0 out of 104 |
| BQS ORGANIC BLIND SAMPLES |
| PHOSMET (IMIDAN) |
| Permanently Estimated Compound |
| Schedule: 2033 Testid: 61601GCM39 |
| 02/18/09 TO 12/20/12 |
| Open Data Set |
| Statistics for the Plotted Points |
| PHOSMET (IMIDAN) |
| Spike Level | N | Mean | Std-Dev. | Median | F_Pseudo |
|---|---|---|---|---|---|
| < Reporting Level | 13 | 84% | 41% | 103% | 54% |
| >= Reporting Level | 40 | 58% | 25% | 58% | 23% |
| Total | 53 | 65% | 31% | 60% | 29% |
| Miscellaneous Statistics for the Samples |
| PHOSMET (IMIDAN) |
| Characteristic | N | % | % Basis |
|---|---|---|---|
| Plotted | 53 | 84% | Spiked |
| Estimated Values | 53 | 84% | Spiked |
| Deleted Values | 0 | 0% | Spiked + Not Spiked |
| Spiked, Censored | 8 | 13% | Spiked |
| Spiked | 63 | . | |
| False Negatives | 2 | 3% | 2 out of 63 |
| Not Spiked | 101 | . | |
| False Positives | 0 | 0% | 0 out of 101 |
| BQS ORGANIC BLIND SAMPLES |
| TEFLUTHRIN |
| Permanently Estimated Compound |
| Schedule: 2033 Testid: 61606GCM39 |
| 02/11/09 TO 01/15/13 |
| Open Data Set |
| Statistics for the Plotted Points |
| TEFLUTHRIN |
| Spike Level | N | Mean | Std-Dev. | Median | F_Pseudo |
|---|---|---|---|---|---|
| < Reporting Level | 3 | 160% | 69% | 200% | 89% |
| >= Reporting Level | 57 | 69% | 29% | 65% | 13% |
| Total | 60 | 73% | 37% | 66% | 14% |
| Miscellaneous Statistics for the Samples |
| TEFLUTHRIN |
| Characteristic | N | % | % Basis |
|---|---|---|---|
| Plotted | 60 | 100% | Spiked |
| Estimated Values | 60 | 100% | Spiked |
| Deleted Values | 0 | 0% | Spiked + Not Spiked |
| Spiked, Censored | 0 | 0% | Spiked |
| Spiked | 60 | . | |
| False Negatives | 0 | 0% | 0 out of 60 |
| Not Spiked | 104 | . | |
| False Positives | 1 | 1% | 1 out of 104 |
| BQS ORGANIC BLIND SAMPLES |
| TRIBUFOS (S,S,S-TRIBUTYLPHOSPHOROTRITHIOATE (DEF)) |
| Permanently Estimated Compound |
| Schedule: 2033 Testid: 61610GCM39 |
| 02/11/09 TO 01/15/13 |
| Open Data Set |
| Statistics for the Plotted Points |
| TRIBUFOS (S,S,S-TRIBUTYLPHOSPHOROTRITHIOATE (DEF)) |
| Spike Level | N | Mean | Std-Dev. | Median | F_Pseudo |
|---|---|---|---|---|---|
| >= Reporting Level | 62 | 63% | 16% | 59% | 17% |
| Total | 62 | 63% | 16% | 59% | 17% |
| Miscellaneous Statistics for the Samples |
| TRIBUFOS (S,S,S-TRIBUTYLPHOSPHOROTRITHIOATE (DEF)) |
| Characteristic | N | % | % Basis |
|---|---|---|---|
| Plotted | 62 | 100% | Spiked |
| Estimated Values | 62 | 100% | Spiked |
| Deleted Values | 0 | 0% | Spiked + Not Spiked |
| Spiked, Censored | 0 | 0% | Spiked |
| Spiked | 62 | . | |
| False Negatives | 0 | 0% | 0 out of 62 |
| Not Spiked | 102 | . | |
| False Positives | 2 | 2% | 2 out of 102 |
| BQS ORGANIC BLIND SAMPLES |
| 2-CHLORO-2,6-DIETHYLACETANILIDE, |
| Schedule: 2033 Testid: 61618GCM39 |
| Measured in MICROGRAMS PER LITER |
| 02/18/09 TO 11/20/12 |
| Open Data Set |
| Statistics for the Plotted Points |
| 2-CHLORO-2,6-DIETHYLACETANILIDE |
| Spike Level | N | Mean | Std-Dev. | Median | F_Pseudo |
|---|---|---|---|---|---|
| >= Reporting Level | 44 | 107% | 15% | 106% | 15% |
| Total | 44 | 107% | 15% | 106% | 15% |
| Miscellaneous Statistics for the Samples |
| 2-CHLORO-2,6-DIETHYLACETANILIDE |
| Characteristic | N | % | % Basis |
|---|---|---|---|
| Plotted | 44 | 100% | Spiked |
| Estimated Values | 1 | 2% | Spiked |
| Deleted Values | 0 | 0% | Spiked + Not Spiked |
| Spiked, Censored | 0 | 0% | Spiked |
| Spiked | 44 | . | |
| False Negatives | 0 | 0% | 0 out of 44 |
| Not Spiked | 120 | . | |
| False Positives | 1 | 1% | 1 out of 120 |
| BQS ORGANIC BLIND SAMPLES |
| 2-ETHYL-6-METHYLANILINE |
| Permanently Estimated Compound |
| Schedule: 2033 Testid: 61620GCM39 |
| 02/18/09 TO 01/15/13 |
| Open Data Set |
| Statistics for the Plotted Points |
| 2-ETHYL-6-METHYLANILINE |
| Spike Level | N | Mean | Std-Dev. | Median | F_Pseudo |
|---|---|---|---|---|---|
| >= Reporting Level | 48 | 84% | 27% | 92% | 10% |
| Total | 48 | 84% | 27% | 92% | 10% |
| Miscellaneous Statistics for the Samples |
| 2-ETHYL-6-METHYLANILINE |
| Characteristic | N | % | % Basis |
|---|---|---|---|
| Plotted | 48 | 98% | Spiked |
| Estimated Values | 48 | 98% | Spiked |
| Deleted Values | 0 | 0% | Spiked + Not Spiked |
| Spiked, Censored | 0 | 0% | Spiked |
| Spiked | 49 | . | |
| False Negatives | 1 | 2% | 1 out of 49 |
| Not Spiked | 111 | . | |
| False Positives | 0 | 0% | 0 out of 111 |
| BQS ORGANIC BLIND SAMPLES |
| 3,4-DICHLOROANILINE |
| Permanently Estimated Compound |
| Schedule: 2033 Testid: 61625GCM39 |
| 02/11/09 TO 01/15/13 |
| Open Data Set |
| Statistics for the Plotted Points |
| 3,4-DICHLOROANILINE |
| Spike Level | N | Mean | Std-Dev. | Median | F_Pseudo |
|---|---|---|---|---|---|
| >= Reporting Level | 59 | 82% | 10% | 82% | 10% |
| Total | 59 | 82% | 10% | 82% | 10% |
| Miscellaneous Statistics for the Samples |
| 3,4-DICHLOROANILINE |
| Characteristic | N | % | % Basis |
|---|---|---|---|
| Plotted | 59 | 98% | Spiked |
| Estimated Values | 59 | 98% | Spiked |
| Deleted Values | 0 | 0% | Spiked + Not Spiked |
| Spiked, Censored | 1 | 2% | Spiked |
| Spiked | 60 | . | |
| False Negatives | 0 | 0% | 0 out of 60 |
| Not Spiked | 104 | . | |
| False Positives | 0 | 0% | 0 out of 104 |
| BQS ORGANIC BLIND SAMPLES |
| 3,5-DICHLOROANILINE, |
| Schedule: 2033 Testid: 61627GCM39 |
| Measured in MICROGRAMS PER LITER |
| 02/18/09 TO 01/15/13 |
| Open Data Set |
| Statistics for the Plotted Points |
| 3,5-DICHLOROANILINE |
| Spike Level | N | Mean | Std-Dev. | Median | F_Pseudo |
|---|---|---|---|---|---|
| >= Reporting Level | 64 | 94% | 9% | 95% | 6% |
| Total | 64 | 94% | 9% | 95% | 6% |
| Miscellaneous Statistics for the Samples |
| 3,5-DICHLOROANILINE |
| Characteristic | N | % | % Basis |
|---|---|---|---|
| Plotted | 64 | 100% | Spiked |
| Estimated Values | 2 | 3% | Spiked |
| Deleted Values | 0 | 0% | Spiked + Not Spiked |
| Spiked, Censored | 0 | 0% | Spiked |
| Spiked | 64 | . | |
| False Negatives | 0 | 0% | 0 out of 64 |
| Not Spiked | 100 | . | |
| False Positives | 0 | 0% | 0 out of 100 |
| BQS ORGANIC BLIND SAMPLES |
| 4-CHLORO-2-METHYLPHENOL |
| Permanently Estimated Compound |
| Schedule: 2033 Testid: 61633GCM39 |
| 02/11/09 TO 01/15/13 |
| Open Data Set |
| Statistics for the Plotted Points |
| 4-CHLORO-2-METHYLPHENOL |
| Spike Level | N | Mean | Std-Dev. | Median | F_Pseudo |
|---|---|---|---|---|---|
| >= Reporting Level | 60 | 69% | 12% | 71% | 12% |
| Total | 60 | 69% | 12% | 71% | 12% |
| Miscellaneous Statistics for the Samples |
| 4-CHLORO-2-METHYLPHENOL |
| Characteristic | N | % | % Basis |
|---|---|---|---|
| Plotted | 60 | 100% | Spiked |
| Estimated Values | 60 | 100% | Spiked |
| Deleted Values | 0 | 0% | Spiked + Not Spiked |
| Spiked, Censored | 0 | 0% | Spiked |
| Spiked | 60 | . | |
| False Negatives | 0 | 0% | 0 out of 60 |
| Not Spiked | 104 | . | |
| False Positives | 0 | 0% | 0 out of 104 |
| BQS ORGANIC BLIND SAMPLES |
| AZINPHOS-METHYL-OXON, |
| Schedule: 2033 Testid: 61635GCM39 |
| Measured in MICROGRAMS PER LITER |
| 02/11/09 TO 01/15/13 |
| Open Data Set |
| Statistics for the Plotted Points |
| AZINPHOS-METHYL-OXON |
| Spike Level | N | Mean | Std-Dev. | Median | F_Pseudo |
|---|---|---|---|---|---|
| < Reporting Level | 3 | 81% | 46% | 82% | 68% |
| >= Reporting Level | 35 | 72% | 28% | 66% | 20% |
| Total | 38 | 73% | 29% | 67% | 20% |
| Miscellaneous Statistics for the Samples |
| AZINPHOS-METHYL-OXON |
| Characteristic | N | % | % Basis |
|---|---|---|---|
| Plotted | 38 | 90% | Spiked |
| Estimated Values | 38 | 90% | Spiked |
| Deleted Values | 0 | 0% | Spiked + Not Spiked |
| Spiked, Censored | 1 | 2% | Spiked |
| Spiked | 42 | . | |
| False Negatives | 3 | 7% | 3 out of 42 |
| Not Spiked | 122 | . | |
| False Positives | 1 | 1% | 1 out of 122 |
| BQS ORGANIC BLIND SAMPLES |
| CHLORPYRIFOS, OXYGEN ANALOG |
| Permanently Estimated Compound |
| Schedule: 2033 Testid: 61636GCM39 |
| 02/11/09 TO 12/20/12 |
| Open Data Set |
| Statistics for the Plotted Points |
| CHLORPYRIFOS, OXYGEN ANALOG |
| Spike Level | N | Mean | Std-Dev. | Median | F_Pseudo |
|---|---|---|---|---|---|
| < Reporting Level | 9 | 74% | 20% | 72% | 16% |
| >= Reporting Level | 29 | 53% | 30% | 56% | 37% |
| Total | 38 | 58% | 29% | 60% | 35% |
| Miscellaneous Statistics for the Samples |
| CHLORPYRIFOS, OXYGEN ANALOG |
| Characteristic | N | % | % Basis |
|---|---|---|---|
| Plotted | 38 | 61% | Spiked |
| Estimated Values | 38 | 61% | Spiked |
| Deleted Values | 2 | 1% | Spiked + Not Spiked |
| Spiked, Censored | 1 | 2% | Spiked |
| Spiked | 62 | . | |
| False Negatives | 23 | 37% | 23 out of 62 |
| Not Spiked | 102 | . | |
| False Positives | 1 | 1% | 1 out of 100 |
| BQS ORGANIC BLIND SAMPLES |
| DIAZINON, OXYGEN ANALOG, |
| Schedule: 2033 Testid: 61638GCM14 |
| Measured in MICROGRAMS PER LITER |
| 02/11/09 TO 01/15/13 |
| Open Data Set |
| Statistics for the Plotted Points |
| DIAZINON, OXYGEN ANALOG |
| Spike Level | N | Mean | Std-Dev. | Median | F_Pseudo |
|---|---|---|---|---|---|
| >= Reporting Level | 53 | 86% | 20% | 83% | 19% |
| Total | 53 | 86% | 20% | 83% | 19% |
| Miscellaneous Statistics for the Samples |
| DIAZINON, OXYGEN ANALOG |
| Characteristic | N | % | % Basis |
|---|---|---|---|
| Plotted | 53 | 85% | Spiked |
| Estimated Values | 8 | 13% | Spiked |
| Deleted Values | 0 | 0% | Spiked + Not Spiked |
| Spiked, Censored | 1 | 2% | Spiked |
| Spiked | 62 | . | |
| False Negatives | 8 | 13% | 8 out of 62 |
| Not Spiked | 102 | . | |
| False Positives | 1 | 1% | 1 out of 102 |
| BQS ORGANIC BLIND SAMPLES |
| DISULFOTON SULFONE, |
| Schedule: 2033 Testid: 61640GCM39 |
| Measured in MICROGRAMS PER LITER |
| 02/11/09 TO 01/15/13 |
| Open Data Set |
| Statistics for the Plotted Points |
| DISULFOTON SULFONE |
| Spike Level | N | Mean | Std-Dev. | Median | F_Pseudo |
|---|---|---|---|---|---|
| >= Reporting Level | 61 | 90% | 21% | 89% | 14% |
| Total | 61 | 90% | 21% | 89% | 14% |
| Miscellaneous Statistics for the Samples |
| DISULFOTON SULFONE |
| Characteristic | N | % | % Basis |
|---|---|---|---|
| Plotted | 61 | 100% | Spiked |
| Estimated Values | 1 | 2% | Spiked |
| Deleted Values | 0 | 0% | Spiked + Not Spiked |
| Spiked, Censored | 0 | 0% | Spiked |
| Spiked | 61 | . | |
| False Negatives | 0 | 0% | 0 out of 61 |
| Not Spiked | 103 | . | |
| False Positives | 1 | 1% | 1 out of 103 |
| BQS ORGANIC BLIND SAMPLES |
| ETHION MONOXON |
| Permanently Estimated Compound |
| Schedule: 2033 Testid: 61644GCM39 |
| 03/04/09 TO 06/22/11 |
| Open Data Set |
| Statistics for the Plotted Points |
| ETHION MONOXON |
| Spike Level | N | Mean | Std-Dev. | Median | F_Pseudo |
|---|---|---|---|---|---|
| >= Reporting Level | 13 | 99% | 19% | 102% | 24% |
| Total | 13 | 99% | 19% | 102% | 24% |
| Miscellaneous Statistics for the Samples |
| ETHION MONOXON |
| Characteristic | N | % | % Basis |
|---|---|---|---|
| Plotted | 13 | 100% | Spiked |
| Estimated Values | 13 | 100% | Spiked |
| Deleted Values | 0 | 0% | Spiked + Not Spiked |
| Spiked, Censored | 0 | 0% | Spiked |
| Spiked | 13 | . | |
| False Negatives | 0 | 0% | 0 out of 13 |
| Not Spiked | 151 | . | |
| False Positives | 7 | 5% | 7 out of 151 |
| BQS ORGANIC BLIND SAMPLES |
| FENAMIPHOS SULFONE, |
| Schedule: 2033 Testid: 61645GCM39 |
| Measured in MICROGRAMS PER LITER |
| 02/11/09 TO 12/20/12 |
| Open Data Set |
| Statistics for the Plotted Points |
| FENAMIPHOS SULFONE |
| Spike Level | N | Mean | Std-Dev. | Median | F_Pseudo |
|---|---|---|---|---|---|
| < Reporting Level | 4 | 120% | 56% | 106% | 61% |
| >= Reporting Level | 58 | 92% | 23% | 91% | 23% |
| Total | 62 | 94% | 26% | 91% | 26% |
| Miscellaneous Statistics for the Samples |
| FENAMIPHOS SULFONE |
| Characteristic | N | % | % Basis |
|---|---|---|---|
| Plotted | 62 | 100% | Spiked |
| Estimated Values | 18 | 29% | Spiked |
| Deleted Values | 0 | 0% | Spiked + Not Spiked |
| Spiked, Censored | 0 | 0% | Spiked |
| Spiked | 62 | . | |
| False Negatives | 0 | 0% | 0 out of 62 |
| Not Spiked | 102 | . | |
| False Positives | 0 | 0% | 0 out of 102 |
| BQS ORGANIC BLIND SAMPLES |
| FENAMIPHOS SULFOXIDE |
| Permanently Estimated Compound |
| Schedule: 2033 Testid: 61646GCM39 |
| 03/03/09 TO 12/20/12 |
| Open Data Set |
| Statistics for the Plotted Points |
| FENAMIPHOS SULFOXIDE |
| Spike Level | N | Mean | Std-Dev. | Median | F_Pseudo |
|---|---|---|---|---|---|
| < Reporting Level | 9 | 42% | 26% | 41% | 25% |
| >= Reporting Level | 46 | 27% | 17% | 24% | 11% |
| Total | 55 | 29% | 19% | 25% | 14% |
| Miscellaneous Statistics for the Samples |
| FENAMIPHOS SULFOXIDE |
| Characteristic | N | % | % Basis |
|---|---|---|---|
| Plotted | 55 | 90% | Spiked |
| Estimated Values | 55 | 90% | Spiked |
| Deleted Values | 2 | 1% | Spiked + Not Spiked |
| Spiked, Censored | 1 | 2% | Spiked |
| Spiked | 62 | . | |
| False Negatives | 5 | 8% | 5 out of 61 |
| Not Spiked | 102 | . | |
| False Positives | 3 | 3% | 3 out of 101 |
| BQS ORGANIC BLIND SAMPLES |
| MALAOXON, |
| Schedule: 2033 Testid: 61652GCM39 |
| Measured in MICROGRAMS PER LITER |
| 02/11/09 TO 12/20/12 |
| Open Data Set |

| Statistics for the Plotted Points |
| MALAOXON |
| Spike Level | N | Mean | Std-Dev. | Median | F_Pseudo |
|---|---|---|---|---|---|
| < Reporting Level | 7 | 104% | 20% | 112% | 27% |
| >= Reporting Level | 55 | 92% | 20% | 90% | 17% |
| Total | 62 | 93% | 21% | 91% | 18% |
| Miscellaneous Statistics for the Samples |
| MALAOXON |
| Characteristic | N | % | % Basis |
|---|---|---|---|
| Plotted | 62 | 100% | Spiked |
| Estimated Values | 17 | 27% | Spiked |
| Deleted Values | 0 | 0% | Spiked + Not Spiked |
| Spiked, Censored | 0 | 0% | Spiked |
| Spiked | 62 | . | |
| False Negatives | 0 | 0% | 0 out of 62 |
| Not Spiked | 102 | . | |
| False Positives | 1 | 1% | 1 out of 102 |
| BQS ORGANIC BLIND SAMPLES |
| PARAOXON-METHYL |
| Permanently Estimated Compound |
| Schedule: 2033 Testid: 61664GCM39 |
| 02/11/09 TO 01/15/13 |
| Open Data Set |
| Statistics for the Plotted Points |
| PARAOXON-METHYL |
| Spike Level | N | Mean | Std-Dev. | Median | F_Pseudo |
|---|---|---|---|---|---|
| >= Reporting Level | 61 | 95% | 25% | 96% | 22% |
| Total | 61 | 95% | 25% | 96% | 22% |
| Miscellaneous Statistics for the Samples |
| PARAOXON-METHYL |
| Characteristic | N | % | % Basis |
|---|---|---|---|
| Plotted | 61 | 98% | Spiked |
| Estimated Values | 61 | 98% | Spiked |
| Deleted Values | 0 | 0% | Spiked + Not Spiked |
| Spiked, Censored | 0 | 0% | Spiked |
| Spiked | 62 | . | |
| False Negatives | 1 | 2% | 1 out of 62 |
| Not Spiked | 102 | . | |
| False Positives | 0 | 0% | 0 out of 102 |
| BQS ORGANIC BLIND SAMPLES |
| PHORATE OXON |
| Permanently Estimated Compound |
| Schedule: 2033 Testid: 61666GCM39 |
| 02/11/09 TO 12/20/12 |
| Open Data Set |
| Statistics for the Plotted Points |
| PHORATE OXON |
| Spike Level | N | Mean | Std-Dev. | Median | F_Pseudo |
|---|---|---|---|---|---|
| < Reporting Level | 1 | 118% | . | 118% | 0% |
| >= Reporting Level | 38 | 98% | 23% | 96% | 27% |
| Total | 39 | 98% | 23% | 96% | 27% |
| Miscellaneous Statistics for the Samples |
| PHORATE OXON |
| Characteristic | N | % | % Basis |
|---|---|---|---|
| Plotted | 39 | 100% | Spiked |
| Estimated Values | 39 | 100% | Spiked |
| Deleted Values | 0 | 0% | Spiked + Not Spiked |
| Spiked, Censored | 0 | 0% | Spiked |
| Spiked | 39 | . | |
| False Negatives | 0 | 0% | 0 out of 39 |
| Not Spiked | 125 | . | |
| False Positives | 0 | 0% | 0 out of 125 |
| BQS ORGANIC BLIND SAMPLES |
| PHOSMET OXON |
| Permanently Estimated Compound |
| Schedule: 2033 Testid: 61668GCM39 |
| 02/11/09 TO 12/20/12 |
| Open Data Set |
| Statistics for the Plotted Points |
| PHOSMET OXON |
| Spike Level | N | Mean | Std-Dev. | Median | F_Pseudo |
|---|---|---|---|---|---|
| < Reporting Level | 3 | 35% | 13% | 34% | 19% |
| >= Reporting Level | 25 | 89% | 58% | 87% | 57% |
| Total | 28 | 83% | 57% | 75% | 56% |
| Miscellaneous Statistics for the Samples |
| PHOSMET OXON |
| Characteristic | N | % | % Basis |
|---|---|---|---|
| Plotted | 28 | 76% | Spiked |
| Estimated Values | 28 | 76% | Spiked |
| Deleted Values | 7 | 4% | Spiked + Not Spiked |
| Spiked, Censored | 1 | 3% | Spiked |
| Spiked | 39 | . | |
| False Negatives | 8 | 22% | 8 out of 37 |
| Not Spiked | 125 | . | |
| False Positives | 0 | 0% | 0 out of 120 |
| BQS ORGANIC BLIND SAMPLES |
| TERBUFOS-O-ANALOGUE SULFONE, |
| Schedule: 2033 Testid: 61674GCM39 |
| Measured in MICROGRAMS PER LITER |
| 03/04/09 TO 01/15/13 |
| Open Data Set |
| Statistics for the Plotted Points |
| TERBUFOS-O-ANALOGUE SULFONE |
| Spike Level | N | Mean | Std-Dev. | Median | F_Pseudo |
|---|---|---|---|---|---|
| < Reporting Level | 6 | 106% | 21% | 105% | 11% |
| >= Reporting Level | 12 | 94% | 27% | 89% | 24% |
| Total | 18 | 98% | 25% | 102% | 19% |
| Miscellaneous Statistics for the Samples |
| TERBUFOS-O-ANALOGUE SULFONE |
| Characteristic | N | % | % Basis |
|---|---|---|---|
| Plotted | 18 | 82% | Spiked |
| Estimated Values | 1 | 5% | Spiked |
| Deleted Values | 0 | 0% | Spiked + Not Spiked |
| Spiked, Censored | 0 | 0% | Spiked |
| Spiked | 22 | . | |
| False Negatives | 4 | 18% | 4 out of 22 |
| Not Spiked | 142 | . | |
| False Positives | 0 | 0% | 0 out of 142 |
| BQS ORGANIC BLIND SAMPLES |
| FIPRONIL, |
| Schedule: 2033 Testid: 62166GCM29 |
| Measured in MICROGRAMS PER LITER |
| 02/11/09 TO 01/15/13 |
| Open Data Set |
| Statistics for the Plotted Points |
| FIPRONIL |
| Spike Level | N | Mean | Std-Dev. | Median | F_Pseudo |
|---|---|---|---|---|---|
| >= Reporting Level | 76 | 98% | 23% | 97% | 21% |
| Total | 76 | 98% | 23% | 97% | 21% |
| Miscellaneous Statistics for the Samples |
| FIPRONIL |
| Characteristic | N | % | % Basis |
|---|---|---|---|
| Plotted | 76 | 99% | Spiked |
| Estimated Values | 76 | 99% | Spiked |
| Deleted Values | 0 | 0% | Spiked + Not Spiked |
| Spiked, Censored | 0 | 0% | Spiked |
| Spiked | 77 | . | |
| False Negatives | 1 | 1% | 1 out of 77 |
| Not Spiked | 87 | . | |
| False Positives | 3 | 3% | 3 out of 87 |
| BQS ORGANIC BLIND SAMPLES |
| FIPRONIL SULFIDE, |
| Schedule: 2033 Testid: 62167GCM29 |
| Measured in MICROGRAMS PER LITER |
| 02/11/09 TO 01/15/13 |
| Open Data Set |
| Statistics for the Plotted Points |
| FIPRONIL SULFIDE |
| Spike Level | N | Mean | Std-Dev. | Median | F_Pseudo |
|---|---|---|---|---|---|
| >= Reporting Level | 59 | 102% | 21% | 102% | 19% |
| Total | 59 | 102% | 21% | 102% | 19% |
| Miscellaneous Statistics for the Samples |
| FIPRONIL SULFIDE |
| Characteristic | N | % | % Basis |
|---|---|---|---|
| Plotted | 59 | 98% | Spiked |
| Estimated Values | 1 | 2% | Spiked |
| Deleted Values | 0 | 0% | Spiked + Not Spiked |
| Spiked, Censored | 0 | 0% | Spiked |
| Spiked | 60 | . | |
| False Negatives | 1 | 2% | 1 out of 60 |
| Not Spiked | 104 | . | |
| False Positives | 31 | 30% | 31 out of 104 |
| BQS ORGANIC BLIND SAMPLES |
| FIPRONIL SULFONE, |
| Schedule: 2033 Testid: 62168GCM29 |
| Measured in MICROGRAMS PER LITER |
| 02/11/09 TO 01/15/13 |
| Open Data Set |
| Statistics for the Plotted Points |
| FIPRONIL SULFONE |
| Spike Level | N | Mean | Std-Dev. | Median | F_Pseudo |
|---|---|---|---|---|---|
| >= Reporting Level | 65 | 82% | 23% | 79% | 23% |
| Total | 65 | 82% | 23% | 79% | 23% |
| Miscellaneous Statistics for the Samples |
| FIPRONIL SULFONE |
| Characteristic | N | % | % Basis |
|---|---|---|---|
| Plotted | 65 | 98% | Spiked |
| Estimated Values | 6 | 9% | Spiked |
| Deleted Values | 0 | 0% | Spiked + Not Spiked |
| Spiked, Censored | 0 | 0% | Spiked |
| Spiked | 66 | . | |
| False Negatives | 1 | 2% | 1 out of 66 |
| Not Spiked | 98 | . | |
| False Positives | 10 | 10% | 10 out of 98 |
| BQS ORGANIC BLIND SAMPLES |
| DESULFINYLFIPRONIL AMIDE, |
| Schedule: 2033 Testid: 62169GCM29 |
| Measured in MICROGRAMS PER LITER |
| 03/04/09 TO 06/22/11 |
| Open Data Set |
| Statistics for the Plotted Points |
| DESULFINYLFIPRONIL AMIDE |
| Spike Level | N | Mean | Std-Dev. | Median | F_Pseudo |
|---|---|---|---|---|---|
| < Reporting Level | 1 | 144% | . | 144% | 0% |
| >= Reporting Level | 12 | 99% | 30% | 101% | 30% |
| Total | 13 | 102% | 31% | 101% | 30% |
| Miscellaneous Statistics for the Samples |
| DESULFINYLFIPRONIL AMIDE |
| Characteristic | N | % | % Basis |
|---|---|---|---|
| Plotted | 13 | 100% | Spiked |
| Estimated Values | 12 | 92% | Spiked |
| Deleted Values | 0 | 0% | Spiked + Not Spiked |
| Spiked, Censored | 0 | 0% | Spiked |
| Spiked | 13 | . | |
| False Negatives | 0 | 0% | 0 out of 13 |
| Not Spiked | 151 | . | |
| False Positives | 0 | 0% | 0 out of 151 |
| BQS ORGANIC BLIND SAMPLES |
| DESULFINYLFIPRONIL, |
| Schedule: 2033 Testid: 62170GCM29 |
| Measured in MICROGRAMS PER LITER |
| 02/11/09 TO 01/15/13 |
| Open Data Set |
| Statistics for the Plotted Points |
| DESULFINYLFIPRONIL |
| Spike Level | N | Mean | Std-Dev. | Median | F_Pseudo |
|---|---|---|---|---|---|
| >= Reporting Level | 45 | 90% | 20% | 89% | 23% |
| Total | 45 | 90% | 20% | 89% | 23% |
| Miscellaneous Statistics for the Samples |
| DESULFINYLFIPRONIL |
| Characteristic | N | % | % Basis |
|---|---|---|---|
| Plotted | 45 | 100% | Spiked |
| Estimated Values | 0 | 0% | Spiked |
| Deleted Values | 0 | 0% | Spiked + Not Spiked |
| Spiked, Censored | 0 | 0% | Spiked |
| Spiked | 45 | . | |
| False Negatives | 0 | 0% | 0 out of 45 |
| Not Spiked | 119 | . | |
| False Positives | 1 | 1% | 1 out of 119 |
| BQS ORGANIC BLIND SAMPLES |
| TEBUCONAZOLE, |
| Schedule: 2033 Testid: 62852GCM14 |
| Measured in MICROGRAMS PER LITER |
| 02/11/09 TO 12/20/12 |
| Open Data Set |
| Statistics for the Plotted Points |
| TEBUCONAZOLE |
| Spike Level | N | Mean | Std-Dev. | Median | F_Pseudo |
|---|---|---|---|---|---|
| >= Reporting Level | 38 | 63% | 15% | 60% | 8% |
| Total | 38 | 63% | 15% | 60% | 8% |
| Miscellaneous Statistics for the Samples |
| TEBUCONAZOLE |
| Characteristic | N | % | % Basis |
|---|---|---|---|
| Plotted | 38 | 100% | Spiked |
| Estimated Values | 2 | 5% | Spiked |
| Deleted Values | 0 | 0% | Spiked + Not Spiked |
| Spiked, Censored | 0 | 0% | Spiked |
| Spiked | 38 | . | |
| False Negatives | 0 | 0% | 0 out of 38 |
| Not Spiked | 126 | . | |
| False Positives | 0 | 0% | 0 out of 126 |
| BQS ORGANIC BLIND SAMPLES |
| CIS-PROPICONAZOLE |
| Permanently Estimated Compound |
| Schedule: 2033 Testid: 79846GCM40 |
| 03/04/09 TO 12/20/12 |
| Open Data Set |
| Statistics for the Plotted Points |
| CIS-PROPICONAZOLE |
| Spike Level | N | Mean | Std-Dev. | Median | F_Pseudo |
|---|---|---|---|---|---|
| < Reporting Level | 1 | 179% | . | 179% | 0% |
| >= Reporting Level | 29 | 78% | 53% | 54% | 53% |
| Total | 30 | 81% | 55% | 54% | 75% |
| Miscellaneous Statistics for the Samples |
| CIS-PROPICONAZOLE |
| Characteristic | N | % | % Basis |
|---|---|---|---|
| Plotted | 30 | 100% | Spiked |
| Estimated Values | 30 | 100% | Spiked |
| Deleted Values | 0 | 0% | Spiked + Not Spiked |
| Spiked, Censored | 0 | 0% | Spiked |
| Spiked | 30 | . | |
| False Negatives | 0 | 0% | 0 out of 30 |
| Not Spiked | 134 | . | |
| False Positives | 0 | 0% | 0 out of 134 |
| BQS ORGANIC BLIND SAMPLES |
| TRANS-PROPICONAZOLE |
| Permanently Estimated Compound |
| Schedule: 2033 Testid: 79847GCM40 |
| 03/04/09 TO 12/20/12 |
| Open Data Set |
| Statistics for the Plotted Points |
| TRANS-PROPICONAZOLE |
| Spike Level | N | Mean | Std-Dev. | Median | F_Pseudo |
|---|---|---|---|---|---|
| >= Reporting Level | 30 | 78% | 17% | 80% | 21% |
| Total | 30 | 78% | 17% | 80% | 21% |
| Miscellaneous Statistics for the Samples |
| TRANS-PROPICONAZOLE |
| Characteristic | N | % | % Basis |
|---|---|---|---|
| Plotted | 30 | 100% | Spiked |
| Estimated Values | 30 | 100% | Spiked |
| Deleted Values | 0 | 0% | Spiked + Not Spiked |
| Spiked, Censored | 0 | 0% | Spiked |
| Spiked | 30 | . | |
| False Negatives | 0 | 0% | 0 out of 30 |
| Not Spiked | 134 | . | |
| False Positives | 0 | 0% | 0 out of 134 |
| BQS ORGANIC BLIND SAMPLES |
| ETHION, |
| Schedule: 2033 Testid: 82346GCM40 |
| Measured in MICROGRAMS PER LITER |
| 02/18/09 TO 01/15/13 |
| Open Data Set |
| Statistics for the Plotted Points |
| ETHION |
| Spike Level | N | Mean | Std-Dev. | Median | F_Pseudo |
|---|---|---|---|---|---|
| >= Reporting Level | 63 | 84% | 17% | 83% | 13% |
| Total | 63 | 84% | 17% | 83% | 13% |
| Miscellaneous Statistics for the Samples |
| ETHION |
| Characteristic | N | % | % Basis |
|---|---|---|---|
| Plotted | 63 | 100% | Spiked |
| Estimated Values | 0 | 0% | Spiked |
| Deleted Values | 0 | 0% | Spiked + Not Spiked |
| Spiked, Censored | 0 | 0% | Spiked |
| Spiked | 63 | . | |
| False Negatives | 0 | 0% | 0 out of 63 |
| Not Spiked | 101 | . | |
| False Positives | 2 | 2% | 2 out of 101 |
| BQS ORGANIC BLIND SAMPLES |
| METRIBUZIN, |
| Schedule: 2033 Testid: 82630GCM35 |
| Measured in MICROGRAMS PER LITER |
| 02/11/09 TO 01/15/13 |
| Open Data Set |
| Statistics for the Plotted Points |
| METRIBUZIN |
| Spike Level | N | Mean | Std-Dev. | Median | F_Pseudo |
|---|---|---|---|---|---|
| >= Reporting Level | 62 | 95% | 19% | 96% | 17% |
| Total | 62 | 95% | 19% | 96% | 17% |
| Miscellaneous Statistics for the Samples |
| METRIBUZIN |
| Characteristic | N | % | % Basis |
|---|---|---|---|
| Plotted | 62 | 100% | Spiked |
| Estimated Values | 2 | 3% | Spiked |
| Deleted Values | 0 | 0% | Spiked + Not Spiked |
| Spiked, Censored | 0 | 0% | Spiked |
| Spiked | 62 | . | |
| False Negatives | 0 | 0% | 0 out of 62 |
| Not Spiked | 102 | . | |
| False Positives | 0 | 0% | 0 out of 102 |
| BQS ORGANIC BLIND SAMPLES |
| 2,6-DIETHYLANILINE, |
| Schedule: 2033 Testid: 82660GCM35 |
| Measured in MICROGRAMS PER LITER |
| 02/18/09 TO 01/15/13 |
| Open Data Set |
| Statistics for the Plotted Points |
| 2,6-DIETHYLANILINE |
| Spike Level | N | Mean | Std-Dev. | Median | F_Pseudo |
|---|---|---|---|---|---|
| >= Reporting Level | 61 | 95% | 24% | 98% | 13% |
| Total | 61 | 95% | 24% | 98% | 13% |
| Miscellaneous Statistics for the Samples |
| 2,6-DIETHYLANILINE |
| Characteristic | N | % | % Basis |
|---|---|---|---|
| Plotted | 61 | 95% | Spiked |
| Estimated Values | 7 | 11% | Spiked |
| Deleted Values | 0 | 0% | Spiked + Not Spiked |
| Spiked, Censored | 0 | 0% | Spiked |
| Spiked | 64 | . | |
| False Negatives | 3 | 5% | 3 out of 64 |
| Not Spiked | 100 | . | |
| False Positives | 0 | 0% | 0 out of 100 |
| BQS ORGANIC BLIND SAMPLES |
| TRIFLURALIN, |
| Schedule: 2033 Testid: 82661GCM35 |
| Measured in MICROGRAMS PER LITER |
| 02/18/09 TO 12/20/12 |
| Open Data Set |
| Statistics for the Plotted Points |
| TRIFLURALIN |
| Spike Level | N | Mean | Std-Dev. | Median | F_Pseudo |
|---|---|---|---|---|---|
| < Reporting Level | 8 | 130% | 17% | 126% | 13% |
| >= Reporting Level | 55 | 100% | 18% | 100% | 17% |
| Total | 63 | 104% | 20% | 103% | 17% |
| Miscellaneous Statistics for the Samples |
| TRIFLURALIN |
| Characteristic | N | % | % Basis |
|---|---|---|---|
| Plotted | 63 | 100% | Spiked |
| Estimated Values | 5 | 8% | Spiked |
| Deleted Values | 0 | 0% | Spiked + Not Spiked |
| Spiked, Censored | 0 | 0% | Spiked |
| Spiked | 63 | . | |
| False Negatives | 0 | 0% | 0 out of 63 |
| Not Spiked | 101 | . | |
| False Positives | 1 | 1% | 1 out of 101 |
| BQS ORGANIC BLIND SAMPLES |
| DIMETHOATE |
| Permanently Estimated Compound |
| Schedule: 2033 Testid: 82662GCM40 |
| 02/18/09 TO 01/15/13 |
| Open Data Set |
| Statistics for the Plotted Points |
| DIMETHOATE |
| Spike Level | N | Mean | Std-Dev. | Median | F_Pseudo |
|---|---|---|---|---|---|
| >= Reporting Level | 64 | 51% | 16% | 52% | 16% |
| Total | 64 | 51% | 16% | 52% | 16% |
| Miscellaneous Statistics for the Samples |
| DIMETHOATE |
| Characteristic | N | % | % Basis |
|---|---|---|---|
| Plotted | 64 | 100% | Spiked |
| Estimated Values | 64 | 100% | Spiked |
| Deleted Values | 0 | 0% | Spiked + Not Spiked |
| Spiked, Censored | 0 | 0% | Spiked |
| Spiked | 64 | . | |
| False Negatives | 0 | 0% | 0 out of 64 |
| Not Spiked | 100 | . | |
| False Positives | 0 | 0% | 0 out of 100 |
| BQS ORGANIC BLIND SAMPLES |
| PHORATE, |
| Schedule: 2033 Testid: 82664GCM35 |
| Measured in MICROGRAMS PER LITER |
| 02/11/09 TO 12/20/12 |
| Open Data Set |
| Statistics for the Plotted Points |
| PHORATE |
| Spike Level | N | Mean | Std-Dev. | Median | F_Pseudo |
|---|---|---|---|---|---|
| >= Reporting Level | 62 | 76% | 17% | 81% | 16% |
| Total | 62 | 76% | 17% | 81% | 16% |
| Miscellaneous Statistics for the Samples |
| PHORATE |
| Characteristic | N | % | % Basis |
|---|---|---|---|
| Plotted | 62 | 100% | Spiked |
| Estimated Values | 2 | 3% | Spiked |
| Deleted Values | 0 | 0% | Spiked + Not Spiked |
| Spiked, Censored | 0 | 0% | Spiked |
| Spiked | 62 | . | |
| False Negatives | 0 | 0% | 0 out of 62 |
| Not Spiked | 102 | . | |
| False Positives | 0 | 0% | 0 out of 102 |
| BQS ORGANIC BLIND SAMPLES |
| PARATHION-METHYL, |
| Schedule: 2033 Testid: 82667GCM35 |
| Measured in MICROGRAMS PER LITER |
| 02/18/09 TO 01/15/13 |
| Open Data Set |
| Statistics for the Plotted Points |
| PARATHION-METHYL |
| Spike Level | N | Mean | Std-Dev. | Median | F_Pseudo |
|---|---|---|---|---|---|
| >= Reporting Level | 65 | 99% | 19% | 96% | 18% |
| Total | 65 | 99% | 19% | 96% | 18% |
| Miscellaneous Statistics for the Samples |
| PARATHION-METHYL |
| Characteristic | N | % | % Basis |
|---|---|---|---|
| Plotted | 65 | 100% | Spiked |
| Estimated Values | 7 | 11% | Spiked |
| Deleted Values | 0 | 0% | Spiked + Not Spiked |
| Spiked, Censored | 0 | 0% | Spiked |
| Spiked | 65 | . | |
| False Negatives | 0 | 0% | 0 out of 65 |
| Not Spiked | 99 | . | |
| False Positives | 0 | 0% | 0 out of 99 |
| BQS ORGANIC BLIND SAMPLES |
| EPTC, |
| Schedule: 2033 Testid: 82668GCM35 |
| Measured in MICROGRAMS PER LITER |
| 02/11/09 TO 01/15/13 |
| Open Data Set |
| Statistics for the Plotted Points |
| EPTC |
| Spike Level | N | Mean | Std-Dev. | Median | F_Pseudo |
|---|---|---|---|---|---|
| >= Reporting Level | 60 | 104% | 14% | 101% | 10% |
| Total | 60 | 104% | 14% | 101% | 10% |
| Miscellaneous Statistics for the Samples |
| EPTC |
| Characteristic | N | % | % Basis |
|---|---|---|---|
| Plotted | 60 | 100% | Spiked |
| Estimated Values | 7 | 12% | Spiked |
| Deleted Values | 0 | 0% | Spiked + Not Spiked |
| Spiked, Censored | 0 | 0% | Spiked |
| Spiked | 60 | . | |
| False Negatives | 0 | 0% | 0 out of 60 |
| Not Spiked | 104 | . | |
| False Positives | 0 | 0% | 0 out of 104 |
| BQS ORGANIC BLIND SAMPLES |
| TEBUTHIURON, |
| Schedule: 2033 Testid: 82670GCM35 |
| Measured in MICROGRAMS PER LITER |
| 02/11/09 TO 12/20/12 |
| Open Data Set |
| Statistics for the Plotted Points |
| TEBUTHIURON |
| Spike Level | N | Mean | Std-Dev. | Median | F_Pseudo |
|---|---|---|---|---|---|
| < Reporting Level | 1 | 200% | . | 200% | 0% |
| >= Reporting Level | 60 | 143% | 31% | 139% | 35% |
| Total | 61 | 144% | 31% | 140% | 34% |
| Miscellaneous Statistics for the Samples |
| TEBUTHIURON |
| Characteristic | N | % | % Basis |
|---|---|---|---|
| Plotted | 61 | 100% | Spiked |
| Estimated Values | 19 | 31% | Spiked |
| Deleted Values | 0 | 0% | Spiked + Not Spiked |
| Spiked, Censored | 0 | 0% | Spiked |
| Spiked | 61 | . | |
| False Negatives | 0 | 0% | 0 out of 61 |
| Not Spiked | 103 | . | |
| False Positives | 0 | 0% | 0 out of 103 |
| BQS ORGANIC BLIND SAMPLES |
| MOLINATE, |
| Schedule: 2033 Testid: 82671GCM35 |
| Measured in MICROGRAMS PER LITER |
| 02/11/09 TO 01/15/13 |
| Open Data Set |
| Statistics for the Plotted Points |
| MOLINATE |
| Spike Level | N | Mean | Std-Dev. | Median | F_Pseudo |
|---|---|---|---|---|---|
| >= Reporting Level | 59 | 100% | 12% | 100% | 10% |
| Total | 59 | 100% | 12% | 100% | 10% |
| Miscellaneous Statistics for the Samples |
| MOLINATE |
| Characteristic | N | % | % Basis |
|---|---|---|---|
| Plotted | 59 | 98% | Spiked |
| Estimated Values | 1 | 2% | Spiked |
| Deleted Values | 0 | 0% | Spiked + Not Spiked |
| Spiked, Censored | 0 | 0% | Spiked |
| Spiked | 60 | . | |
| False Negatives | 1 | 2% | 1 out of 60 |
| Not Spiked | 104 | . | |
| False Positives | 0 | 0% | 0 out of 104 |
| BQS ORGANIC BLIND SAMPLES |
| ETHOPROPHOS, |
| Schedule: 2033 Testid: 82672GCM35 |
| Measured in MICROGRAMS PER LITER |
| 02/11/09 TO 01/15/13 |
| Open Data Set |
| Statistics for the Plotted Points |
| ETHOPROPHOS |
| Spike Level | N | Mean | Std-Dev. | Median | F_Pseudo |
|---|---|---|---|---|---|
| >= Reporting Level | 59 | 110% | 21% | 108% | 17% |
| Total | 59 | 110% | 21% | 108% | 17% |
| Miscellaneous Statistics for the Samples |
| ETHOPROPHOS |
| Characteristic | N | % | % Basis |
|---|---|---|---|
| Plotted | 59 | 95% | Spiked |
| Estimated Values | 7 | 11% | Spiked |
| Deleted Values | 0 | 0% | Spiked + Not Spiked |
| Spiked, Censored | 2 | 3% | Spiked |
| Spiked | 62 | . | |
| False Negatives | 1 | 2% | 1 out of 62 |
| Not Spiked | 102 | . | |
| False Positives | 2 | 2% | 2 out of 102 |
| BQS ORGANIC BLIND SAMPLES |
| BENFLURALIN, |
| Schedule: 2033 Testid: 82673GCM35 |
| Measured in MICROGRAMS PER LITER |
| 02/11/09 TO 01/15/13 |
| Open Data Set |
| Statistics for the Plotted Points |
| BENFLURALIN |
| Spike Level | N | Mean | Std-Dev. | Median | F_Pseudo |
|---|---|---|---|---|---|
| >= Reporting Level | 62 | 84% | 13% | 83% | 12% |
| Total | 62 | 84% | 13% | 83% | 12% |
| Miscellaneous Statistics for the Samples |
| BENFLURALIN |
| Characteristic | N | % | % Basis |
|---|---|---|---|
| Plotted | 62 | 100% | Spiked |
| Estimated Values | 1 | 2% | Spiked |
| Deleted Values | 0 | 0% | Spiked + Not Spiked |
| Spiked, Censored | 0 | 0% | Spiked |
| Spiked | 62 | . | |
| False Negatives | 0 | 0% | 0 out of 62 |
| Not Spiked | 102 | . | |
| False Positives | 0 | 0% | 0 out of 102 |
| BQS ORGANIC BLIND SAMPLES |
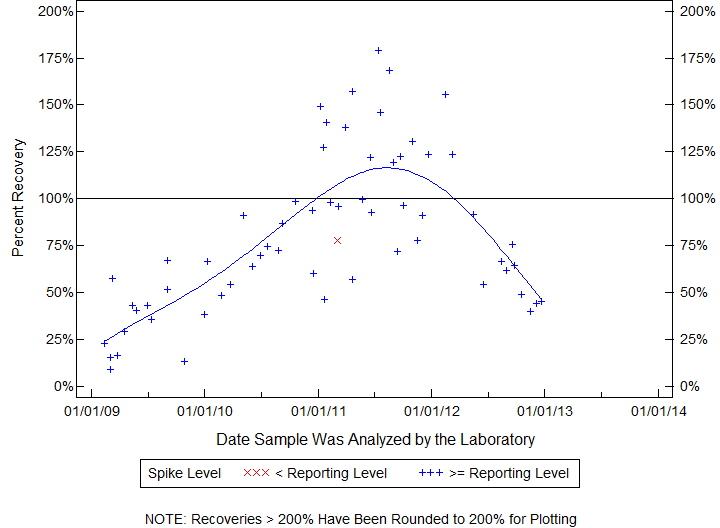
| CARBOFURAN |
| Permanently Estimated Compound |
| Schedule: 2033 Testid: 82674GCM35 |
| 02/11/09 TO 12/20/12 |
| Open Data Set |
| Statistics for the Plotted Points |
| CARBOFURAN |
| Spike Level | N | Mean | Std-Dev. | Median | F_Pseudo |
|---|---|---|---|---|---|
| < Reporting Level | 4 | 133% | 15% | 138% | 13% |
| >= Reporting Level | 57 | 108% | 21% | 108% | 14% |
| Total | 61 | 110% | 21% | 109% | 15% |
| Miscellaneous Statistics for the Samples |
| CARBOFURAN |
| Characteristic | N | % | % Basis |
|---|---|---|---|
| Plotted | 61 | 100% | Spiked |
| Estimated Values | 61 | 100% | Spiked |
| Deleted Values | 0 | 0% | Spiked + Not Spiked |
| Spiked, Censored | 0 | 0% | Spiked |
| Spiked | 61 | . | |
| False Negatives | 0 | 0% | 0 out of 61 |
| Not Spiked | 103 | . | |
| False Positives | 0 | 0% | 0 out of 103 |
| BQS ORGANIC BLIND SAMPLES |
| TERBUFOS, |
| Schedule: 2033 Testid: 82675GCM35 |
| Measured in MICROGRAMS PER LITER |
| 02/11/09 TO 12/20/12 |
| Open Data Set |
| Statistics for the Plotted Points |
| TERBUFOS |
| Spike Level | N | Mean | Std-Dev. | Median | F_Pseudo |
|---|---|---|---|---|---|
| >= Reporting Level | 60 | 69% | 19% | 66% | 15% |
| Total | 60 | 69% | 19% | 66% | 15% |
| Miscellaneous Statistics for the Samples |
| TERBUFOS |
| Characteristic | N | % | % Basis |
|---|---|---|---|
| Plotted | 60 | 98% | Spiked |
| Estimated Values | 2 | 3% | Spiked |
| Deleted Values | 0 | 0% | Spiked + Not Spiked |
| Spiked, Censored | 0 | 0% | Spiked |
| Spiked | 61 | . | |
| False Negatives | 1 | 2% | 1 out of 61 |
| Not Spiked | 103 | . | |
| False Positives | 1 | 1% | 1 out of 103 |
| BQS ORGANIC BLIND SAMPLES |
| PROPYZAMIDE (PRONAMIDE), |
| Schedule: 2033 Testid: 82676GCM35 |
| Measured in MICROGRAMS PER LITER |
| 02/11/09 TO 01/15/13 |
| Open Data Set |
| Statistics for the Plotted Points |
| PROPYZAMIDE (PRONAMIDE) |
| Spike Level | N | Mean | Std-Dev. | Median | F_Pseudo |
|---|---|---|---|---|---|
| >= Reporting Level | 60 | 93% | 14% | 92% | 16% |
| Total | 60 | 93% | 14% | 92% | 16% |
| Miscellaneous Statistics for the Samples |
| PROPYZAMIDE (PRONAMIDE) |
| Characteristic | N | % | % Basis |
|---|---|---|---|
| Plotted | 60 | 100% | Spiked |
| Estimated Values | 1 | 2% | Spiked |
| Deleted Values | 0 | 0% | Spiked + Not Spiked |
| Spiked, Censored | 0 | 0% | Spiked |
| Spiked | 60 | . | |
| False Negatives | 0 | 0% | 0 out of 60 |
| Not Spiked | 104 | . | |
| False Positives | 0 | 0% | 0 out of 104 |
| BQS ORGANIC BLIND SAMPLES |
| DISULFOTON |
| Permanently Estimated Compound |
| Schedule: 2033 Testid: 82677GCM35 |
| 02/11/09 TO 12/20/12 |
| Open Data Set |
| Statistics for the Plotted Points |
| DISULFOTON |
| Spike Level | N | Mean | Std-Dev. | Median | F_Pseudo |
|---|---|---|---|---|---|
| < Reporting Level | 2 | 68% | 12% | 68% | 13% |
| >= Reporting Level | 60 | 59% | 20% | 62% | 14% |
| Total | 62 | 59% | 20% | 62% | 14% |
| Miscellaneous Statistics for the Samples |
| DISULFOTON |
| Characteristic | N | % | % Basis |
|---|---|---|---|
| Plotted | 62 | 100% | Spiked |
| Estimated Values | 62 | 100% | Spiked |
| Deleted Values | 0 | 0% | Spiked + Not Spiked |
| Spiked, Censored | 0 | 0% | Spiked |
| Spiked | 62 | . | |
| False Negatives | 0 | 0% | 0 out of 62 |
| Not Spiked | 102 | . | |
| False Positives | 0 | 0% | 0 out of 102 |
| BQS ORGANIC BLIND SAMPLES |
| PROPANIL, |
| Schedule: 2033 Testid: 82679GCM35 |
| Measured in MICROGRAMS PER LITER |
| 02/18/09 TO 01/15/13 |
| Open Data Set |
| Statistics for the Plotted Points |
| PROPANIL |
| Spike Level | N | Mean | Std-Dev. | Median | F_Pseudo |
|---|---|---|---|---|---|
| >= Reporting Level | 64 | 115% | 20% | 114% | 20% |
| Total | 64 | 115% | 20% | 114% | 20% |
| Miscellaneous Statistics for the Samples |
| PROPANIL |
| Characteristic | N | % | % Basis |
|---|---|---|---|
| Plotted | 64 | 100% | Spiked |
| Estimated Values | 2 | 3% | Spiked |
| Deleted Values | 0 | 0% | Spiked + Not Spiked |
| Spiked, Censored | 0 | 0% | Spiked |
| Spiked | 64 | . | |
| False Negatives | 0 | 0% | 0 out of 64 |
| Not Spiked | 100 | . | |
| False Positives | 0 | 0% | 0 out of 100 |
| BQS ORGANIC BLIND SAMPLES |
| CARBARYL |
| Permanently Estimated Compound |
| Schedule: 2033 Testid: 82680GCM35 |
| 02/11/09 TO 12/20/12 |
| Open Data Set |
| Statistics for the Plotted Points |
| CARBARYL |
| Spike Level | N | Mean | Std-Dev. | Median | F_Pseudo |
|---|---|---|---|---|---|
| < Reporting Level | 16 | 119% | 21% | 119% | 24% |
| >= Reporting Level | 46 | 88% | 19% | 91% | 19% |
| Total | 62 | 96% | 24% | 96% | 24% |
| Miscellaneous Statistics for the Samples |
| CARBARYL |
| Characteristic | N | % | % Basis |
|---|---|---|---|
| Plotted | 62 | 100% | Spiked |
| Estimated Values | 62 | 100% | Spiked |
| Deleted Values | 0 | 0% | Spiked + Not Spiked |
| Spiked, Censored | 0 | 0% | Spiked |
| Spiked | 62 | . | |
| False Negatives | 0 | 0% | 0 out of 62 |
| Not Spiked | 102 | . | |
| False Positives | 1 | 1% | 1 out of 102 |
| BQS ORGANIC BLIND SAMPLES |
| THIOBENCARB, |
| Schedule: 2033 Testid: 82681GCM35 |
| Measured in MICROGRAMS PER LITER |
| 02/11/09 TO 01/15/13 |
| Open Data Set |
| Statistics for the Plotted Points |
| THIOBENCARB |
| Spike Level | N | Mean | Std-Dev. | Median | F_Pseudo |
|---|---|---|---|---|---|
| >= Reporting Level | 62 | 98% | 22% | 96% | 19% |
| Total | 62 | 98% | 22% | 96% | 19% |
| Miscellaneous Statistics for the Samples |
| THIOBENCARB |
| Characteristic | N | % | % Basis |
|---|---|---|---|
| Plotted | 62 | 100% | Spiked |
| Estimated Values | 0 | 0% | Spiked |
| Deleted Values | 0 | 0% | Spiked + Not Spiked |
| Spiked, Censored | 0 | 0% | Spiked |
| Spiked | 62 | . | |
| False Negatives | 0 | 0% | 0 out of 62 |
| Not Spiked | 102 | . | |
| False Positives | 5 | 5% | 5 out of 102 |
| BQS ORGANIC BLIND SAMPLES |
| DACTHAL, |
| Schedule: 2033 Testid: 82682GCM35 |
| Measured in MICROGRAMS PER LITER |
| 02/11/09 TO 01/15/13 |
| Open Data Set |
| Statistics for the Plotted Points |
| DACTHAL |
| Spike Level | N | Mean | Std-Dev. | Median | F_Pseudo |
|---|---|---|---|---|---|
| >= Reporting Level | 60 | 102% | 13% | 101% | 14% |
| Total | 60 | 102% | 13% | 101% | 14% |
| Miscellaneous Statistics for the Samples |
| DACTHAL |
| Characteristic | N | % | % Basis |
|---|---|---|---|
| Plotted | 60 | 100% | Spiked |
| Estimated Values | 2 | 3% | Spiked |
| Deleted Values | 0 | 0% | Spiked + Not Spiked |
| Spiked, Censored | 0 | 0% | Spiked |
| Spiked | 60 | . | |
| False Negatives | 0 | 0% | 0 out of 60 |
| Not Spiked | 104 | . | |
| False Positives | 0 | 0% | 0 out of 104 |
| BQS ORGANIC BLIND SAMPLES |
| PENDIMETHALIN, |
| Schedule: 2033 Testid: 82683GCM35 |
| Measured in MICROGRAMS PER LITER |
| 02/11/09 TO 01/15/13 |
| Open Data Set |
| Statistics for the Plotted Points |
| PENDIMETHALIN |
| Spike Level | N | Mean | Std-Dev. | Median | F_Pseudo |
|---|---|---|---|---|---|
| >= Reporting Level | 62 | 100% | 21% | 96% | 21% |
| Total | 62 | 100% | 21% | 96% | 21% |
| Miscellaneous Statistics for the Samples |
| PENDIMETHALIN |
| Characteristic | N | % | % Basis |
|---|---|---|---|
| Plotted | 62 | 100% | Spiked |
| Estimated Values | 1 | 2% | Spiked |
| Deleted Values | 0 | 0% | Spiked + Not Spiked |
| Spiked, Censored | 0 | 0% | Spiked |
| Spiked | 62 | . | |
| False Negatives | 0 | 0% | 0 out of 62 |
| Not Spiked | 102 | . | |
| False Positives | 0 | 0% | 0 out of 102 |
| BQS ORGANIC BLIND SAMPLES |
| PROPARGITE, |
| Schedule: 2033 Testid: 82685GCM35 |
| Measured in MICROGRAMS PER LITER |
| 02/11/09 TO 12/20/12 |
| Open Data Set |
| Statistics for the Plotted Points |
| PROPARGITE |
| Spike Level | N | Mean | Std-Dev. | Median | F_Pseudo |
|---|---|---|---|---|---|
| >= Reporting Level | 61 | 87% | 35% | 83% | 35% |
| Total | 61 | 87% | 35% | 83% | 35% |
| Miscellaneous Statistics for the Samples |
| PROPARGITE |
| Characteristic | N | % | % Basis |
|---|---|---|---|
| Plotted | 61 | 98% | Spiked |
| Estimated Values | 4 | 6% | Spiked |
| Deleted Values | 0 | 0% | Spiked + Not Spiked |
| Spiked, Censored | 1 | 2% | Spiked |
| Spiked | 62 | . | |
| False Negatives | 0 | 0% | 0 out of 62 |
| Not Spiked | 102 | . | |
| False Positives | 0 | 0% | 0 out of 102 |
| BQS ORGANIC BLIND SAMPLES |
| AZINPHOS-METHYL, |
| Schedule: 2033 Testid: 82686GCM35 |
| Measured in MICROGRAMS PER LITER |
| 02/11/09 TO 12/20/12 |
| Open Data Set |
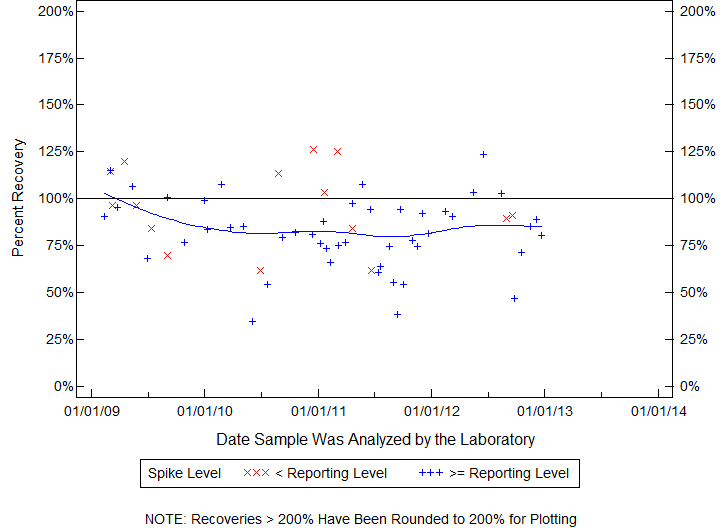
| Statistics for the Plotted Points |
| AZINPHOS-METHYL |
| Spike Level | N | Mean | Std-Dev. | Median | F_Pseudo |
|---|---|---|---|---|---|
| < Reporting Level | 15 | 96% | 21% | 96% | 23% |
| >= Reporting Level | 47 | 82% | 19% | 82% | 15% |
| Total | 62 | 85% | 20% | 85% | 17% |
| Miscellaneous Statistics for the Samples |
| AZINPHOS-METHYL |
| Characteristic | N | % | % Basis |
|---|---|---|---|
| Plotted | 62 | 100% | Spiked |
| Estimated Values | 62 | 100% | Spiked |
| Deleted Values | 0 | 0% | Spiked + Not Spiked |
| Spiked, Censored | 0 | 0% | Spiked |
| Spiked | 62 | . | |
| False Negatives | 0 | 0% | 0 out of 62 |
| Not Spiked | 102 | . | |
| False Positives | 0 | 0% | 0 out of 102 |
| BQS ORGANIC BLIND SAMPLES |
| 1RS CIS-PERMETHRIN, |
| Schedule: 2033 Testid: 82687GCM35 |
| Measured in MICROGRAMS PER LITER |
| 02/11/09 TO 01/15/13 |
| Open Data Set |
| Statistics for the Plotted Points |
| 1RS CIS-PERMETHRIN |
| Spike Level | N | Mean | Std-Dev. | Median | F_Pseudo |
|---|---|---|---|---|---|
| >= Reporting Level | 62 | 70% | 17% | 70% | 15% |
| Total | 62 | 70% | 17% | 70% | 15% |
| Miscellaneous Statistics for the Samples |
| 1RS CIS-PERMETHRIN |
| Characteristic | N | % | % Basis |
|---|---|---|---|
| Plotted | 62 | 100% | Spiked |
| Estimated Values | 2 | 3% | Spiked |
| Deleted Values | 0 | 0% | Spiked + Not Spiked |
| Spiked, Censored | 0 | 0% | Spiked |
| Spiked | 62 | . | |
| False Negatives | 0 | 0% | 0 out of 62 |
| Not Spiked | 102 | . | |
| False Positives | 0 | 0% | 0 out of 102 |