| BQS ORGANIC BLIND SAMPLES |
| PROPACHLOR, |
| Schedule: 2001 Testid: 04024GCM35 |
| Measured in MICROGRAMS PER LITER |
| 05/01/07 TO 11/27/12 |
| Open Data Set |
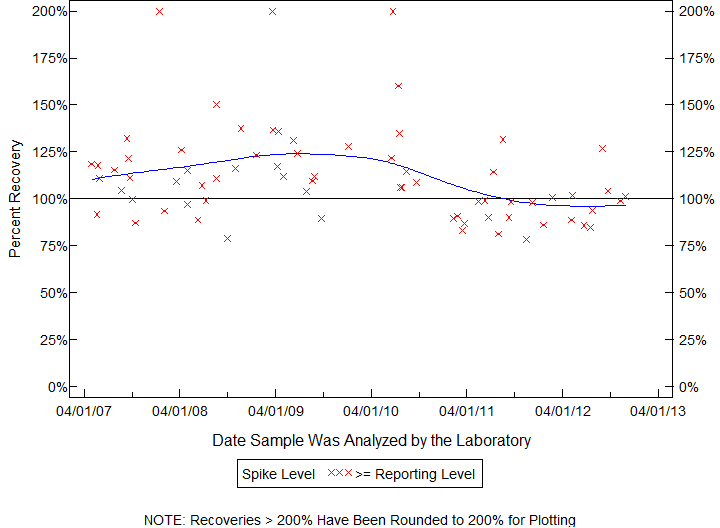
| BQS ORGANIC BLIND SAMPLES |
| PROPACHLOR, |
| Schedule: 2001 Testid: 04024GCM35 |
| Measured in MICROGRAMS PER LITER |
| 05/01/07 TO 11/27/12 |
| Open Data Set |

| Statistics for the Plotted Points |
| PROPACHLOR |
| Spike Level | N | Mean | Std-Dev. | Median | F_Pseudo |
|---|---|---|---|---|---|
| >= Reporting Level | 71 | 112% | 26% | 107% | 21% |
| Total | 71 | 112% | 26% | 107% | 21% |
| Miscellaneous Statistics for the Samples |
| PROPACHLOR |
| Characteristic | N | % | % Basis |
|---|---|---|---|
| Plotted | 71 | 100% | Spiked |
| Estimated Values | 0 | 0% | Spiked |
| Deleted Values | 1 | 1% | Spiked + Not Spiked |
| Spiked, Censored | 0 | 0% | Spiked |
| Spiked | 72 | . | |
| False Negatives | 0 | 0% | 0 out of 71 |
| Not Spiked | 70 | . | |
| False Positives | 0 | 0% | 0 out of 70 |
| BQS ORGANIC BLIND SAMPLES |
| BUTYLATE, |
| Schedule: 2001 Testid: 04028GCM35 |
| Measured in MICROGRAMS PER LITER |
| 04/17/07 TO 11/27/12 |
| Open Data Set |
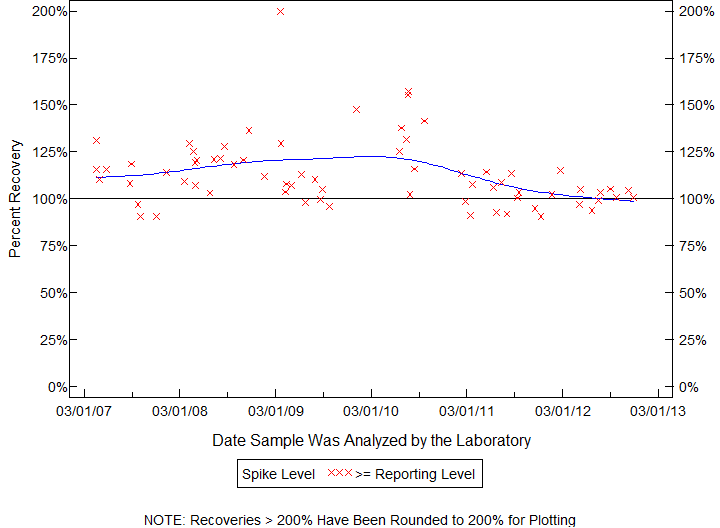
| Statistics for the Plotted Points |
| BUTYLATE |
| Spike Level | N | Mean | Std-Dev. | Median | F_Pseudo |
|---|---|---|---|---|---|
| >= Reporting Level | 69 | 113% | 18% | 109% | 15% |
| Total | 69 | 113% | 18% | 109% | 15% |
| Miscellaneous Statistics for the Samples |
| BUTYLATE |
| Characteristic | N | % | % Basis |
|---|---|---|---|
| Plotted | 69 | 99% | Spiked |
| Estimated Values | 0 | 0% | Spiked |
| Deleted Values | 1 | 1% | Spiked + Not Spiked |
| Spiked, Censored | 1 | 1% | Spiked |
| Spiked | 70 | . | |
| False Negatives | 0 | 0% | 0 out of 70 |
| Not Spiked | 72 | . | |
| False Positives | 0 | 0% | 0 out of 71 |
| BQS ORGANIC BLIND SAMPLES |
| SIMAZINE, |
| Schedule: 2001 Testid: 04035GCM35 |
| Measured in MICROGRAMS PER LITER |
| 04/17/07 TO 11/28/12 |
| Open Data Set |
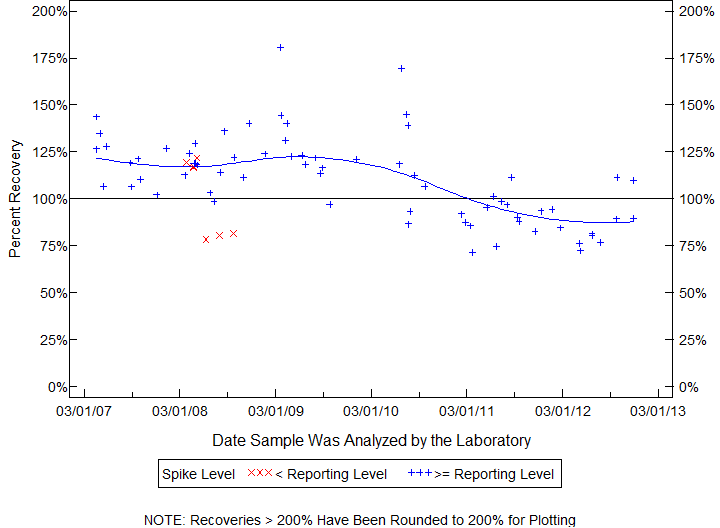
| Statistics for the Plotted Points |
| SIMAZINE |
| Spike Level | N | Mean | Std-Dev. | Median | F_Pseudo |
|---|---|---|---|---|---|
| < Reporting Level | 7 | 102% | 21% | 117% | 29% |
| >= Reporting Level | 70 | 111% | 22% | 112% | 22% |
| Total | 77 | 110% | 22% | 112% | 22% |
| Miscellaneous Statistics for the Samples |
| SIMAZINE |
| Characteristic | N | % | % Basis |
|---|---|---|---|
| Plotted | 77 | 100% | Spiked |
| Estimated Values | 8 | 10% | Spiked |
| Deleted Values | 1 | 1% | Spiked + Not Spiked |
| Spiked, Censored | 0 | 0% | Spiked |
| Spiked | 77 | . | |
| False Negatives | 0 | 0% | 0 out of 77 |
| Not Spiked | 65 | . | |
| False Positives | 5 | 8% | 5 out of 64 |
| BQS ORGANIC BLIND SAMPLES |
| PROMETON, |
| Schedule: 2001 Testid: 04037GCM35 |
| Measured in MICROGRAMS PER LITER |
| 05/01/07 TO 11/28/12 |
| Open Data Set |
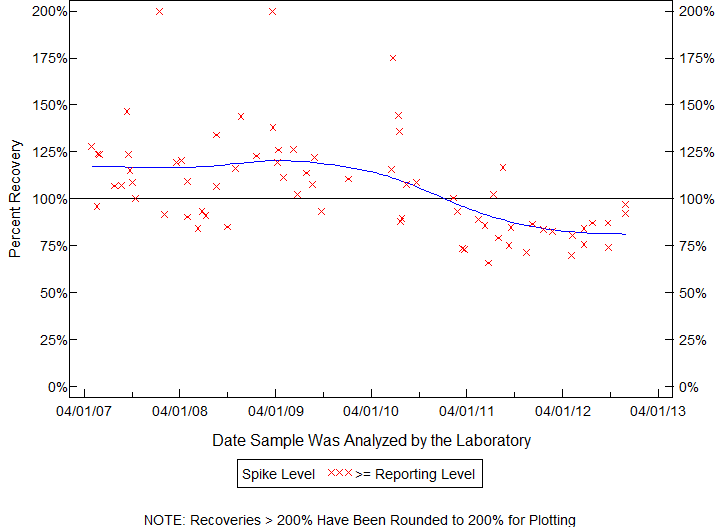
| Statistics for the Plotted Points |
| PROMETON |
| Spike Level | N | Mean | Std-Dev. | Median | F_Pseudo |
|---|---|---|---|---|---|
| >= Reporting Level | 71 | 106% | 27% | 102% | 25% |
| Total | 71 | 106% | 27% | 102% | 25% |
| Miscellaneous Statistics for the Samples |
| PROMETON |
| Characteristic | N | % | % Basis |
|---|---|---|---|
| Plotted | 71 | 100% | Spiked |
| Estimated Values | 1 | 1% | Spiked |
| Deleted Values | 1 | 1% | Spiked + Not Spiked |
| Spiked, Censored | 0 | 0% | Spiked |
| Spiked | 72 | . | |
| False Negatives | 0 | 0% | 0 out of 71 |
| Not Spiked | 70 | . | |
| False Positives | 0 | 0% | 0 out of 70 |
| BQS ORGANIC BLIND SAMPLES |
| DEETHYLATRAZINE (DESETHYL ATRAZINE) (2-CHLORO-4-ISOPROPYLAMINO-6-S-TRIAZINE) CIAT |
| Permanently Estimated Compound |
| Schedule: 2001 Testid: 04040GCM35 |
| 05/01/07 TO 11/27/12 |
| Open Data Set |
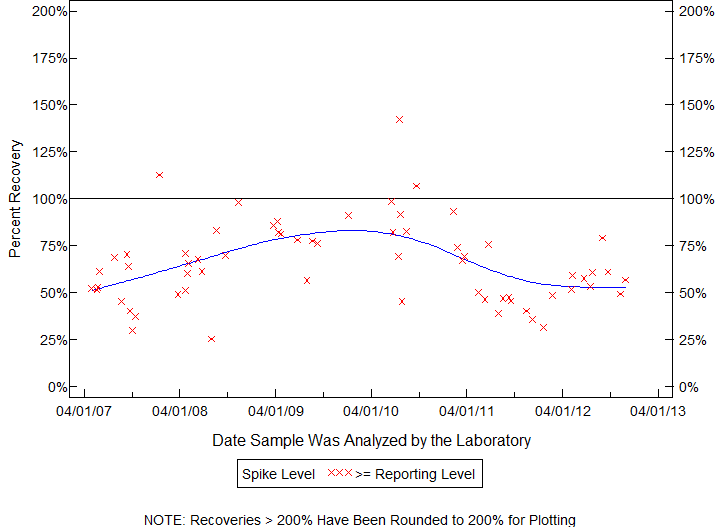
| Statistics for the Plotted Points |
| DEETHYLATRAZINE (DESETHYL ATRAZINE) (2-CHLORO-4-ISOPROPYLAMINO-6-S-TRIAZINE) CIAT |
| Spike Level | N | Mean | Std-Dev. | Median | F_Pseudo |
|---|---|---|---|---|---|
| >= Reporting Level | 64 | 65% | 22% | 61% | 22% |
| Total | 64 | 65% | 22% | 61% | 22% |
| Miscellaneous Statistics for the Samples |
| DEETHYLATRAZINE (DESETHYL ATRAZINE) (2-CHLORO-4-ISOPROPYLAMINO-6-S-TRIAZINE) CIAT |
| Characteristic | N | % | % Basis |
|---|---|---|---|
| Plotted | 64 | 91% | Spiked |
| Estimated Values | 64 | 91% | Spiked |
| Deleted Values | 1 | 1% | Spiked + Not Spiked |
| Spiked, Censored | 0 | 0% | Spiked |
| Spiked | 71 | . | |
| False Negatives | 6 | 9% | 6 out of 70 |
| Not Spiked | 71 | . | |
| False Positives | 1 | 1% | 1 out of 71 |
| BQS ORGANIC BLIND SAMPLES |
| CYANAZINE, |
| Schedule: 2001 Testid: 04041GCM35 |
| Measured in MICROGRAMS PER LITER |
| 04/26/07 TO 11/28/12 |
| Open Data Set |
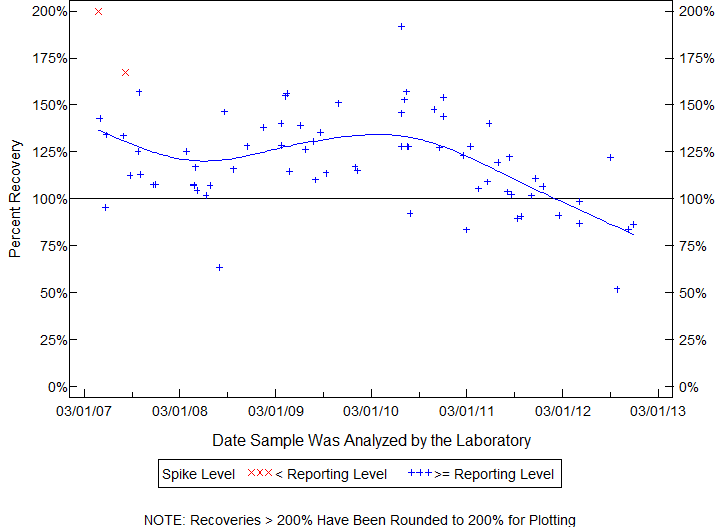
| Statistics for the Plotted Points |
| CYANAZINE |
| Spike Level | N | Mean | Std-Dev. | Median | F_Pseudo |
|---|---|---|---|---|---|
| < Reporting Level | 2 | 184% | 23% | 184% | 24% |
| >= Reporting Level | 70 | 120% | 24% | 118% | 22% |
| Total | 72 | 122% | 26% | 121% | 24% |
| Miscellaneous Statistics for the Samples |
| CYANAZINE |
| Characteristic | N | % | % Basis |
|---|---|---|---|
| Plotted | 72 | 100% | Spiked |
| Estimated Values | 3 | 4% | Spiked |
| Deleted Values | 1 | 1% | Spiked + Not Spiked |
| Spiked, Censored | 0 | 0% | Spiked |
| Spiked | 72 | . | |
| False Negatives | 0 | 0% | 0 out of 72 |
| Not Spiked | 70 | . | |
| False Positives | 1 | 1% | 1 out of 69 |
| BQS ORGANIC BLIND SAMPLES |
| FONOFOS, |
| Schedule: 2001 Testid: 04095GCM35 |
| Measured in MICROGRAMS PER LITER |
| 04/17/07 TO 11/27/12 |
| Open Data Set |
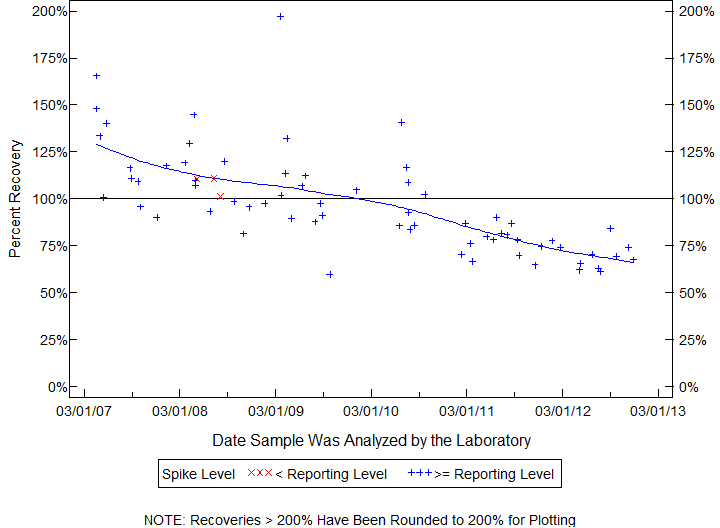
| Statistics for the Plotted Points |
| FONOFOS |
| Spike Level | N | Mean | Std-Dev. | Median | F_Pseudo |
|---|---|---|---|---|---|
| < Reporting Level | 3 | 108% | 6% | 111% | 7% |
| >= Reporting Level | 67 | 97% | 27% | 91% | 25% |
| Total | 70 | 97% | 26% | 93% | 24% |
| Miscellaneous Statistics for the Samples |
| FONOFOS |
| Characteristic | N | % | % Basis |
|---|---|---|---|
| Plotted | 70 | 100% | Spiked |
| Estimated Values | 2 | 3% | Spiked |
| Deleted Values | 1 | 1% | Spiked + Not Spiked |
| Spiked, Censored | 0 | 0% | Spiked |
| Spiked | 70 | . | |
| False Negatives | 0 | 0% | 0 out of 70 |
| Not Spiked | 72 | . | |
| False Positives | 0 | 0% | 0 out of 71 |
| BQS ORGANIC BLIND SAMPLES |
| ALPHA-HCH, |
| Schedule: 2001 Testid: 34253GCM35 |
| Measured in MICROGRAMS PER LITER |
| 04/17/07 TO 11/27/12 |
| Open Data Set |
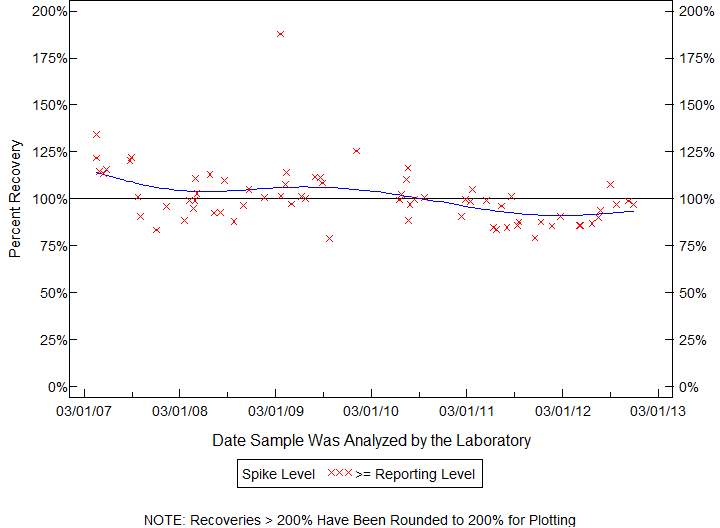
| Statistics for the Plotted Points |
| ALPHA-HCH |
| Spike Level | N | Mean | Std-Dev. | Median | F_Pseudo |
|---|---|---|---|---|---|
| >= Reporting Level | 70 | 101% | 16% | 99% | 13% |
| Total | 70 | 101% | 16% | 99% | 13% |
| Miscellaneous Statistics for the Samples |
| ALPHA-HCH |
| Characteristic | N | % | % Basis |
|---|---|---|---|
| Plotted | 70 | 100% | Spiked |
| Estimated Values | 0 | 0% | Spiked |
| Deleted Values | 1 | 1% | Spiked + Not Spiked |
| Spiked, Censored | 0 | 0% | Spiked |
| Spiked | 70 | . | |
| False Negatives | 0 | 0% | 0 out of 70 |
| Not Spiked | 72 | . | |
| False Positives | 0 | 0% | 0 out of 71 |
| BQS ORGANIC BLIND SAMPLES |
| P,P'-DDE, |
| Schedule: 2001 Testid: 34653GCM35 |
| Measured in MICROGRAMS PER LITER |
| 04/17/07 TO 11/27/12 |
| Open Data Set |
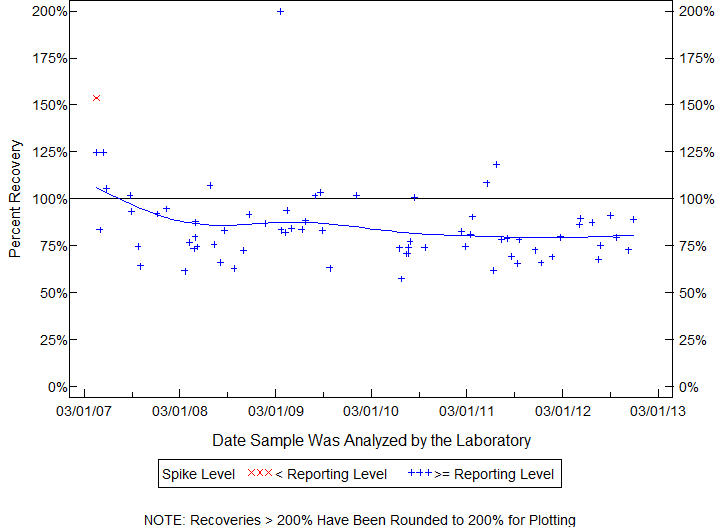
| Statistics for the Plotted Points |
| P,P'-DDE |
| Spike Level | N | Mean | Std-Dev. | Median | F_Pseudo |
|---|---|---|---|---|---|
| < Reporting Level | 1 | 154% | . | 154% | 0% |
| >= Reporting Level | 69 | 85% | 20% | 81% | 13% |
| Total | 70 | 86% | 22% | 82% | 14% |
| Miscellaneous Statistics for the Samples |
| P,P'-DDE |
| Characteristic | N | % | % Basis |
|---|---|---|---|
| Plotted | 70 | 100% | Spiked |
| Estimated Values | 3 | 4% | Spiked |
| Deleted Values | 1 | 1% | Spiked + Not Spiked |
| Spiked, Censored | 0 | 0% | Spiked |
| Spiked | 70 | . | |
| False Negatives | 0 | 0% | 0 out of 70 |
| Not Spiked | 72 | . | |
| False Positives | 1 | 1% | 1 out of 71 |
| BQS ORGANIC BLIND SAMPLES |
| CHLORPYRIFOS, |
| Schedule: 2001 Testid: 38933GCM35 |
| Measured in MICROGRAMS PER LITER |
| 04/17/07 TO 11/27/12 |
| Open Data Set |
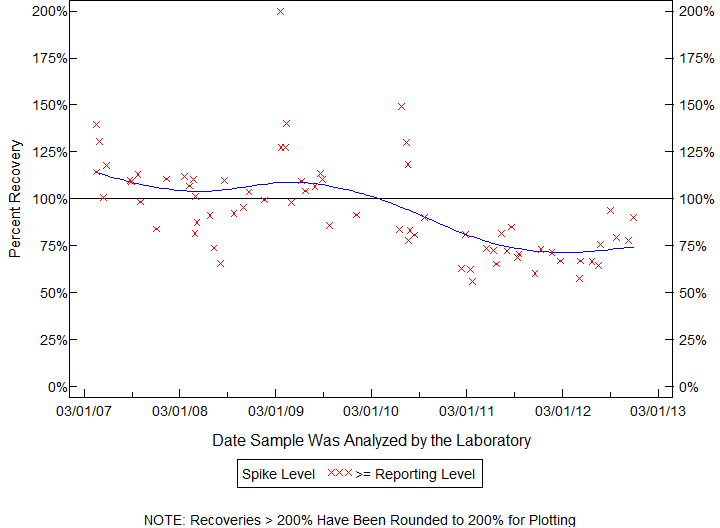
| Statistics for the Plotted Points |
| CHLORPYRIFOS |
| Spike Level | N | Mean | Std-Dev. | Median | F_Pseudo |
|---|---|---|---|---|---|
| >= Reporting Level | 70 | 94% | 26% | 91% | 27% |
| Total | 70 | 94% | 26% | 91% | 27% |
| Miscellaneous Statistics for the Samples |
| CHLORPYRIFOS |
| Characteristic | N | % | % Basis |
|---|---|---|---|
| Plotted | 70 | 100% | Spiked |
| Estimated Values | 1 | 1% | Spiked |
| Deleted Values | 1 | 1% | Spiked + Not Spiked |
| Spiked, Censored | 0 | 0% | Spiked |
| Spiked | 70 | . | |
| False Negatives | 0 | 0% | 0 out of 70 |
| Not Spiked | 72 | . | |
| False Positives | 0 | 0% | 0 out of 71 |
| BQS ORGANIC BLIND SAMPLES |
| LINDANE, |
| Schedule: 2001 Testid: 39341GCM35 |
| Measured in MICROGRAMS PER LITER |
| 04/17/07 TO 11/27/12 |
| Open Data Set |
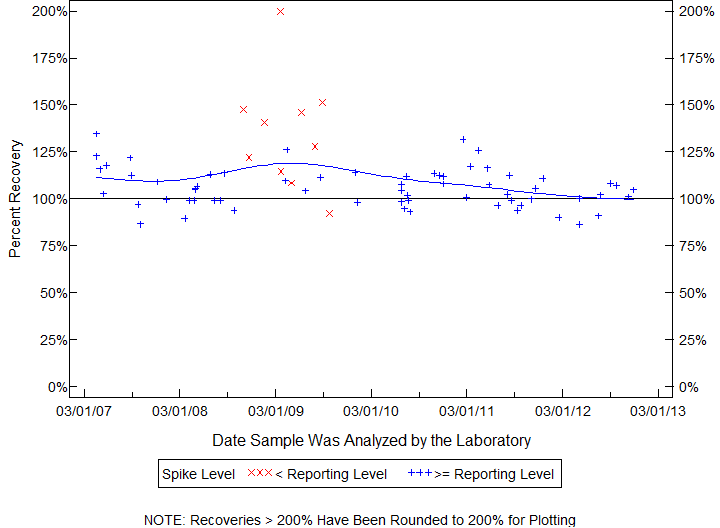
| Statistics for the Plotted Points |
| LINDANE |
| Spike Level | N | Mean | Std-Dev. | Median | F_Pseudo |
|---|---|---|---|---|---|
| < Reporting Level | 10 | 135% | 30% | 134% | 25% |
| >= Reporting Level | 64 | 106% | 10% | 105% | 10% |
| Total | 74 | 110% | 17% | 107% | 11% |
| Miscellaneous Statistics for the Samples |
| LINDANE |
| Characteristic | N | % | % Basis |
|---|---|---|---|
| Plotted | 74 | 100% | Spiked |
| Estimated Values | 5 | 7% | Spiked |
| Deleted Values | 1 | 1% | Spiked + Not Spiked |
| Spiked, Censored | 0 | 0% | Spiked |
| Spiked | 74 | . | |
| False Negatives | 0 | 0% | 0 out of 74 |
| Not Spiked | 68 | . | |
| False Positives | 0 | 0% | 0 out of 67 |
| BQS ORGANIC BLIND SAMPLES |
| DIELDRIN, |
| Schedule: 2001 Testid: 39381GCM35 |
| Measured in MICROGRAMS PER LITER |
| 05/01/07 TO 11/27/12 |
| Open Data Set |
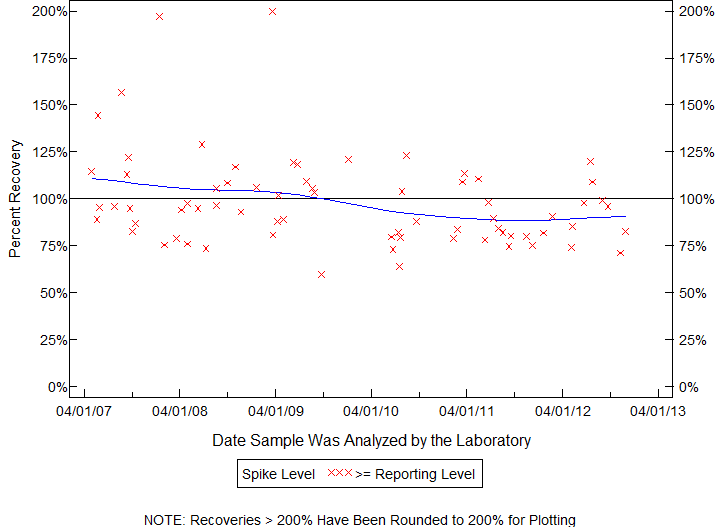
| Statistics for the Plotted Points |
| DIELDRIN |
| Spike Level | N | Mean | Std-Dev. | Median | F_Pseudo |
|---|---|---|---|---|---|
| >= Reporting Level | 71 | 98% | 25% | 95% | 21% |
| Total | 71 | 98% | 25% | 95% | 21% |
| Miscellaneous Statistics for the Samples |
| DIELDRIN |
| Characteristic | N | % | % Basis |
|---|---|---|---|
| Plotted | 71 | 100% | Spiked |
| Estimated Values | 4 | 6% | Spiked |
| Deleted Values | 1 | 1% | Spiked + Not Spiked |
| Spiked, Censored | 0 | 0% | Spiked |
| Spiked | 72 | . | |
| False Negatives | 0 | 0% | 0 out of 71 |
| Not Spiked | 70 | . | |
| False Positives | 0 | 0% | 0 out of 70 |
| BQS ORGANIC BLIND SAMPLES |
| METOLACHLOR, |
| Schedule: 2001 Testid: 39415GCM35 |
| Measured in MICROGRAMS PER LITER |
| 04/17/07 TO 11/28/12 |
| Open Data Set |
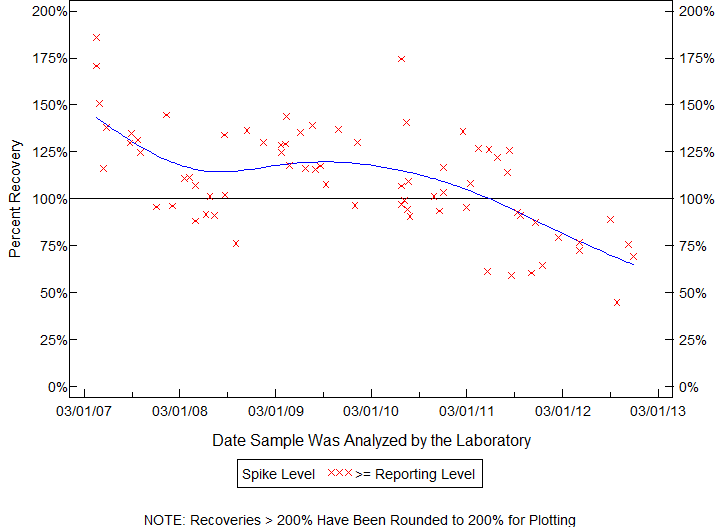
| Statistics for the Plotted Points |
| METOLACHLOR |
| Spike Level | N | Mean | Std-Dev. | Median | F_Pseudo |
|---|---|---|---|---|---|
| >= Reporting Level | 72 | 111% | 28% | 110% | 28% |
| Total | 72 | 111% | 28% | 110% | 28% |
| Miscellaneous Statistics for the Samples |
| METOLACHLOR |
| Characteristic | N | % | % Basis |
|---|---|---|---|
| Plotted | 72 | 100% | Spiked |
| Estimated Values | 4 | 6% | Spiked |
| Deleted Values | 1 | 1% | Spiked + Not Spiked |
| Spiked, Censored | 0 | 0% | Spiked |
| Spiked | 72 | . | |
| False Negatives | 0 | 0% | 0 out of 72 |
| Not Spiked | 70 | . | |
| False Positives | 1 | 1% | 1 out of 69 |
| BQS ORGANIC BLIND SAMPLES |
| MALATHION, |
| Schedule: 2001 Testid: 39532GCM35 |
| Measured in MICROGRAMS PER LITER |
| 04/26/07 TO 11/28/12 |
| Open Data Set |
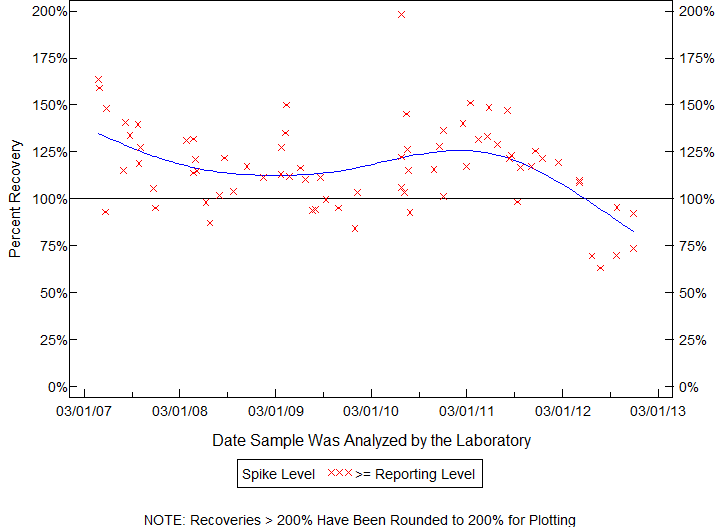
| Statistics for the Plotted Points |
| MALATHION |
| Spike Level | N | Mean | Std-Dev. | Median | F_Pseudo |
|---|---|---|---|---|---|
| >= Reporting Level | 74 | 117% | 23% | 117% | 22% |
| Total | 74 | 117% | 23% | 117% | 22% |
| Miscellaneous Statistics for the Samples |
| MALATHION |
| Characteristic | N | % | % Basis |
|---|---|---|---|
| Plotted | 74 | 100% | Spiked |
| Estimated Values | 1 | 1% | Spiked |
| Deleted Values | 1 | 1% | Spiked + Not Spiked |
| Spiked, Censored | 0 | 0% | Spiked |
| Spiked | 74 | . | |
| False Negatives | 0 | 0% | 0 out of 74 |
| Not Spiked | 68 | . | |
| False Positives | 1 | 1% | 1 out of 67 |
| BQS ORGANIC BLIND SAMPLES |
| PARATHION, |
| Schedule: 2001 Testid: 39542GCM35 |
| Measured in MICROGRAMS PER LITER |
| 05/01/07 TO 11/28/12 |
| Open Data Set |
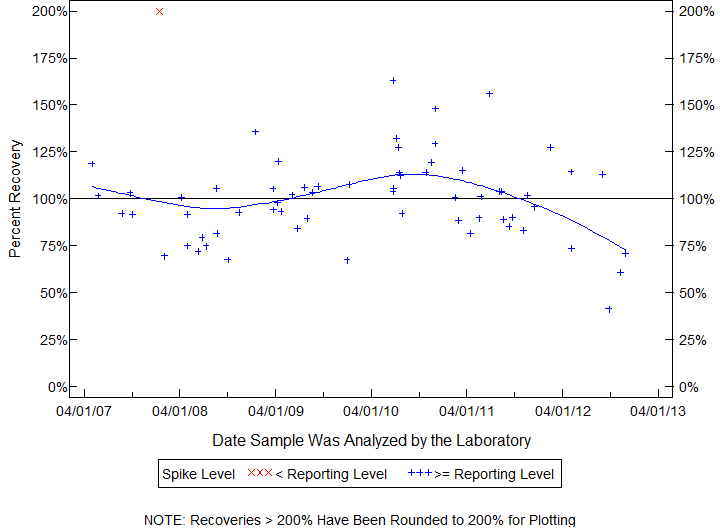
| Statistics for the Plotted Points |
| PARATHION |
| Spike Level | N | Mean | Std-Dev. | Median | F_Pseudo |
|---|---|---|---|---|---|
| < Reporting Level | 1 | 200% | . | 200% | 0% |
| >= Reporting Level | 64 | 100% | 22% | 101% | 19% |
| Total | 65 | 101% | 25% | 101% | 18% |
| Miscellaneous Statistics for the Samples |
| PARATHION |
| Characteristic | N | % | % Basis |
|---|---|---|---|
| Plotted | 65 | 89% | Spiked |
| Estimated Values | 0 | 0% | Spiked |
| Deleted Values | 1 | 1% | Spiked + Not Spiked |
| Spiked, Censored | 6 | 8% | Spiked |
| Spiked | 74 | . | |
| False Negatives | 2 | 3% | 2 out of 73 |
| Not Spiked | 68 | . | |
| False Positives | 1 | 1% | 1 out of 68 |
| BQS ORGANIC BLIND SAMPLES |
| DIAZINON, |
| Schedule: 2001 Testid: 39572GCM35 |
| Measured in MICROGRAMS PER LITER |
| 04/17/07 TO 11/27/12 |
| Open Data Set |
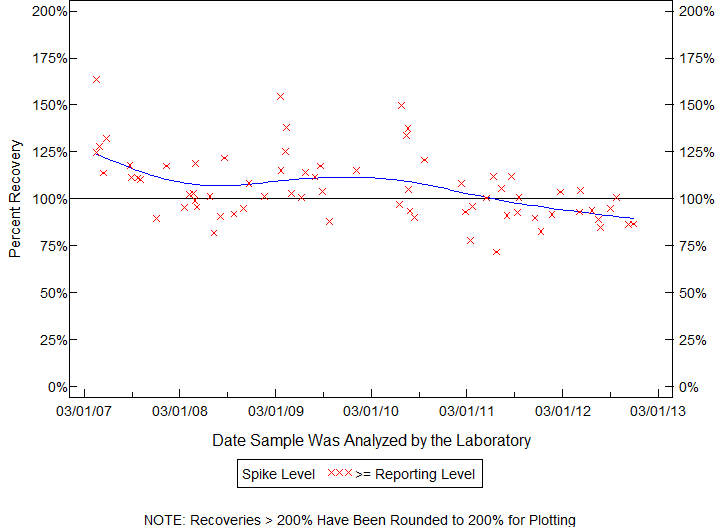
| Statistics for the Plotted Points |
| DIAZINON |
| Spike Level | N | Mean | Std-Dev. | Median | F_Pseudo |
|---|---|---|---|---|---|
| >= Reporting Level | 70 | 106% | 18% | 103% | 16% |
| Total | 70 | 106% | 18% | 103% | 16% |
| Miscellaneous Statistics for the Samples |
| DIAZINON |
| Characteristic | N | % | % Basis |
|---|---|---|---|
| Plotted | 70 | 100% | Spiked |
| Estimated Values | 2 | 3% | Spiked |
| Deleted Values | 1 | 1% | Spiked + Not Spiked |
| Spiked, Censored | 0 | 0% | Spiked |
| Spiked | 70 | . | |
| False Negatives | 0 | 0% | 0 out of 70 |
| Not Spiked | 72 | . | |
| False Positives | 3 | 4% | 3 out of 71 |
| BQS ORGANIC BLIND SAMPLES |
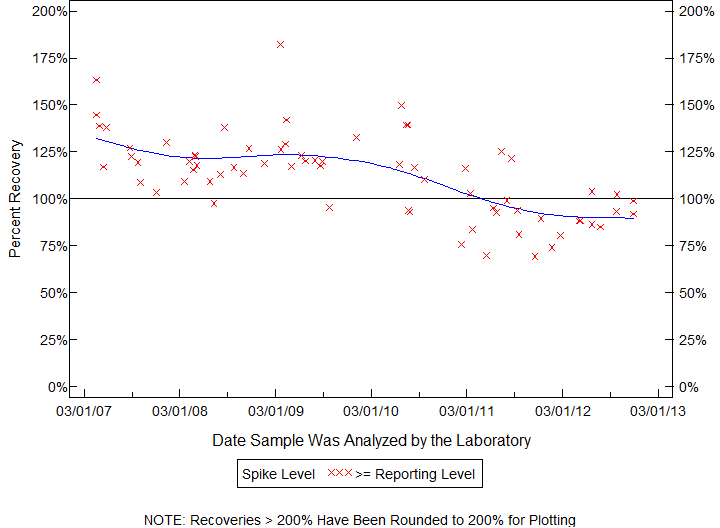
| ATRAZINE, |
| Schedule: 2001 Testid: 39632GCM35 |
| Measured in MICROGRAMS PER LITER |
| 04/17/07 TO 11/28/12 |
| Open Data Set |
| Statistics for the Plotted Points |
| ATRAZINE |
| Spike Level | N | Mean | Std-Dev. | Median | F_Pseudo |
|---|---|---|---|---|---|
| >= Reporting Level | 70 | 112% | 22% | 117% | 22% |
| Total | 70 | 112% | 22% | 117% | 22% |
| Miscellaneous Statistics for the Samples |
| ATRAZINE |
| Characteristic | N | % | % Basis |
|---|---|---|---|
| Plotted | 70 | 100% | Spiked |
| Estimated Values | 2 | 3% | Spiked |
| Deleted Values | 1 | 1% | Spiked + Not Spiked |
| Spiked, Censored | 0 | 0% | Spiked |
| Spiked | 70 | . | |
| False Negatives | 0 | 0% | 0 out of 70 |
| Not Spiked | 72 | . | |
| False Positives | 1 | 1% | 1 out of 71 |
| BQS ORGANIC BLIND SAMPLES |
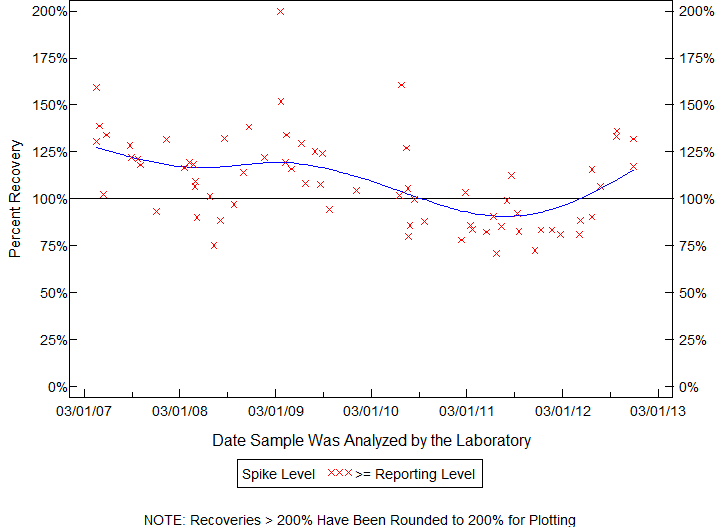
| ALACHLOR, |
| Schedule: 2001 Testid: 46342GCM35 |
| Measured in MICROGRAMS PER LITER |
| 04/17/07 TO 11/28/12 |
| Open Data Set |
| Statistics for the Plotted Points |
| ALACHLOR |
| Spike Level | N | Mean | Std-Dev. | Median | F_Pseudo |
|---|---|---|---|---|---|
| >= Reporting Level | 70 | 110% | 24% | 107% | 27% |
| Total | 70 | 110% | 24% | 107% | 27% |
| Miscellaneous Statistics for the Samples |
| ALACHLOR |
| Characteristic | N | % | % Basis |
|---|---|---|---|
| Plotted | 70 | 100% | Spiked |
| Estimated Values | 1 | 1% | Spiked |
| Deleted Values | 1 | 1% | Spiked + Not Spiked |
| Spiked, Censored | 0 | 0% | Spiked |
| Spiked | 70 | . | |
| False Negatives | 0 | 0% | 0 out of 70 |
| Not Spiked | 72 | . | |
| False Positives | 0 | 0% | 0 out of 71 |
| BQS ORGANIC BLIND SAMPLES |
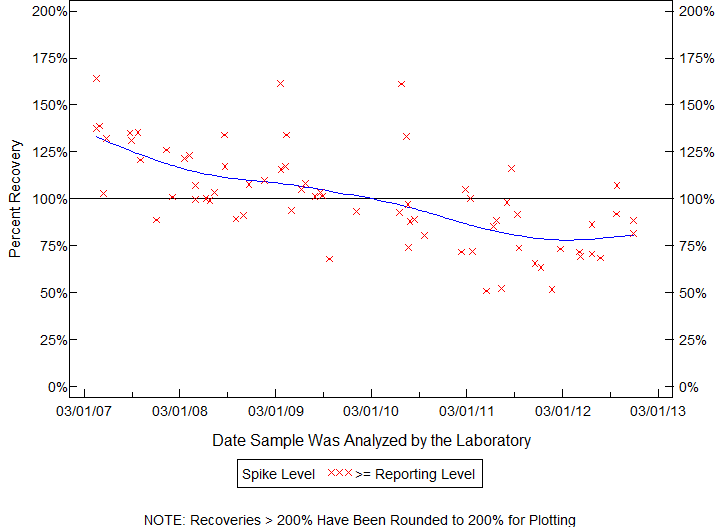
| ACETOCHLOR, |
| Schedule: 2001 Testid: 49260GCM33 |
| Measured in MICROGRAMS PER LITER |
| 04/17/07 TO 11/28/12 |
| Open Data Set |
| Statistics for the Plotted Points |
| ACETOCHLOR |
| Spike Level | N | Mean | Std-Dev. | Median | F_Pseudo |
|---|---|---|---|---|---|
| >= Reporting Level | 70 | 101% | 26% | 100% | 24% |
| Total | 70 | 101% | 26% | 100% | 24% |
| Miscellaneous Statistics for the Samples |
| ACETOCHLOR |
| Characteristic | N | % | % Basis |
|---|---|---|---|
| Plotted | 70 | 100% | Spiked |
| Estimated Values | 4 | 6% | Spiked |
| Deleted Values | 1 | 1% | Spiked + Not Spiked |
| Spiked, Censored | 0 | 0% | Spiked |
| Spiked | 70 | . | |
| False Negatives | 0 | 0% | 0 out of 70 |
| Not Spiked | 72 | . | |
| False Positives | 0 | 0% | 0 out of 71 |
| BQS ORGANIC BLIND SAMPLES |
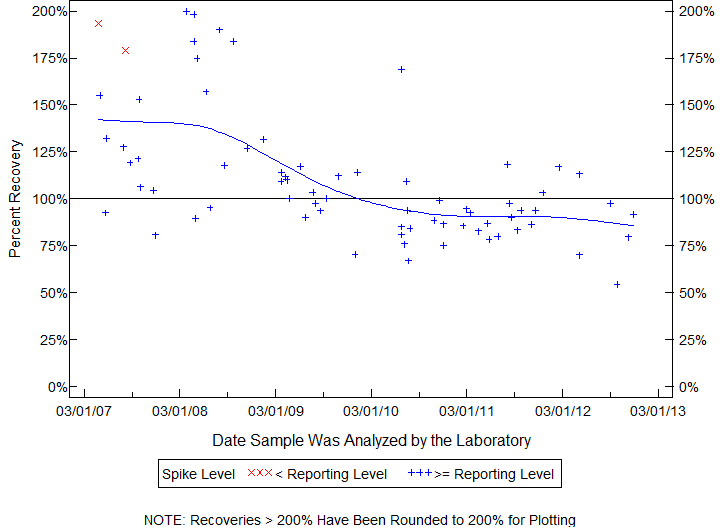
| FIPRONIL |
| Permanently Estimated Compound |
| Schedule: 2001 Testid: 62166GCM31 |
| 04/26/07 TO 11/28/12 |
| Open Data Set |
| Statistics for the Plotted Points |
| FIPRONIL |
| Spike Level | N | Mean | Std-Dev. | Median | F_Pseudo |
|---|---|---|---|---|---|
| < Reporting Level | 2 | 186% | 10% | 186% | 11% |
| >= Reporting Level | 70 | 109% | 33% | 98% | 23% |
| Total | 72 | 111% | 35% | 100% | 24% |
| Miscellaneous Statistics for the Samples |
| FIPRONIL |
| Characteristic | N | % | % Basis |
|---|---|---|---|
| Plotted | 72 | 100% | Spiked |
| Estimated Values | 72 | 100% | Spiked |
| Deleted Values | 1 | 1% | Spiked + Not Spiked |
| Spiked, Censored | 0 | 0% | Spiked |
| Spiked | 72 | . | |
| False Negatives | 0 | 0% | 0 out of 72 |
| Not Spiked | 70 | . | |
| False Positives | 11 | 16% | 11 out of 69 |
| BQS ORGANIC BLIND SAMPLES |
| FIPRONIL SULFIDE, |
| Schedule: 2001 Testid: 62167GCM31 |
| Measured in MICROGRAMS PER LITER |
| 05/01/07 TO 11/28/12 |
| Open Data Set |
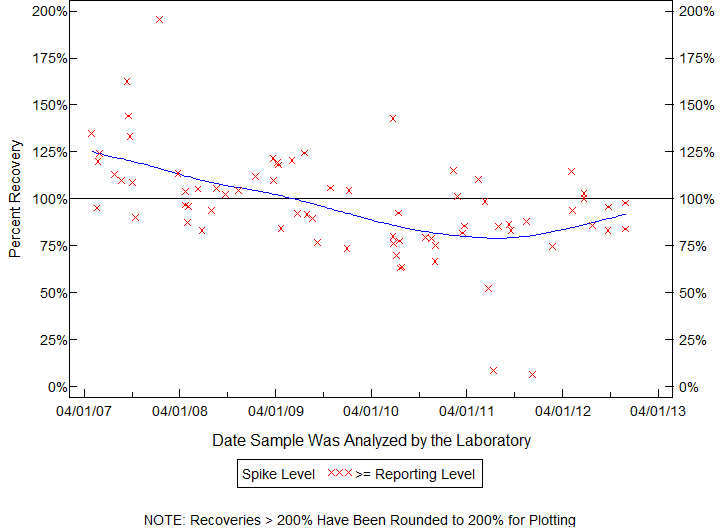
| Statistics for the Plotted Points |
| FIPRONIL SULFIDE |
| Spike Level | N | Mean | Std-Dev. | Median | F_Pseudo |
|---|---|---|---|---|---|
| >= Reporting Level | 73 | 97% | 28% | 96% | 20% |
| Total | 73 | 97% | 28% | 96% | 20% |
| Miscellaneous Statistics for the Samples |
| FIPRONIL SULFIDE |
| Characteristic | N | % | % Basis |
|---|---|---|---|
| Plotted | 73 | 97% | Spiked |
| Estimated Values | 5 | 7% | Spiked |
| Deleted Values | 1 | 1% | Spiked + Not Spiked |
| Spiked, Censored | 0 | 0% | Spiked |
| Spiked | 76 | . | |
| False Negatives | 2 | 3% | 2 out of 75 |
| Not Spiked | 66 | . | |
| False Positives | 22 | 33% | 22 out of 66 |
| BQS ORGANIC BLIND SAMPLES |
| FIPRONIL SULFONE, |
| Schedule: 2001 Testid: 62168GCM31 |
| Measured in MICROGRAMS PER LITER |
| 04/26/07 TO 11/28/12 |
| Open Data Set |
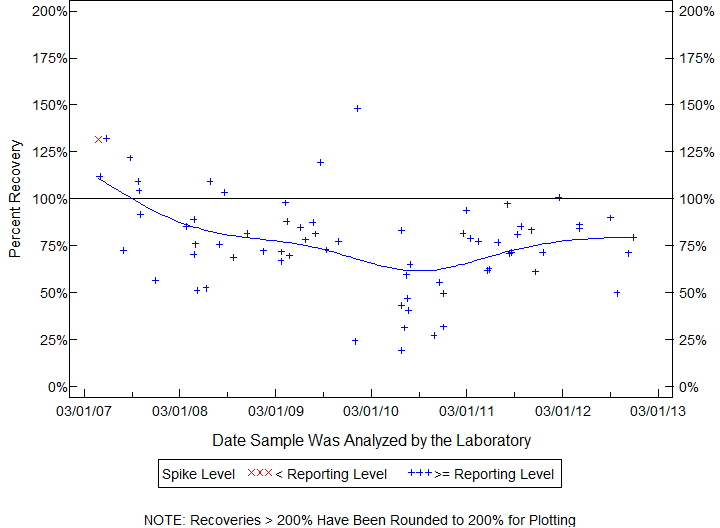
| Statistics for the Plotted Points |
| FIPRONIL SULFONE |
| Spike Level | N | Mean | Std-Dev. | Median | F_Pseudo |
|---|---|---|---|---|---|
| < Reporting Level | 1 | 132% | . | 132% | 0% |
| >= Reporting Level | 68 | 76% | 25% | 77% | 19% |
| Total | 69 | 77% | 25% | 77% | 19% |
| Miscellaneous Statistics for the Samples |
| FIPRONIL SULFONE |
| Characteristic | N | % | % Basis |
|---|---|---|---|
| Plotted | 69 | 100% | Spiked |
| Estimated Values | 7 | 10% | Spiked |
| Deleted Values | 1 | 1% | Spiked + Not Spiked |
| Spiked, Censored | 0 | 0% | Spiked |
| Spiked | 69 | . | |
| False Negatives | 0 | 0% | 0 out of 69 |
| Not Spiked | 73 | . | |
| False Positives | 1 | 1% | 1 out of 72 |
| BQS ORGANIC BLIND SAMPLES |
| DESULFINYLFIPRONIL AMIDE |
| Permanently Estimated Compound |
| Schedule: 2001 Testid: 62169GCM31 |
| 05/01/07 TO 07/28/10 |
| Open Data Set |
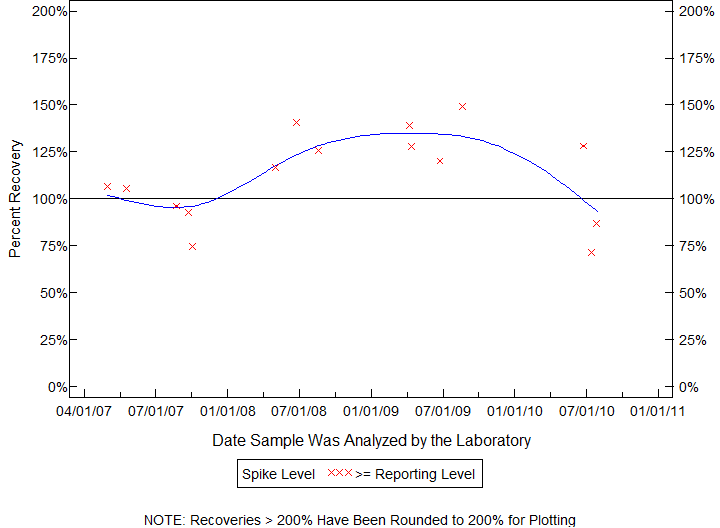
| Statistics for the Plotted Points |
| DESULFINYLFIPRONIL AMIDE |
| Spike Level | N | Mean | Std-Dev. | Median | F_Pseudo |
|---|---|---|---|---|---|
| >= Reporting Level | 15 | 112% | 24% | 117% | 26% |
| Total | 15 | 112% | 24% | 117% | 26% |
| Miscellaneous Statistics for the Samples |
| DESULFINYLFIPRONIL AMIDE |
| Characteristic | N | % | % Basis |
|---|---|---|---|
| Plotted | 15 | 100% | Spiked |
| Estimated Values | 15 | 100% | Spiked |
| Deleted Values | 1 | 1% | Spiked + Not Spiked |
| Spiked, Censored | 0 | 0% | Spiked |
| Spiked | 15 | . | |
| False Negatives | 0 | 0% | 0 out of 15 |
| Not Spiked | 127 | . | |
| False Positives | 1 | 1% | 1 out of 126 |
| BQS ORGANIC BLIND SAMPLES |
| DESULFINYLFIPRONIL, |
| Schedule: 2001 Testid: 62170GCM31 |
| Measured in MICROGRAMS PER LITER |
| 05/01/07 TO 12/01/10 |
| Open Data Set |
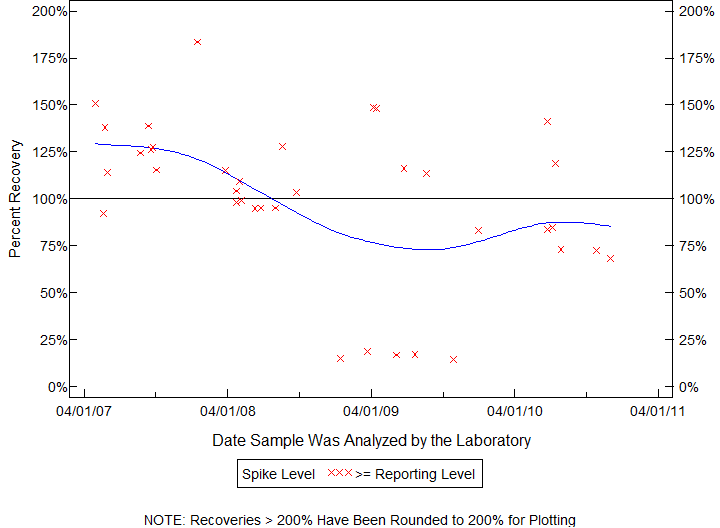
| Statistics for the Plotted Points |
| DESULFINYLFIPRONIL |
| Spike Level | N | Mean | Std-Dev. | Median | F_Pseudo |
|---|---|---|---|---|---|
| >= Reporting Level | 37 | 100% | 41% | 104% | 32% |
| Total | 37 | 100% | 41% | 104% | 32% |
| Miscellaneous Statistics for the Samples |
| DESULFINYLFIPRONIL |
| Characteristic | N | % | % Basis |
|---|---|---|---|
| Plotted | 37 | 100% | Spiked |
| Estimated Values | 3 | 8% | Spiked |
| Deleted Values | 1 | 1% | Spiked + Not Spiked |
| Spiked, Censored | 0 | 0% | Spiked |
| Spiked | 37 | . | |
| False Negatives | 0 | 0% | 0 out of 37 |
| Not Spiked | 105 | . | |
| False Positives | 2 | 2% | 2 out of 104 |
| BQS ORGANIC BLIND SAMPLES |
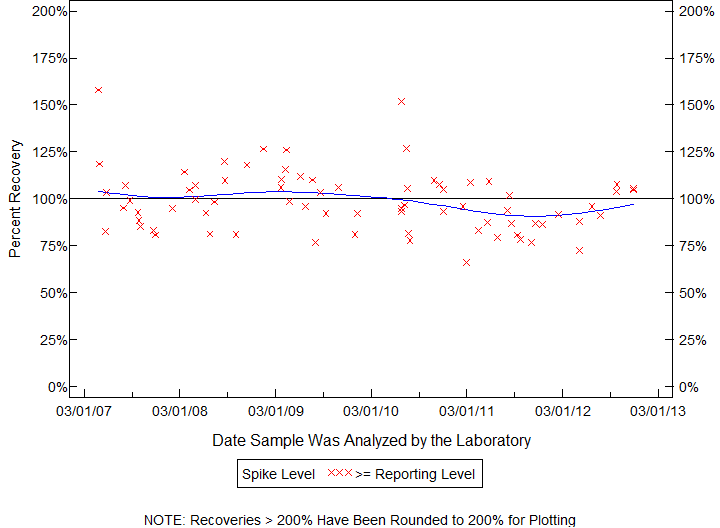
| METRIBUZIN, |
| Schedule: 2001 Testid: 82630GCM35 |
| Measured in MICROGRAMS PER LITER |
| 04/26/07 TO 11/28/12 |
| Open Data Set |
| Statistics for the Plotted Points |
| METRIBUZIN |
| Spike Level | N | Mean | Std-Dev. | Median | F_Pseudo |
|---|---|---|---|---|---|
| >= Reporting Level | 75 | 99% | 16% | 96% | 15% |
| Total | 75 | 99% | 16% | 96% | 15% |
| Miscellaneous Statistics for the Samples |
| METRIBUZIN |
| Characteristic | N | % | % Basis |
|---|---|---|---|
| Plotted | 75 | 100% | Spiked |
| Estimated Values | 1 | 1% | Spiked |
| Deleted Values | 1 | 1% | Spiked + Not Spiked |
| Spiked, Censored | 0 | 0% | Spiked |
| Spiked | 75 | . | |
| False Negatives | 0 | 0% | 0 out of 75 |
| Not Spiked | 67 | . | |
| False Positives | 2 | 3% | 2 out of 66 |
| BQS ORGANIC BLIND SAMPLES |
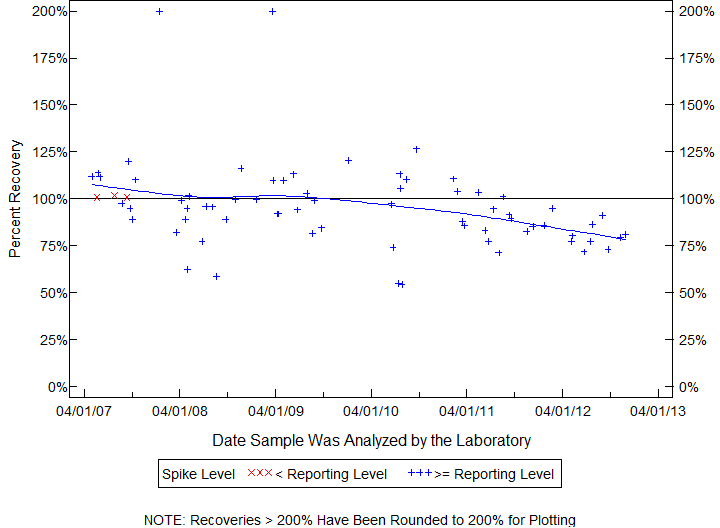
| 2,6-DIETHYLANILINE, |
| Schedule: 2001 Testid: 82660GCM35 |
| Measured in MICROGRAMS PER LITER |
| 05/01/07 TO 11/27/12 |
| Open Data Set |
| Statistics for the Plotted Points |
| 2,6-DIETHYLANILINE |
| Spike Level | N | Mean | Std-Dev. | Median | F_Pseudo |
|---|---|---|---|---|---|
| < Reporting Level | 3 | 101% | 1% | 101% | 1% |
| >= Reporting Level | 68 | 96% | 24% | 95% | 17% |
| Total | 71 | 96% | 24% | 95% | 16% |
| Miscellaneous Statistics for the Samples |
| 2,6-DIETHYLANILINE |
| Characteristic | N | % | % Basis |
|---|---|---|---|
| Plotted | 71 | 100% | Spiked |
| Estimated Values | 3 | 4% | Spiked |
| Deleted Values | 1 | 1% | Spiked + Not Spiked |
| Spiked, Censored | 0 | 0% | Spiked |
| Spiked | 72 | . | |
| False Negatives | 0 | 0% | 0 out of 71 |
| Not Spiked | 70 | . | |
| False Positives | 0 | 0% | 0 out of 70 |
| BQS ORGANIC BLIND SAMPLES |
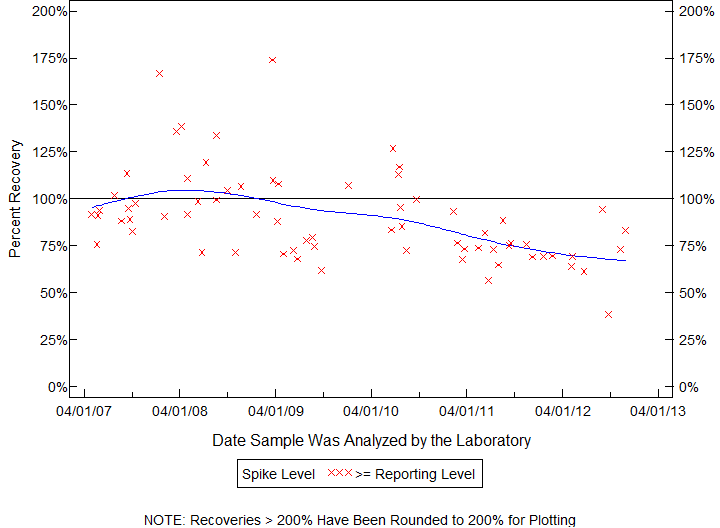
| TRIFLURALIN, |
| Schedule: 2001 Testid: 82661GCM35 |
| Measured in MICROGRAMS PER LITER |
| 05/01/07 TO 11/28/12 |
| Open Data Set |
| Statistics for the Plotted Points |
| TRIFLURALIN |
| Spike Level | N | Mean | Std-Dev. | Median | F_Pseudo |
|---|---|---|---|---|---|
| >= Reporting Level | 69 | 90% | 24% | 88% | 20% |
| Total | 69 | 90% | 24% | 88% | 20% |
| Miscellaneous Statistics for the Samples |
| TRIFLURALIN |
| Characteristic | N | % | % Basis |
|---|---|---|---|
| Plotted | 69 | 100% | Spiked |
| Estimated Values | 3 | 4% | Spiked |
| Deleted Values | 1 | 1% | Spiked + Not Spiked |
| Spiked, Censored | 0 | 0% | Spiked |
| Spiked | 70 | . | |
| False Negatives | 0 | 0% | 0 out of 69 |
| Not Spiked | 72 | . | |
| False Positives | 0 | 0% | 0 out of 72 |
| BQS ORGANIC BLIND SAMPLES |
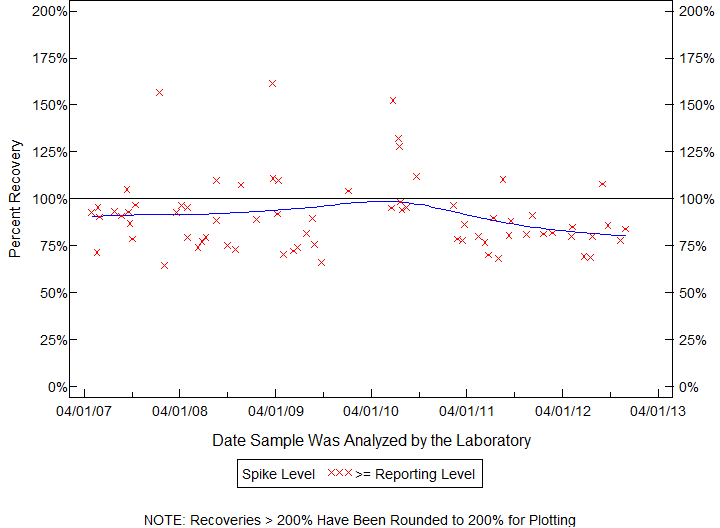
| ETHALFLURALIN, |
| Schedule: 2001 Testid: 82663GCM35 |
| Measured in MICROGRAMS PER LITER |
| 05/01/07 TO 11/27/12 |
| Open Data Set |
| Statistics for the Plotted Points |
| ETHALFLURALIN |
| Spike Level | N | Mean | Std-Dev. | Median | F_Pseudo |
|---|---|---|---|---|---|
| >= Reporting Level | 71 | 91% | 20% | 88% | 14% |
| Total | 71 | 91% | 20% | 88% | 14% |
| Miscellaneous Statistics for the Samples |
| ETHALFLURALIN |
| Characteristic | N | % | % Basis |
|---|---|---|---|
| Plotted | 71 | 100% | Spiked |
| Estimated Values | 0 | 0% | Spiked |
| Deleted Values | 1 | 1% | Spiked + Not Spiked |
| Spiked, Censored | 0 | 0% | Spiked |
| Spiked | 72 | . | |
| False Negatives | 0 | 0% | 0 out of 71 |
| Not Spiked | 70 | . | |
| False Positives | 0 | 0% | 0 out of 70 |
| BQS ORGANIC BLIND SAMPLES |
| PHORATE, |
| Schedule: 2001 Testid: 82664GCM35 |
| Measured in MICROGRAMS PER LITER |
| 04/26/07 TO 11/28/12 |
| Open Data Set |
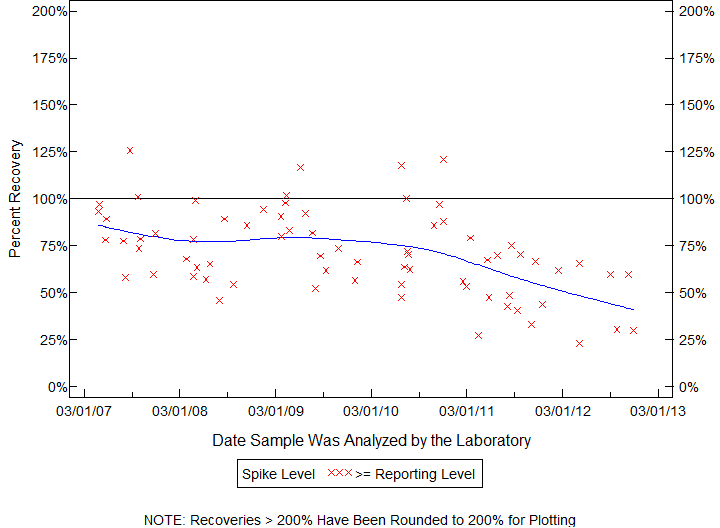
| Statistics for the Plotted Points |
| PHORATE |
| Spike Level | N | Mean | Std-Dev. | Median | F_Pseudo |
|---|---|---|---|---|---|
| >= Reporting Level | 72 | 71% | 23% | 70% | 22% |
| Total | 72 | 71% | 23% | 70% | 22% |
| Miscellaneous Statistics for the Samples |
| PHORATE |
| Characteristic | N | % | % Basis |
|---|---|---|---|
| Plotted | 72 | 100% | Spiked |
| Estimated Values | 3 | 4% | Spiked |
| Deleted Values | 1 | 1% | Spiked + Not Spiked |
| Spiked, Censored | 0 | 0% | Spiked |
| Spiked | 72 | . | |
| False Negatives | 0 | 0% | 0 out of 72 |
| Not Spiked | 70 | . | |
| False Positives | 5 | 7% | 5 out of 69 |
| BQS ORGANIC BLIND SAMPLES |
| TERBACIL |
| Permanently Estimated Compound |
| Schedule: 2001 Testid: 82665GCM35 |
| 04/26/07 TO 11/28/12 |
| Open Data Set |
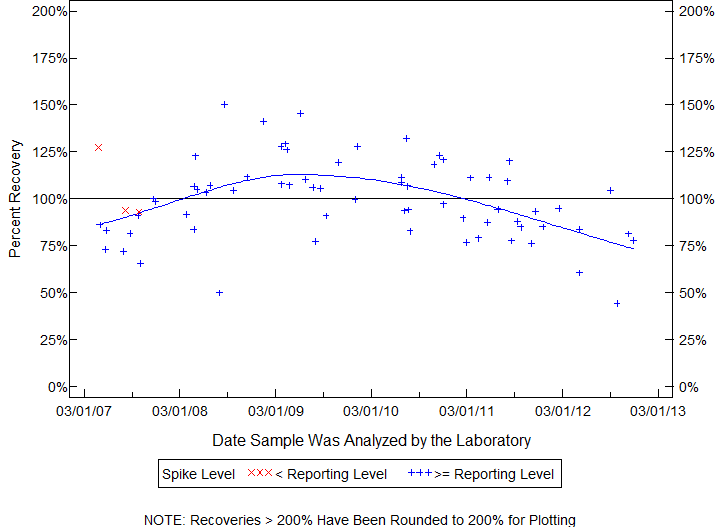
| Statistics for the Plotted Points |
| TERBACIL |
| Spike Level | N | Mean | Std-Dev. | Median | F_Pseudo |
|---|---|---|---|---|---|
| < Reporting Level | 3 | 105% | 20% | 94% | 25% |
| >= Reporting Level | 68 | 99% | 21% | 99% | 20% |
| Total | 71 | 99% | 21% | 99% | 20% |
| Miscellaneous Statistics for the Samples |
| TERBACIL |
| Characteristic | N | % | % Basis |
|---|---|---|---|
| Plotted | 71 | 100% | Spiked |
| Estimated Values | 71 | 100% | Spiked |
| Deleted Values | 2 | 1% | Spiked + Not Spiked |
| Spiked, Censored | 0 | 0% | Spiked |
| Spiked | 72 | . | |
| False Negatives | 0 | 0% | 0 out of 71 |
| Not Spiked | 70 | . | |
| False Positives | 1 | 1% | 1 out of 69 |
| BQS ORGANIC BLIND SAMPLES |
| LINURON, |
| Schedule: 2001 Testid: 82666GCM35 |
| Measured in MICROGRAMS PER LITER |
| 04/26/07 TO 11/28/12 |
| Open Data Set |
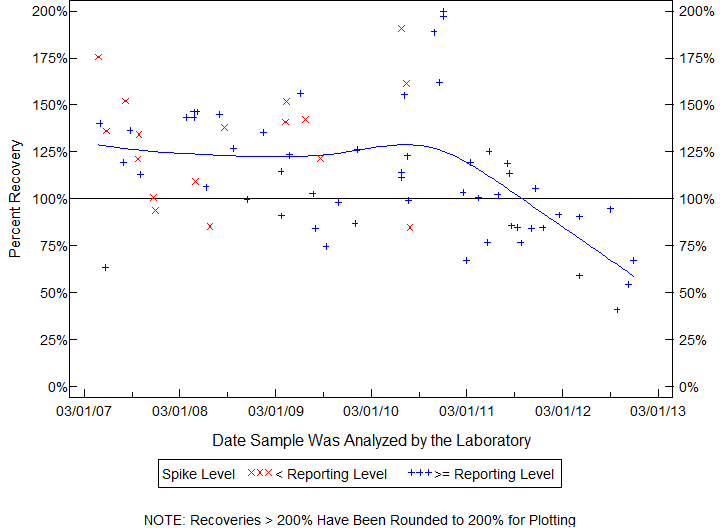
| Statistics for the Plotted Points |
| LINURON |
| Spike Level | N | Mean | Std-Dev. | Median | F_Pseudo |
|---|---|---|---|---|---|
| < Reporting Level | 17 | 132% | 30% | 136% | 32% |
| >= Reporting Level | 55 | 111% | 34% | 106% | 37% |
| Total | 72 | 116% | 34% | 114% | 37% |
| Miscellaneous Statistics for the Samples |
| LINURON |
| Characteristic | N | % | % Basis |
|---|---|---|---|
| Plotted | 72 | 100% | Spiked |
| Estimated Values | 12 | 17% | Spiked |
| Deleted Values | 1 | 1% | Spiked + Not Spiked |
| Spiked, Censored | 0 | 0% | Spiked |
| Spiked | 72 | . | |
| False Negatives | 0 | 0% | 0 out of 72 |
| Not Spiked | 70 | . | |
| False Positives | 1 | 1% | 1 out of 69 |
| BQS ORGANIC BLIND SAMPLES |
| PARATHION-METHYL, |
| Schedule: 2001 Testid: 82667GCM35 |
| Measured in MICROGRAMS PER LITER |
| 04/26/07 TO 11/28/12 |
| Open Data Set |
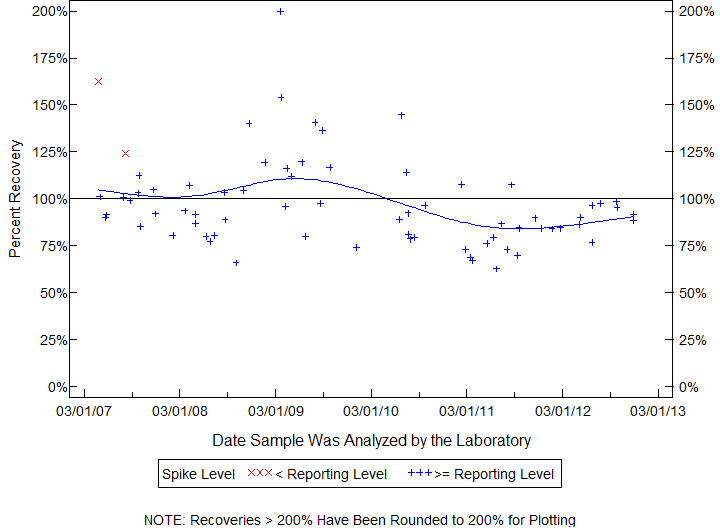
| Statistics for the Plotted Points |
| PARATHION-METHYL |
| Spike Level | N | Mean | Std-Dev. | Median | F_Pseudo |
|---|---|---|---|---|---|
| < Reporting Level | 2 | 143% | 27% | 143% | 28% |
| >= Reporting Level | 69 | 96% | 23% | 92% | 18% |
| Total | 71 | 98% | 24% | 92% | 20% |
| Miscellaneous Statistics for the Samples |
| PARATHION-METHYL |
| Characteristic | N | % | % Basis |
|---|---|---|---|
| Plotted | 71 | 100% | Spiked |
| Estimated Values | 5 | 7% | Spiked |
| Deleted Values | 1 | 1% | Spiked + Not Spiked |
| Spiked, Censored | 0 | 0% | Spiked |
| Spiked | 71 | . | |
| False Negatives | 0 | 0% | 0 out of 71 |
| Not Spiked | 71 | . | |
| False Positives | 1 | 1% | 1 out of 70 |
| BQS ORGANIC BLIND SAMPLES |
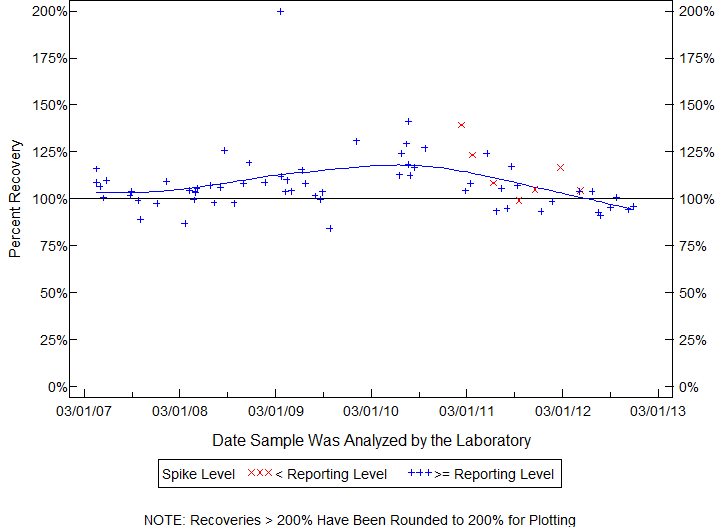
| EPTC, |
| Schedule: 2001 Testid: 82668GCM35 |
| Measured in MICROGRAMS PER LITER |
| 04/17/07 TO 11/27/12 |
| Open Data Set |
| Statistics for the Plotted Points |
| EPTC |
| Spike Level | N | Mean | Std-Dev. | Median | F_Pseudo |
|---|---|---|---|---|---|
| < Reporting Level | 7 | 114% | 14% | 109% | 14% |
| >= Reporting Level | 63 | 108% | 16% | 104% | 10% |
| Total | 70 | 109% | 16% | 105% | 10% |
| Miscellaneous Statistics for the Samples |
| EPTC |
| Characteristic | N | % | % Basis |
|---|---|---|---|
| Plotted | 70 | 100% | Spiked |
| Estimated Values | 1 | 1% | Spiked |
| Deleted Values | 1 | 1% | Spiked + Not Spiked |
| Spiked, Censored | 0 | 0% | Spiked |
| Spiked | 70 | . | |
| False Negatives | 0 | 0% | 0 out of 70 |
| Not Spiked | 72 | . | |
| False Positives | 0 | 0% | 0 out of 71 |
| BQS ORGANIC BLIND SAMPLES |
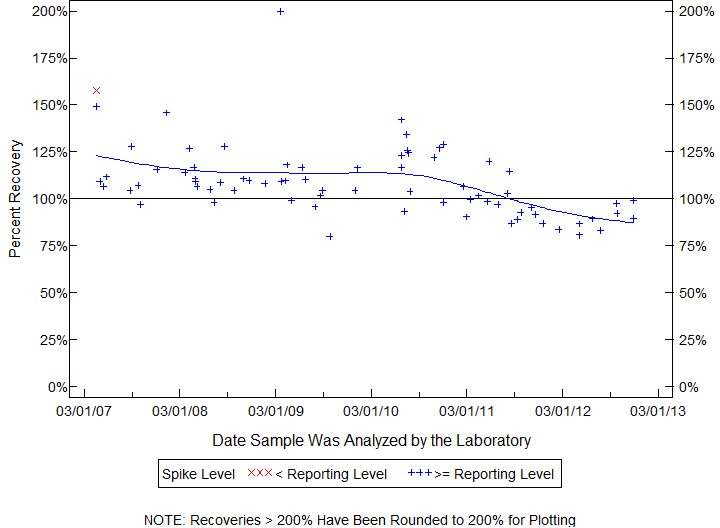
| PEBULATE, |
| Schedule: 2001 Testid: 82669GCM35 |
| Measured in MICROGRAMS PER LITER |
| 04/17/07 TO 11/28/12 |
| Open Data Set |
| Statistics for the Plotted Points |
| PEBULATE |
| Spike Level | N | Mean | Std-Dev. | Median | F_Pseudo |
|---|---|---|---|---|---|
| < Reporting Level | 1 | 158% | . | 158% | 0% |
| >= Reporting Level | 73 | 109% | 19% | 107% | 15% |
| Total | 74 | 109% | 19% | 107% | 15% |
| Miscellaneous Statistics for the Samples |
| PEBULATE |
| Characteristic | N | % | % Basis |
|---|---|---|---|
| Plotted | 74 | 100% | Spiked |
| Estimated Values | 1 | 1% | Spiked |
| Deleted Values | 1 | 1% | Spiked + Not Spiked |
| Spiked, Censored | 0 | 0% | Spiked |
| Spiked | 74 | . | |
| False Negatives | 0 | 0% | 0 out of 74 |
| Not Spiked | 68 | . | |
| False Positives | 1 | 1% | 1 out of 67 |
| BQS ORGANIC BLIND SAMPLES |
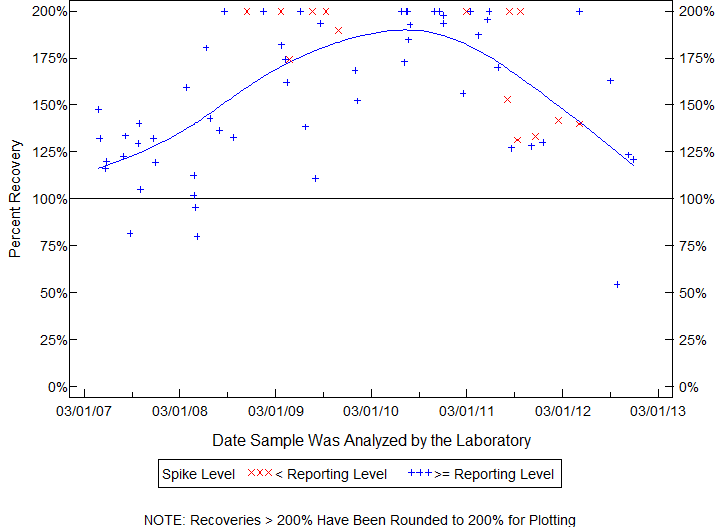
| TEBUTHIURON, |
| Schedule: 2001 Testid: 82670GCM35 |
| Measured in MICROGRAMS PER LITER |
| 04/26/07 TO 11/28/12 |
| Open Data Set |
| Statistics for the Plotted Points |
| TEBUTHIURON |
| Spike Level | N | Mean | Std-Dev. | Median | F_Pseudo |
|---|---|---|---|---|---|
| < Reporting Level | 14 | 176% | 29% | 195% | 43% |
| >= Reporting Level | 58 | 155% | 39% | 158% | 51% |
| Total | 72 | 159% | 38% | 163% | 51% |
| Miscellaneous Statistics for the Samples |
| TEBUTHIURON |
| Characteristic | N | % | % Basis |
|---|---|---|---|
| Plotted | 72 | 100% | Spiked |
| Estimated Values | 12 | 17% | Spiked |
| Deleted Values | 1 | 1% | Spiked + Not Spiked |
| Spiked, Censored | 0 | 0% | Spiked |
| Spiked | 72 | . | |
| False Negatives | 0 | 0% | 0 out of 72 |
| Not Spiked | 70 | . | |
| False Positives | 2 | 3% | 2 out of 69 |
| BQS ORGANIC BLIND SAMPLES |
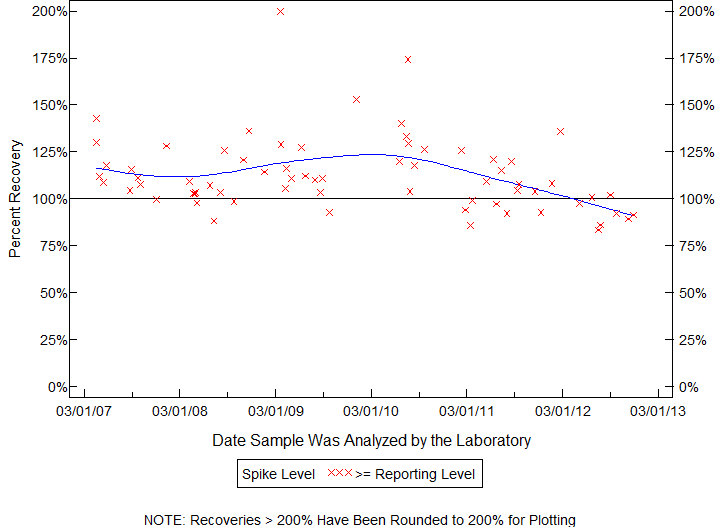
| MOLINATE, |
| Schedule: 2001 Testid: 82671GCM35 |
| Measured in MICROGRAMS PER LITER |
| 04/17/07 TO 11/27/12 |
| Open Data Set |
| Statistics for the Plotted Points |
| MOLINATE |
| Spike Level | N | Mean | Std-Dev. | Median | F_Pseudo |
|---|---|---|---|---|---|
| >= Reporting Level | 68 | 113% | 20% | 109% | 15% |
| Total | 68 | 113% | 20% | 109% | 15% |
| Miscellaneous Statistics for the Samples |
| MOLINATE |
| Characteristic | N | % | % Basis |
|---|---|---|---|
| Plotted | 68 | 97% | Spiked |
| Estimated Values | 1 | 1% | Spiked |
| Deleted Values | 1 | 1% | Spiked + Not Spiked |
| Spiked, Censored | 1 | 1% | Spiked |
| Spiked | 70 | . | |
| False Negatives | 1 | 1% | 1 out of 70 |
| Not Spiked | 72 | . | |
| False Positives | 0 | 0% | 0 out of 71 |
| BQS ORGANIC BLIND SAMPLES |
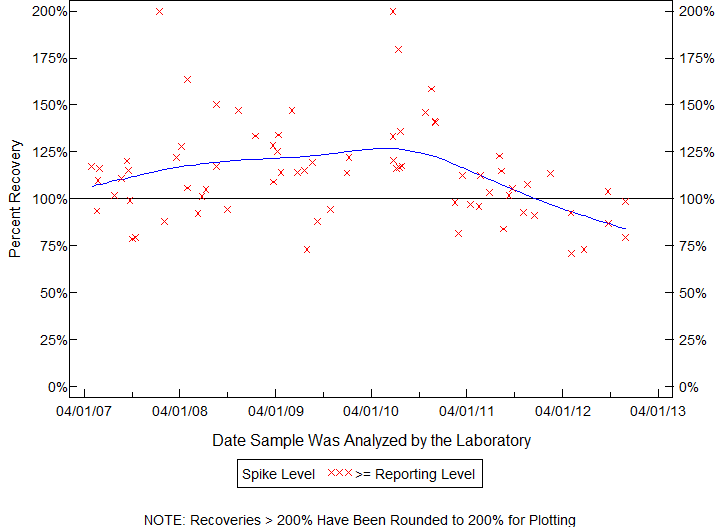
| ETHOPROPHOS, |
| Schedule: 2001 Testid: 82672GCM35 |
| Measured in MICROGRAMS PER LITER |
| 05/01/07 TO 11/28/12 |
| Open Data Set |
| Statistics for the Plotted Points |
| ETHOPROPHOS |
| Spike Level | N | Mean | Std-Dev. | Median | F_Pseudo |
|---|---|---|---|---|---|
| >= Reporting Level | 74 | 114% | 26% | 113% | 20% |
| Total | 74 | 114% | 26% | 113% | 20% |
| Miscellaneous Statistics for the Samples |
| ETHOPROPHOS |
| Characteristic | N | % | % Basis |
|---|---|---|---|
| Plotted | 74 | 99% | Spiked |
| Estimated Values | 2 | 3% | Spiked |
| Deleted Values | 1 | 1% | Spiked + Not Spiked |
| Spiked, Censored | 0 | 0% | Spiked |
| Spiked | 76 | . | |
| False Negatives | 1 | 1% | 1 out of 75 |
| Not Spiked | 66 | . | |
| False Positives | 2 | 3% | 2 out of 66 |
| BQS ORGANIC BLIND SAMPLES |
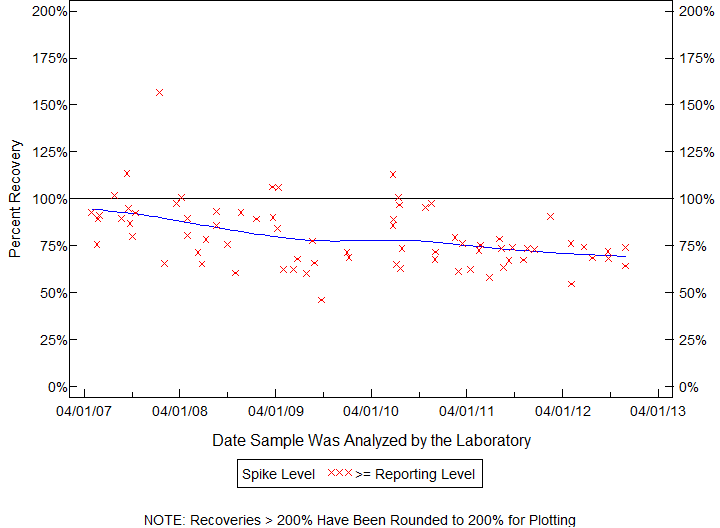
| BENFLURALIN, |
| Schedule: 2001 Testid: 82673GCM35 |
| Measured in MICROGRAMS PER LITER |
| 05/01/07 TO 11/28/12 |
| Open Data Set |
| Statistics for the Plotted Points |
| BENFLURALIN |
| Spike Level | N | Mean | Std-Dev. | Median | F_Pseudo |
|---|---|---|---|---|---|
| >= Reporting Level | 75 | 80% | 17% | 76% | 17% |
| Total | 75 | 80% | 17% | 76% | 17% |
| Miscellaneous Statistics for the Samples |
| BENFLURALIN |
| Characteristic | N | % | % Basis |
|---|---|---|---|
| Plotted | 75 | 100% | Spiked |
| Estimated Values | 2 | 3% | Spiked |
| Deleted Values | 1 | 1% | Spiked + Not Spiked |
| Spiked, Censored | 0 | 0% | Spiked |
| Spiked | 76 | . | |
| False Negatives | 0 | 0% | 0 out of 75 |
| Not Spiked | 66 | . | |
| False Positives | 6 | 9% | 6 out of 66 |
| BQS ORGANIC BLIND SAMPLES |
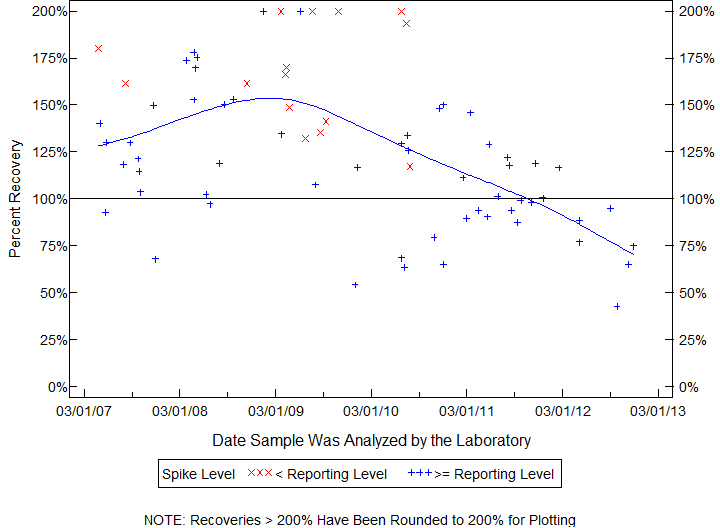
| CARBOFURAN |
| Permanently Estimated Compound |
| Schedule: 2001 Testid: 82674GCM35 |
| 04/26/07 TO 11/28/12 |
| Open Data Set |
| Statistics for the Plotted Points |
| CARBOFURAN |
| Spike Level | N | Mean | Std-Dev. | Median | F_Pseudo |
|---|---|---|---|---|---|
| < Reporting Level | 15 | 167% | 28% | 167% | 43% |
| >= Reporting Level | 57 | 115% | 36% | 117% | 31% |
| Total | 72 | 126% | 40% | 122% | 41% |
| Miscellaneous Statistics for the Samples |
| CARBOFURAN |
| Characteristic | N | % | % Basis |
|---|---|---|---|
| Plotted | 72 | 100% | Spiked |
| Estimated Values | 72 | 100% | Spiked |
| Deleted Values | 1 | 1% | Spiked + Not Spiked |
| Spiked, Censored | 0 | 0% | Spiked |
| Spiked | 72 | . | |
| False Negatives | 0 | 0% | 0 out of 72 |
| Not Spiked | 70 | . | |
| False Positives | 1 | 1% | 1 out of 69 |
| BQS ORGANIC BLIND SAMPLES |
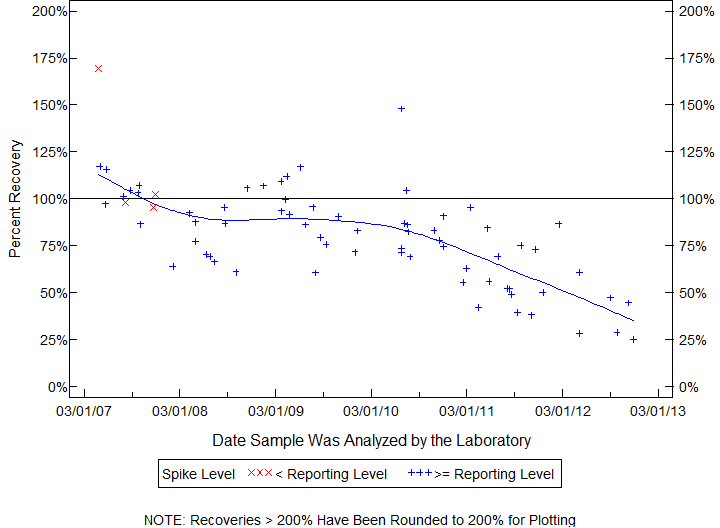
| TERBUFOS, |
| Schedule: 2001 Testid: 82675GCM35 |
| Measured in MICROGRAMS PER LITER |
| 04/26/07 TO 11/28/12 |
| Open Data Set |
| Statistics for the Plotted Points |
| TERBUFOS |
| Spike Level | N | Mean | Std-Dev. | Median | F_Pseudo |
|---|---|---|---|---|---|
| < Reporting Level | 4 | 117% | 36% | 100% | 29% |
| >= Reporting Level | 68 | 79% | 24% | 81% | 25% |
| Total | 72 | 81% | 26% | 83% | 24% |
| Miscellaneous Statistics for the Samples |
| TERBUFOS |
| Characteristic | N | % | % Basis |
|---|---|---|---|
| Plotted | 72 | 99% | Spiked |
| Estimated Values | 3 | 4% | Spiked |
| Deleted Values | 1 | 1% | Spiked + Not Spiked |
| Spiked, Censored | 0 | 0% | Spiked |
| Spiked | 73 | . | |
| False Negatives | 1 | 1% | 1 out of 73 |
| Not Spiked | 69 | . | |
| False Positives | 1 | 1% | 1 out of 68 |
| BQS ORGANIC BLIND SAMPLES |
| PROPYZAMIDE (PRONAMIDE), |
| Schedule: 2001 Testid: 82676GCM35 |
| Measured in MICROGRAMS PER LITER |
| 04/17/07 TO 11/27/12 |
| Open Data Set |

| Statistics for the Plotted Points |
| PROPYZAMIDE (PRONAMIDE) |
| Spike Level | N | Mean | Std-Dev. | Median | F_Pseudo |
|---|---|---|---|---|---|
| >= Reporting Level | 62 | 111% | 26% | 108% | 24% |
| Total | 62 | 111% | 26% | 108% | 24% |
| Miscellaneous Statistics for the Samples |
| PROPYZAMIDE (PRONAMIDE) |
| Characteristic | N | % | % Basis |
|---|---|---|---|
| Plotted | 62 | 89% | Spiked |
| Estimated Values | 1 | 1% | Spiked |
| Deleted Values | 1 | 1% | Spiked + Not Spiked |
| Spiked, Censored | 0 | 0% | Spiked |
| Spiked | 70 | . | |
| False Negatives | 8 | 11% | 8 out of 70 |
| Not Spiked | 72 | . | |
| False Positives | 3 | 4% | 3 out of 71 |
| BQS ORGANIC BLIND SAMPLES |
| DISULFOTON |
| Permanently Estimated Compound |
| Schedule: 2001 Testid: 82677GCM35 |
| 04/26/07 TO 11/08/12 |
| Open Data Set |
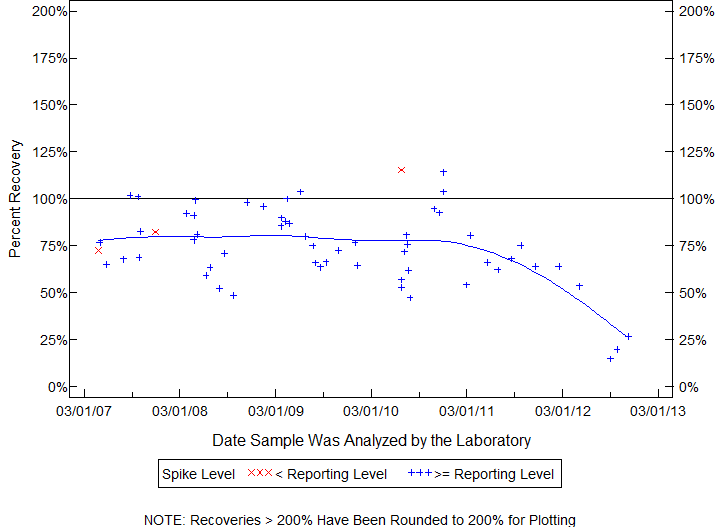
| Statistics for the Plotted Points |
| DISULFOTON |
| Spike Level | N | Mean | Std-Dev. | Median | F_Pseudo |
|---|---|---|---|---|---|
| < Reporting Level | 3 | 90% | 22% | 83% | 32% |
| >= Reporting Level | 56 | 74% | 20% | 74% | 19% |
| Total | 59 | 74% | 21% | 75% | 19% |
| Miscellaneous Statistics for the Samples |
| DISULFOTON |
| Characteristic | N | % | % Basis |
|---|---|---|---|
| Plotted | 59 | 98% | Spiked |
| Estimated Values | 59 | 98% | Spiked |
| Deleted Values | 1 | 1% | Spiked + Not Spiked |
| Spiked, Censored | 0 | 0% | Spiked |
| Spiked | 60 | . | |
| False Negatives | 1 | 2% | 1 out of 60 |
| Not Spiked | 62 | . | |
| False Positives | 1 | 2% | 1 out of 61 |
| BQS ORGANIC BLIND SAMPLES |
| TRI-ALLATE, |
| Schedule: 2001 Testid: 82678GCM35 |
| Measured in MICROGRAMS PER LITER |
| 05/01/07 TO 11/27/12 |
| Open Data Set |
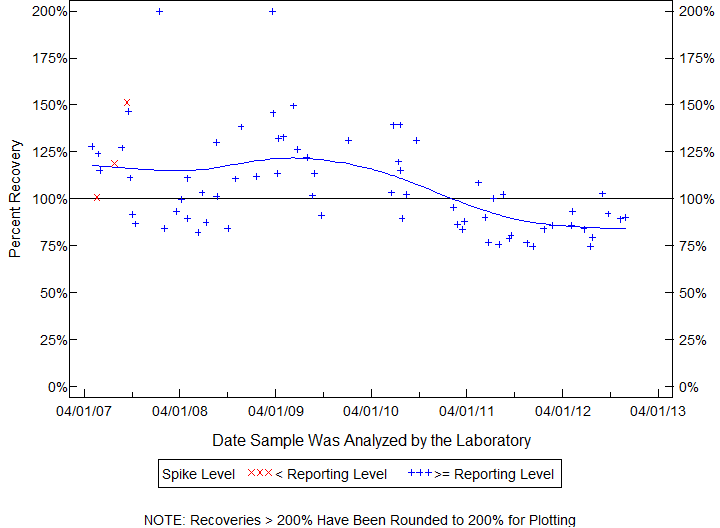
| Statistics for the Plotted Points |
| TRI-ALLATE |
| Spike Level | N | Mean | Std-Dev. | Median | F_Pseudo |
|---|---|---|---|---|---|
| < Reporting Level | 3 | 124% | 26% | 119% | 38% |
| >= Reporting Level | 68 | 107% | 26% | 101% | 27% |
| Total | 71 | 107% | 26% | 102% | 28% |
| Miscellaneous Statistics for the Samples |
| TRI-ALLATE |
| Characteristic | N | % | % Basis |
|---|---|---|---|
| Plotted | 71 | 100% | Spiked |
| Estimated Values | 1 | 1% | Spiked |
| Deleted Values | 1 | 1% | Spiked + Not Spiked |
| Spiked, Censored | 0 | 0% | Spiked |
| Spiked | 72 | . | |
| False Negatives | 0 | 0% | 0 out of 71 |
| Not Spiked | 70 | . | |
| False Positives | 0 | 0% | 0 out of 70 |
| BQS ORGANIC BLIND SAMPLES |
| PROPANIL, |
| Schedule: 2001 Testid: 82679GCM35 |
| Measured in MICROGRAMS PER LITER |
| 05/01/07 TO 11/28/12 |
| Open Data Set |
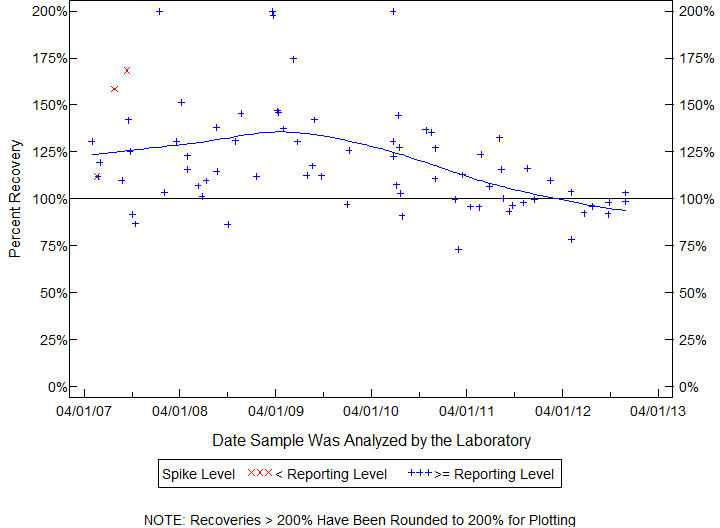
| Statistics for the Plotted Points |
| PROPANIL |
| Spike Level | N | Mean | Std-Dev. | Median | F_Pseudo |
|---|---|---|---|---|---|
| < Reporting Level | 3 | 146% | 30% | 159% | 42% |
| >= Reporting Level | 72 | 119% | 27% | 113% | 23% |
| Total | 75 | 121% | 28% | 113% | 24% |
| Miscellaneous Statistics for the Samples |
| PROPANIL |
| Characteristic | N | % | % Basis |
|---|---|---|---|
| Plotted | 75 | 100% | Spiked |
| Estimated Values | 3 | 4% | Spiked |
| Deleted Values | 1 | 1% | Spiked + Not Spiked |
| Spiked, Censored | 0 | 0% | Spiked |
| Spiked | 76 | . | |
| False Negatives | 0 | 0% | 0 out of 75 |
| Not Spiked | 66 | . | |
| False Positives | 0 | 0% | 0 out of 66 |
| BQS ORGANIC BLIND SAMPLES |
| CARBARYL |
| Permanently Estimated Compound |
| Schedule: 2001 Testid: 82680GCM35 |
| 04/26/07 TO 11/28/12 |
| Open Data Set |
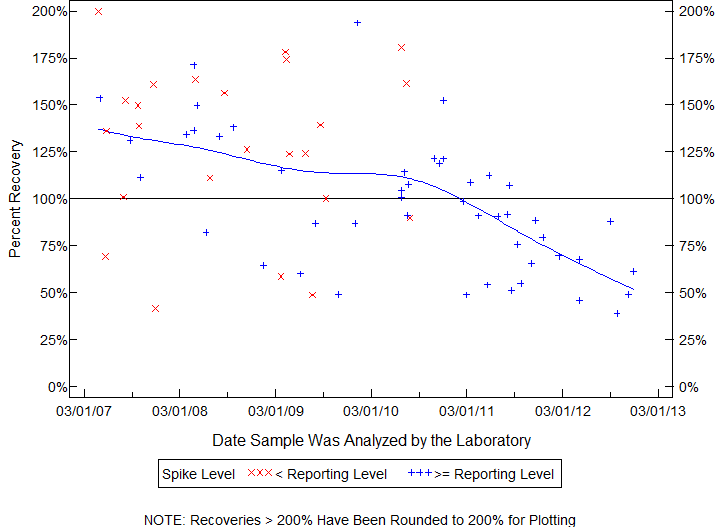
| Statistics for the Plotted Points |
| CARBARYL |
| Spike Level | N | Mean | Std-Dev. | Median | F_Pseudo |
|---|---|---|---|---|---|
| < Reporting Level | 24 | 129% | 43% | 138% | 45% |
| >= Reporting Level | 48 | 97% | 36% | 92% | 40% |
| Total | 72 | 108% | 41% | 108% | 48% |
| Miscellaneous Statistics for the Samples |
| CARBARYL |
| Characteristic | N | % | % Basis |
|---|---|---|---|
| Plotted | 72 | 100% | Spiked |
| Estimated Values | 72 | 100% | Spiked |
| Deleted Values | 1 | 1% | Spiked + Not Spiked |
| Spiked, Censored | 0 | 0% | Spiked |
| Spiked | 72 | . | |
| False Negatives | 0 | 0% | 0 out of 72 |
| Not Spiked | 70 | . | |
| False Positives | 2 | 3% | 2 out of 69 |
| BQS ORGANIC BLIND SAMPLES |
| THIOBENCARB, |
| Schedule: 2001 Testid: 82681GCM35 |
| Measured in MICROGRAMS PER LITER |
| 05/01/07 TO 11/28/12 |
| Open Data Set |
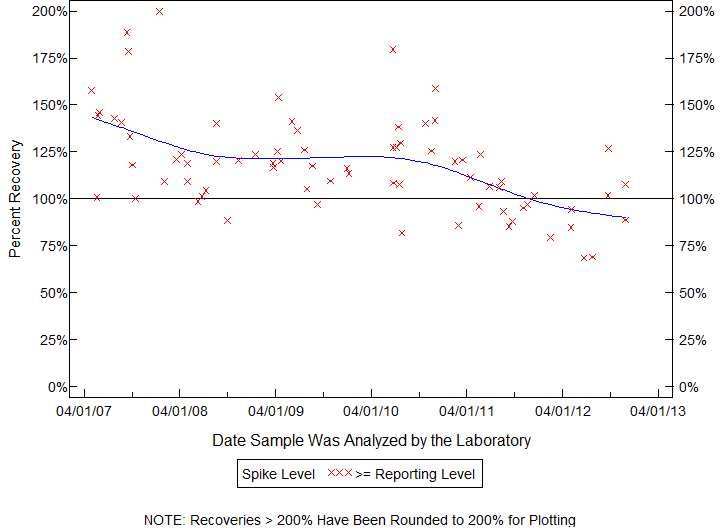
| Statistics for the Plotted Points |
| THIOBENCARB |
| Spike Level | N | Mean | Std-Dev. | Median | F_Pseudo |
|---|---|---|---|---|---|
| >= Reporting Level | 75 | 118% | 26% | 118% | 21% |
| Total | 75 | 118% | 26% | 118% | 21% |
| Miscellaneous Statistics for the Samples |
| THIOBENCARB |
| Characteristic | N | % | % Basis |
|---|---|---|---|
| Plotted | 75 | 100% | Spiked |
| Estimated Values | 0 | 0% | Spiked |
| Deleted Values | 1 | 1% | Spiked + Not Spiked |
| Spiked, Censored | 0 | 0% | Spiked |
| Spiked | 76 | . | |
| False Negatives | 0 | 0% | 0 out of 75 |
| Not Spiked | 66 | . | |
| False Positives | 2 | 3% | 2 out of 66 |
| BQS ORGANIC BLIND SAMPLES |
| DACTHAL, |
| Schedule: 2001 Testid: 82682GCM35 |
| Measured in MICROGRAMS PER LITER |
| 04/17/07 TO 11/27/12 |
| Open Data Set |
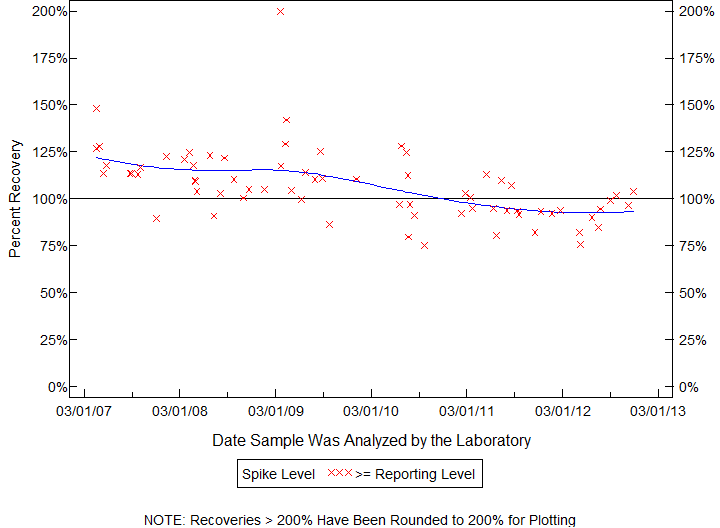
| Statistics for the Plotted Points |
| DACTHAL |
| Spike Level | N | Mean | Std-Dev. | Median | F_Pseudo |
|---|---|---|---|---|---|
| >= Reporting Level | 70 | 107% | 19% | 105% | 17% |
| Total | 70 | 107% | 19% | 105% | 17% |
| Miscellaneous Statistics for the Samples |
| DACTHAL |
| Characteristic | N | % | % Basis |
|---|---|---|---|
| Plotted | 70 | 100% | Spiked |
| Estimated Values | 3 | 4% | Spiked |
| Deleted Values | 1 | 1% | Spiked + Not Spiked |
| Spiked, Censored | 0 | 0% | Spiked |
| Spiked | 70 | . | |
| False Negatives | 0 | 0% | 0 out of 70 |
| Not Spiked | 72 | . | |
| False Positives | 0 | 0% | 0 out of 71 |
| BQS ORGANIC BLIND SAMPLES |
| PENDIMETHALIN, |
| Schedule: 2001 Testid: 82683GCM35 |
| Measured in MICROGRAMS PER LITER |
| 04/26/07 TO 11/28/12 |
| Open Data Set |
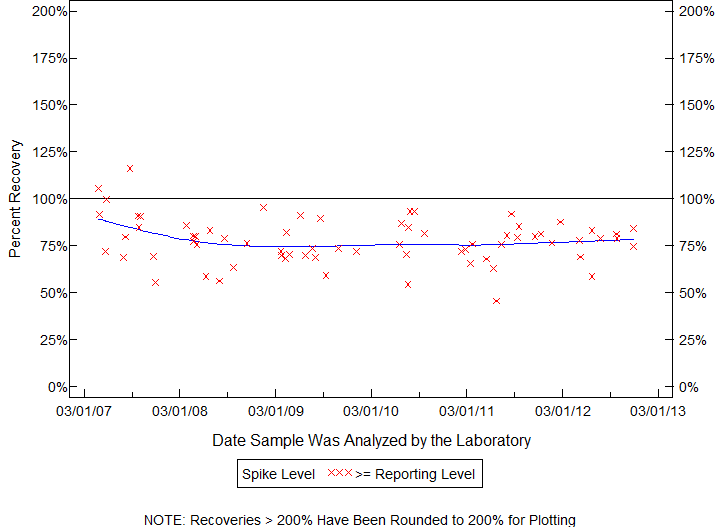
| Statistics for the Plotted Points |
| PENDIMETHALIN |
| Spike Level | N | Mean | Std-Dev. | Median | F_Pseudo |
|---|---|---|---|---|---|
| >= Reporting Level | 70 | 78% | 12% | 78% | 11% |
| Total | 70 | 78% | 12% | 78% | 11% |
| Miscellaneous Statistics for the Samples |
| PENDIMETHALIN |
| Characteristic | N | % | % Basis |
|---|---|---|---|
| Plotted | 70 | 100% | Spiked |
| Estimated Values | 3 | 4% | Spiked |
| Deleted Values | 1 | 1% | Spiked + Not Spiked |
| Spiked, Censored | 0 | 0% | Spiked |
| Spiked | 70 | . | |
| False Negatives | 0 | 0% | 0 out of 70 |
| Not Spiked | 72 | . | |
| False Positives | 1 | 1% | 1 out of 71 |
| BQS ORGANIC BLIND SAMPLES |
| NAPROPAMIDE, |
| Schedule: 2001 Testid: 82684GCM35 |
| Measured in MICROGRAMS PER LITER |
| 05/01/07 TO 11/28/12 |
| Open Data Set |
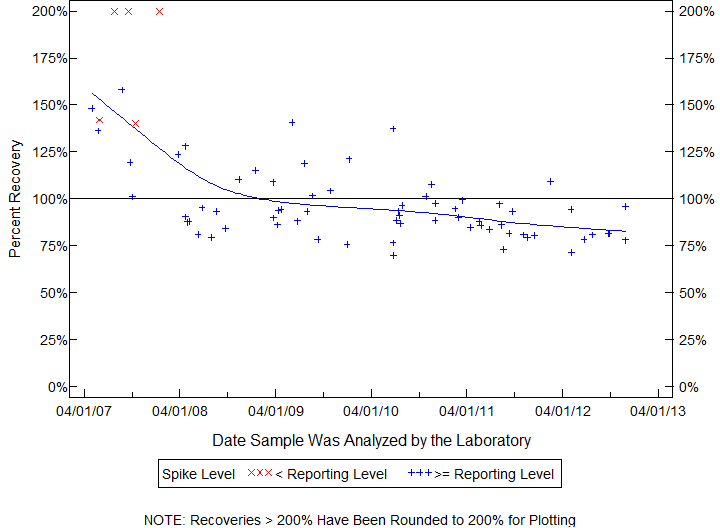
| Statistics for the Plotted Points |
| NAPROPAMIDE |
| Spike Level | N | Mean | Std-Dev. | Median | F_Pseudo |
|---|---|---|---|---|---|
| < Reporting Level | 5 | 176% | 32% | 200% | 43% |
| >= Reporting Level | 67 | 96% | 19% | 91% | 15% |
| Total | 72 | 102% | 28% | 93% | 19% |
| Miscellaneous Statistics for the Samples |
| NAPROPAMIDE |
| Characteristic | N | % | % Basis |
|---|---|---|---|
| Plotted | 72 | 97% | Spiked |
| Estimated Values | 5 | 7% | Spiked |
| Deleted Values | 1 | 1% | Spiked + Not Spiked |
| Spiked, Censored | 2 | 3% | Spiked |
| Spiked | 75 | . | |
| False Negatives | 0 | 0% | 0 out of 74 |
| Not Spiked | 67 | . | |
| False Positives | 1 | 1% | 1 out of 67 |
| BQS ORGANIC BLIND SAMPLES |
| PROPARGITE, |
| Schedule: 2001 Testid: 82685GCM35 |
| Measured in MICROGRAMS PER LITER |
| 04/26/07 TO 11/28/12 |
| Open Data Set |
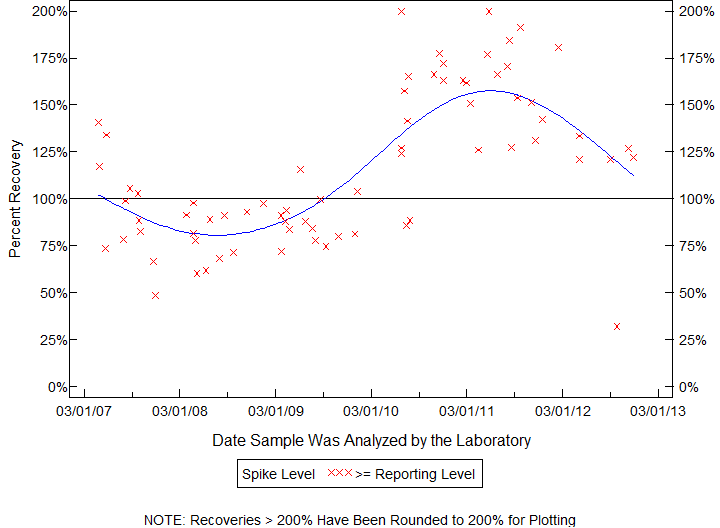
| Statistics for the Plotted Points |
| PROPARGITE |
| Spike Level | N | Mean | Std-Dev. | Median | F_Pseudo |
|---|---|---|---|---|---|
| >= Reporting Level | 72 | 116% | 40% | 105% | 50% |
| Total | 72 | 116% | 40% | 105% | 50% |
| Miscellaneous Statistics for the Samples |
| PROPARGITE |
| Characteristic | N | % | % Basis |
|---|---|---|---|
| Plotted | 72 | 100% | Spiked |
| Estimated Values | 8 | 11% | Spiked |
| Deleted Values | 1 | 1% | Spiked + Not Spiked |
| Spiked, Censored | 0 | 0% | Spiked |
| Spiked | 72 | . | |
| False Negatives | 0 | 0% | 0 out of 72 |
| Not Spiked | 70 | . | |
| False Positives | 1 | 1% | 1 out of 69 |
| BQS ORGANIC BLIND SAMPLES |
| AZINPHOS-METHYL |
| Permanently Estimated Compound |
| Schedule: 2001 Testid: 82686GCM35 |
| 04/26/07 TO 11/28/12 |
| Open Data Set |
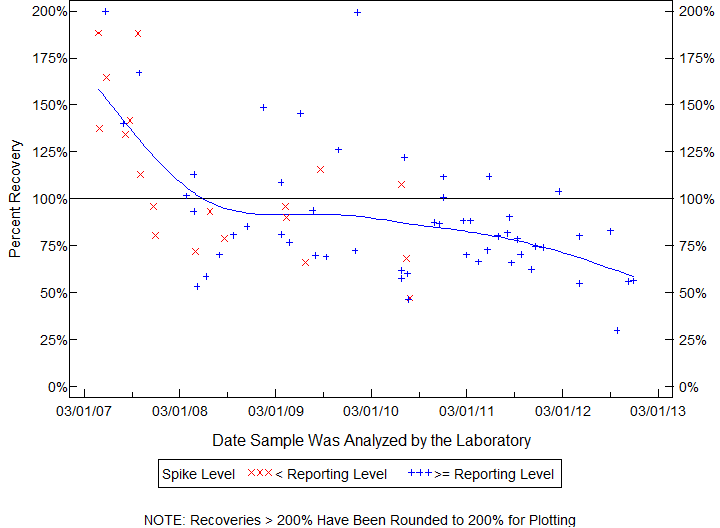
| Statistics for the Plotted Points |
| AZINPHOS-METHYL |
| Spike Level | N | Mean | Std-Dev. | Median | F_Pseudo |
|---|---|---|---|---|---|
| < Reporting Level | 19 | 110% | 40% | 96% | 43% |
| >= Reporting Level | 53 | 89% | 35% | 81% | 24% |
| Total | 72 | 95% | 37% | 84% | 31% |
| Miscellaneous Statistics for the Samples |
| AZINPHOS-METHYL |
| Characteristic | N | % | % Basis |
|---|---|---|---|
| Plotted | 72 | 100% | Spiked |
| Estimated Values | 72 | 100% | Spiked |
| Deleted Values | 1 | 1% | Spiked + Not Spiked |
| Spiked, Censored | 0 | 0% | Spiked |
| Spiked | 72 | . | |
| False Negatives | 0 | 0% | 0 out of 72 |
| Not Spiked | 70 | . | |
| False Positives | 1 | 1% | 1 out of 69 |
| BQS ORGANIC BLIND SAMPLES |
| 1RS CIS-PERMETHRIN, |
| Schedule: 2001 Testid: 82687GCM35 |
| Measured in MICROGRAMS PER LITER |
| 05/01/07 TO 11/28/12 |
| Open Data Set |
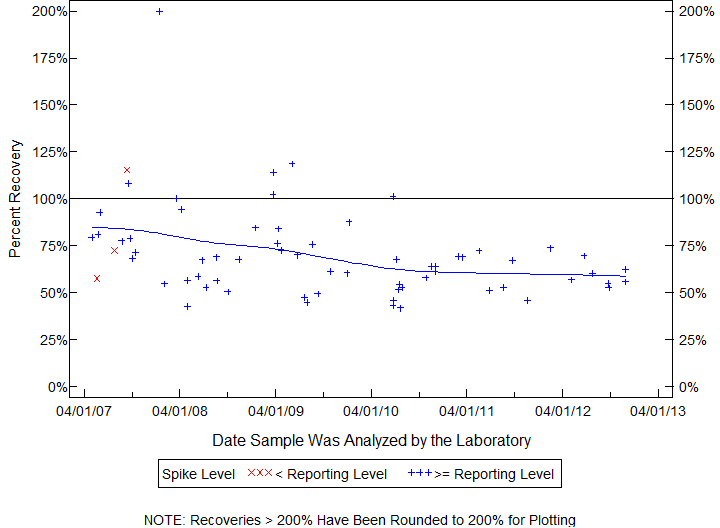
| Statistics for the Plotted Points |
| 1RS CIS-PERMETHRIN |
| Spike Level | N | Mean | Std-Dev. | Median | F_Pseudo |
|---|---|---|---|---|---|
| < Reporting Level | 3 | 82% | 30% | 73% | 43% |
| >= Reporting Level | 63 | 70% | 25% | 67% | 17% |
| Total | 66 | 70% | 25% | 67% | 17% |
| Miscellaneous Statistics for the Samples |
| 1RS CIS-PERMETHRIN |
| Characteristic | N | % | % Basis |
|---|---|---|---|
| Plotted | 66 | 100% | Spiked |
| Estimated Values | 5 | 8% | Spiked |
| Deleted Values | 1 | 1% | Spiked + Not Spiked |
| Spiked, Censored | 0 | 0% | Spiked |
| Spiked | 67 | . | |
| False Negatives | 0 | 0% | 0 out of 66 |
| Not Spiked | 75 | . | |
| False Positives | 2 | 3% | 2 out of 75 |