| Statistics for the Plotted Points |
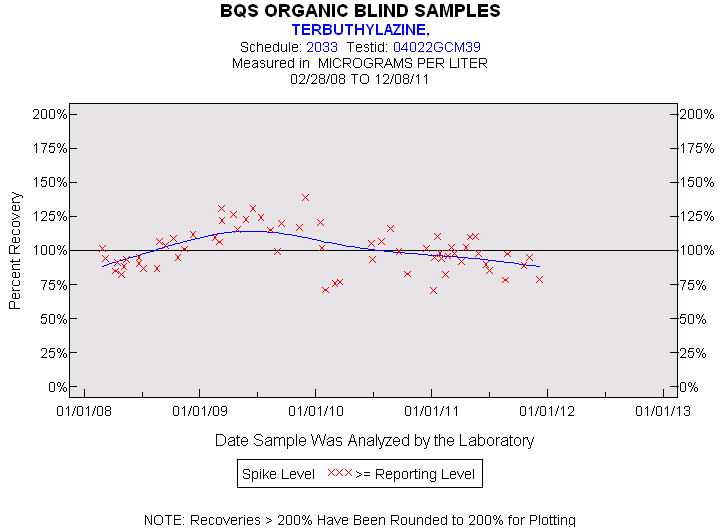
| TERBUTHYLAZINE |
| Spike Level | N | Mean | Std-Dev. | Median | F_Pseudo |
|---|---|---|---|---|---|
| >= Reporting Level | 64 | 101% | 15% | 99% | 15% |
| Total | 64 | 101% | 15% | 99% | 15% |
| Miscellaneous Statistics for the Samples |
| TERBUTHYLAZINE |
| Characteristic | N | % | % Basis |
|---|---|---|---|
| Plotted | 64 | 98% | Spiked |
| Estimated Values | 1 | 2% | Spiked |
| Deleted Values | 0 | 0% | Spiked + Not Spiked |
| Spiked, Censored | 0 | 0% | Spiked |
| Spiked | 65 | . | |
| False Negatives | 1 | 2% | 1 out of 65 |
| Not Spiked | 118 | . | |
| False Positives | 2 | 2% | 2 out of 118 |
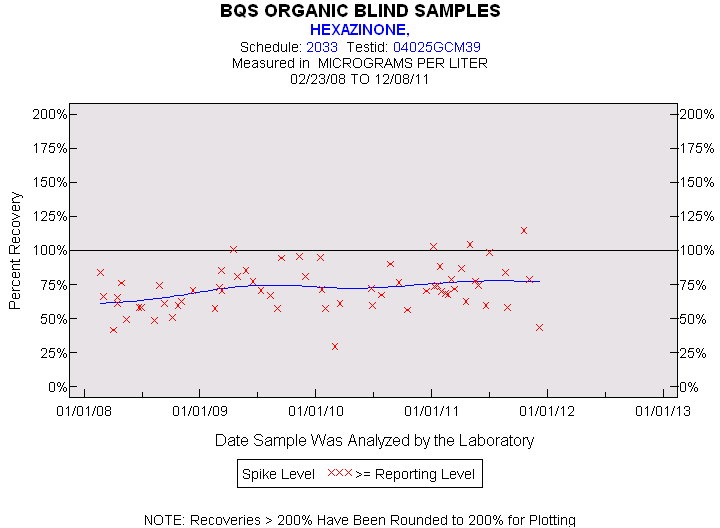
| Statistics for the Plotted Points |
| HEXAZINONE |
| Spike Level | N | Mean | Std-Dev. | Median | F_Pseudo |
|---|---|---|---|---|---|
| >= Reporting Level | 63 | 72% | 16% | 71% | 16% |
| Total | 63 | 72% | 16% | 71% | 16% |
| Miscellaneous Statistics for the Samples |
| HEXAZINONE |
| Characteristic | N | % | % Basis |
|---|---|---|---|
| Plotted | 63 | 98% | Spiked |
| Estimated Values | 4 | 6% | Spiked |
| Deleted Values | 0 | 0% | Spiked + Not Spiked |
| Spiked, Censored | 0 | 0% | Spiked |
| Spiked | 64 | . | |
| False Negatives | 1 | 2% | 1 out of 64 |
| Not Spiked | 119 | . | |
| False Positives | 1 | 1% | 1 out of 119 |
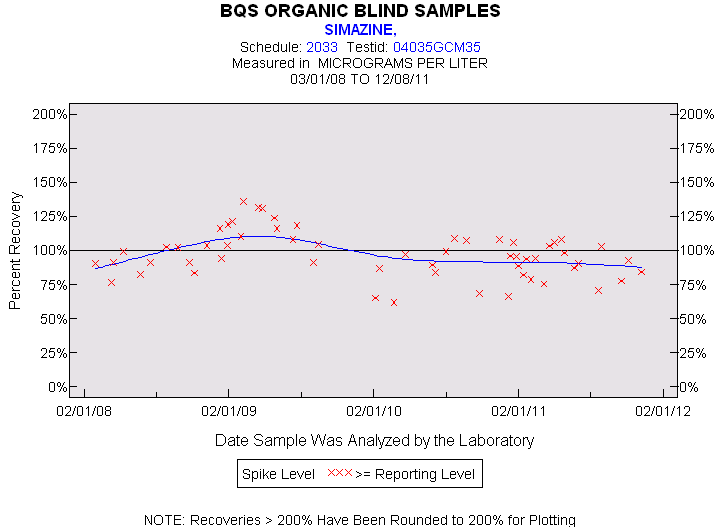
| Statistics for the Plotted Points |
| SIMAZINE |
| Spike Level | N | Mean | Std-Dev. | Median | F_Pseudo |
|---|---|---|---|---|---|
| >= Reporting Level | 58 | 97% | 17% | 96% | 15% |
| Total | 58 | 97% | 17% | 96% | 15% |
| Miscellaneous Statistics for the Samples |
| SIMAZINE |
| Characteristic | N | % | % Basis |
|---|---|---|---|
| Plotted | 58 | 97% | Spiked |
| Estimated Values | 1 | 2% | Spiked |
| Deleted Values | 0 | 0% | Spiked + Not Spiked |
| Spiked, Censored | 0 | 0% | Spiked |
| Spiked | 60 | . | |
| False Negatives | 2 | 3% | 2 out of 60 |
| Not Spiked | 123 | . | |
| False Positives | 24 | 20% | 24 out of 123 |
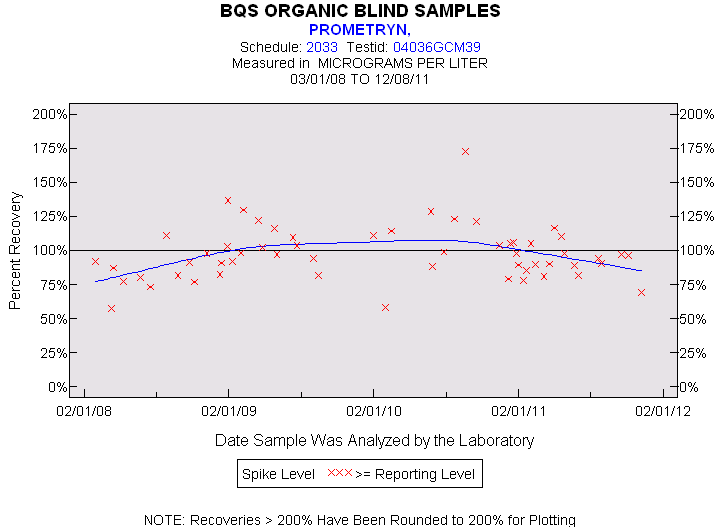
| Statistics for the Plotted Points |
| PROMETRYN |
| Spike Level | N | Mean | Std-Dev. | Median | F_Pseudo |
|---|---|---|---|---|---|
| >= Reporting Level | 57 | 98% | 20% | 96% | 16% |
| Total | 57 | 98% | 20% | 96% | 16% |
| Miscellaneous Statistics for the Samples |
| PROMETRYN |
| Characteristic | N | % | % Basis |
|---|---|---|---|
| Plotted | 57 | 97% | Spiked |
| Estimated Values | 3 | 5% | Spiked |
| Deleted Values | 0 | 0% | Spiked + Not Spiked |
| Spiked, Censored | 0 | 0% | Spiked |
| Spiked | 59 | . | |
| False Negatives | 2 | 3% | 2 out of 59 |
| Not Spiked | 124 | . | |
| False Positives | 3 | 2% | 3 out of 124 |
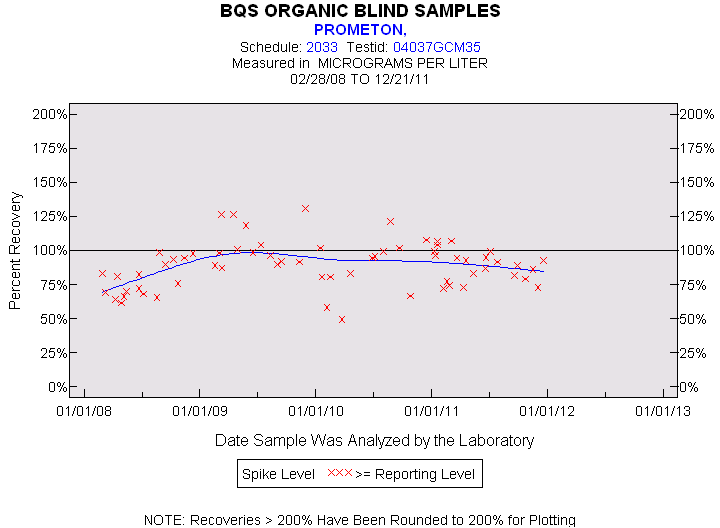
| Statistics for the Plotted Points |
| PROMETON |
| Spike Level | N | Mean | Std-Dev. | Median | F_Pseudo |
|---|---|---|---|---|---|
| >= Reporting Level | 66 | 89% | 17% | 91% | 16% |
| Total | 66 | 89% | 17% | 91% | 16% |
| Miscellaneous Statistics for the Samples |
| PROMETON |
| Characteristic | N | % | % Basis |
|---|---|---|---|
| Plotted | 66 | 99% | Spiked |
| Estimated Values | 1 | 1% | Spiked |
| Deleted Values | 0 | 0% | Spiked + Not Spiked |
| Spiked, Censored | 0 | 0% | Spiked |
| Spiked | 67 | . | |
| False Negatives | 1 | 1% | 1 out of 67 |
| Not Spiked | 116 | . | |
| False Positives | 6 | 5% | 6 out of 116 |
| Statistics for the Plotted Points |
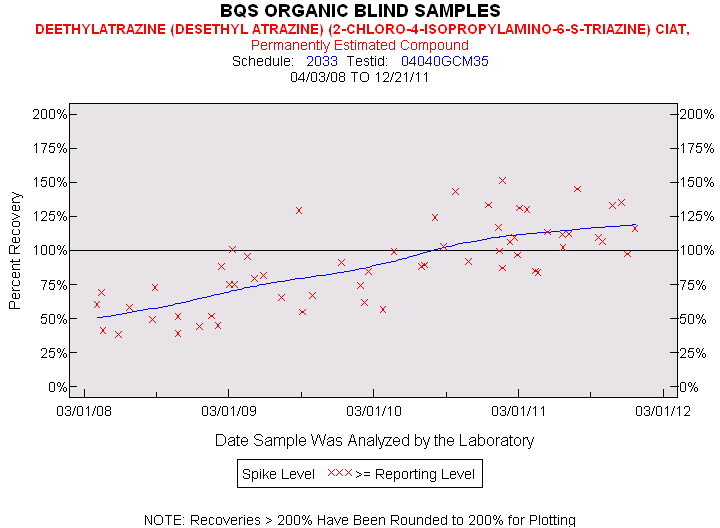
| DEETHYLATRAZINE (DESETHYL ATRAZINE) (2-CHLORO-4-ISOPROPYLAMINO-6-S-TRIAZINE) CIAT |
| Spike Level | N | Mean | Std-Dev. | Median | F_Pseudo |
|---|---|---|---|---|---|
| >= Reporting Level | 58 | 91% | 30% | 90% | 33% |
| Total | 58 | 91% | 30% | 90% | 33% |
| Miscellaneous Statistics for the Samples |
| DEETHYLATRAZINE (DESETHYL ATRAZINE) (2-CHLORO-4-ISOPROPYLAMINO-6-S-TRIAZINE) CIAT |
| Characteristic | N | % | % Basis |
|---|---|---|---|
| Plotted | 58 | 97% | Spiked |
| Estimated Values | 58 | 97% | Spiked |
| Deleted Values | 0 | 0% | Spiked + Not Spiked |
| Spiked, Censored | 0 | 0% | Spiked |
| Spiked | 60 | . | |
| False Negatives | 2 | 3% | 2 out of 60 |
| Not Spiked | 123 | . | |
| False Positives | 2 | 2% | 2 out of 123 |
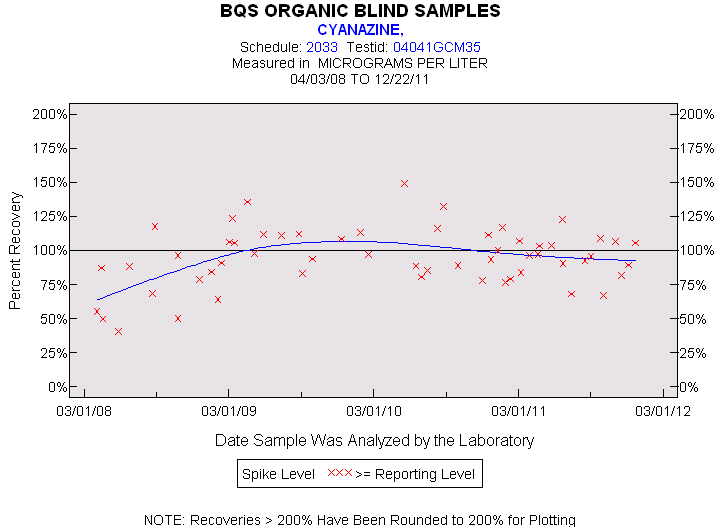
| Statistics for the Plotted Points |
| CYANAZINE |
| Spike Level | N | Mean | Std-Dev. | Median | F_Pseudo |
|---|---|---|---|---|---|
| >= Reporting Level | 57 | 95% | 21% | 96% | 19% |
| Total | 57 | 95% | 21% | 96% | 19% |
| Miscellaneous Statistics for the Samples |
| CYANAZINE |
| Characteristic | N | % | % Basis |
|---|---|---|---|
| Plotted | 57 | 93% | Spiked |
| Estimated Values | 1 | 2% | Spiked |
| Deleted Values | 0 | 0% | Spiked + Not Spiked |
| Spiked, Censored | 0 | 0% | Spiked |
| Spiked | 61 | . | |
| False Negatives | 4 | 7% | 4 out of 61 |
| Not Spiked | 122 | . | |
| False Positives | 3 | 2% | 3 out of 122 |
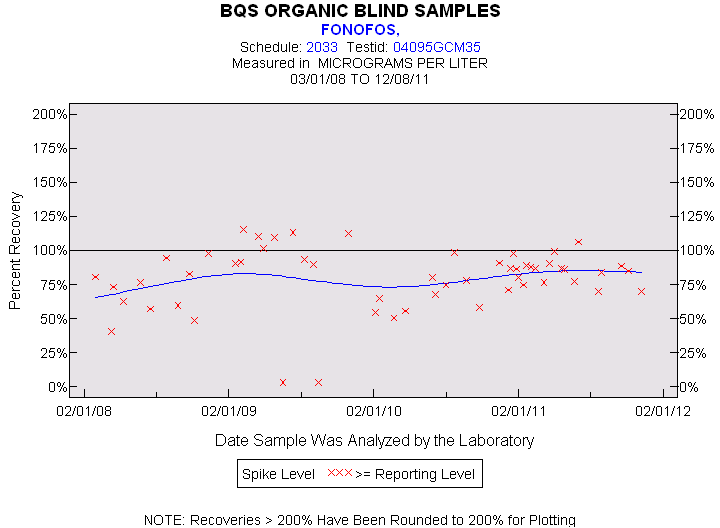
| Statistics for the Plotted Points |
| FONOFOS |
| Spike Level | N | Mean | Std-Dev. | Median | F_Pseudo |
|---|---|---|---|---|---|
| >= Reporting Level | 55 | 79% | 23% | 84% | 16% |
| Total | 55 | 79% | 23% | 84% | 16% |
| Miscellaneous Statistics for the Samples |
| FONOFOS |
| Characteristic | N | % | % Basis |
|---|---|---|---|
| Plotted | 55 | 92% | Spiked |
| Estimated Values | 2 | 3% | Spiked |
| Deleted Values | 0 | 0% | Spiked + Not Spiked |
| Spiked, Censored | 0 | 0% | Spiked |
| Spiked | 60 | . | |
| False Negatives | 5 | 8% | 5 out of 60 |
| Not Spiked | 123 | . | |
| False Positives | 1 | 1% | 1 out of 123 |
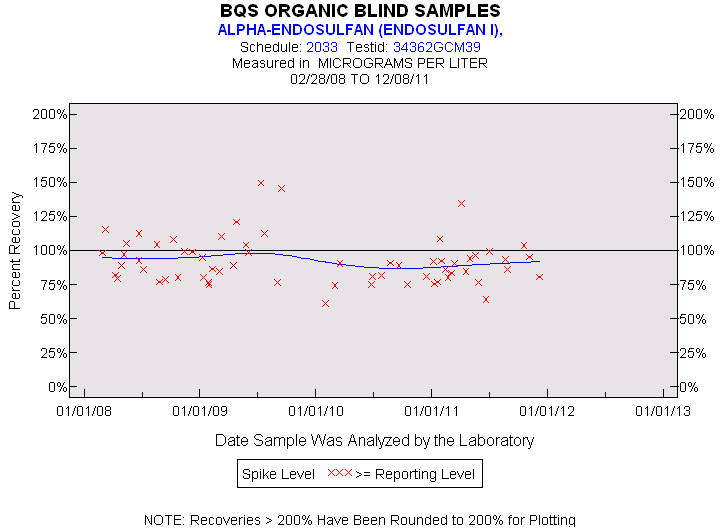
| Statistics for the Plotted Points |
| ALPHA-ENDOSULFAN (ENDOSULFAN I) |
| Spike Level | N | Mean | Std-Dev. | Median | F_Pseudo |
|---|---|---|---|---|---|
| >= Reporting Level | 63 | 92% | 17% | 89% | 14% |
| Total | 63 | 92% | 17% | 89% | 14% |
| Miscellaneous Statistics for the Samples |
| ALPHA-ENDOSULFAN (ENDOSULFAN I) |
| Characteristic | N | % | % Basis |
|---|---|---|---|
| Plotted | 63 | 97% | Spiked |
| Estimated Values | 3 | 5% | Spiked |
| Deleted Values | 0 | 0% | Spiked + Not Spiked |
| Spiked, Censored | 0 | 0% | Spiked |
| Spiked | 65 | . | |
| False Negatives | 2 | 3% | 2 out of 65 |
| Not Spiked | 118 | . | |
| False Positives | 2 | 2% | 2 out of 118 |
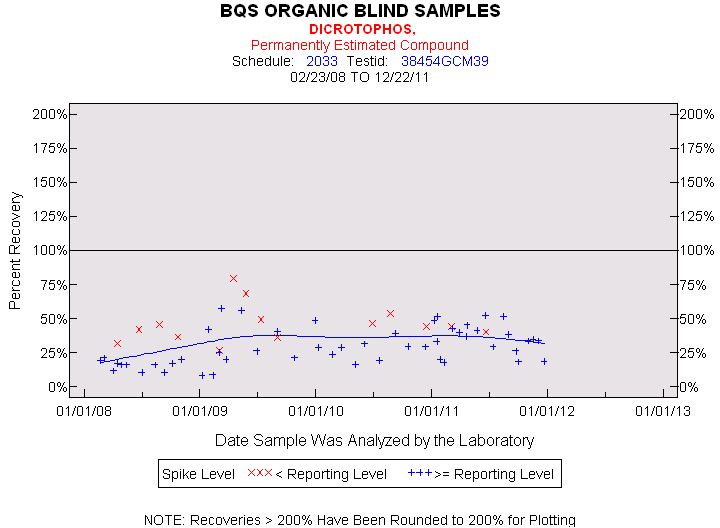
| Statistics for the Plotted Points |
| DICROTOPHOS |
| Spike Level | N | Mean | Std-Dev. | Median | F_Pseudo |
|---|---|---|---|---|---|
| < Reporting Level | 14 | 46% | 14% | 44% | 9% |
| >= Reporting Level | 51 | 29% | 13% | 29% | 16% |
| Total | 65 | 33% | 15% | 32% | 17% |
| Miscellaneous Statistics for the Samples |
| DICROTOPHOS |
| Characteristic | N | % | % Basis |
|---|---|---|---|
| Plotted | 65 | 97% | Spiked |
| Estimated Values | 65 | 97% | Spiked |
| Deleted Values | 0 | 0% | Spiked + Not Spiked |
| Spiked, Censored | 0 | 0% | Spiked |
| Spiked | 67 | . | |
| False Negatives | 2 | 3% | 2 out of 67 |
| Not Spiked | 116 | . | |
| False Positives | 3 | 3% | 3 out of 116 |
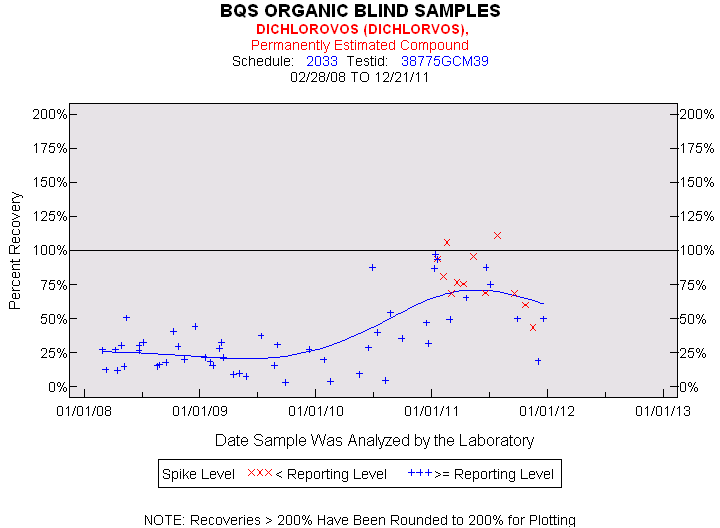
| Statistics for the Plotted Points |
| DICHLOROVOS (DICHLORVOS) |
| Spike Level | N | Mean | Std-Dev. | Median | F_Pseudo |
|---|---|---|---|---|---|
| < Reporting Level | 12 | 79% | 19% | 76% | 19% |
| >= Reporting Level | 52 | 34% | 24% | 29% | 22% |
| Total | 64 | 42% | 29% | 32% | 36% |
| Miscellaneous Statistics for the Samples |
| DICHLOROVOS (DICHLORVOS) |
| Characteristic | N | % | % Basis |
|---|---|---|---|
| Plotted | 64 | 96% | Spiked |
| Estimated Values | 64 | 96% | Spiked |
| Deleted Values | 0 | 0% | Spiked + Not Spiked |
| Spiked, Censored | 0 | 0% | Spiked |
| Spiked | 67 | . | |
| False Negatives | 3 | 4% | 3 out of 67 |
| Not Spiked | 116 | . | |
| False Positives | 2 | 2% | 2 out of 116 |
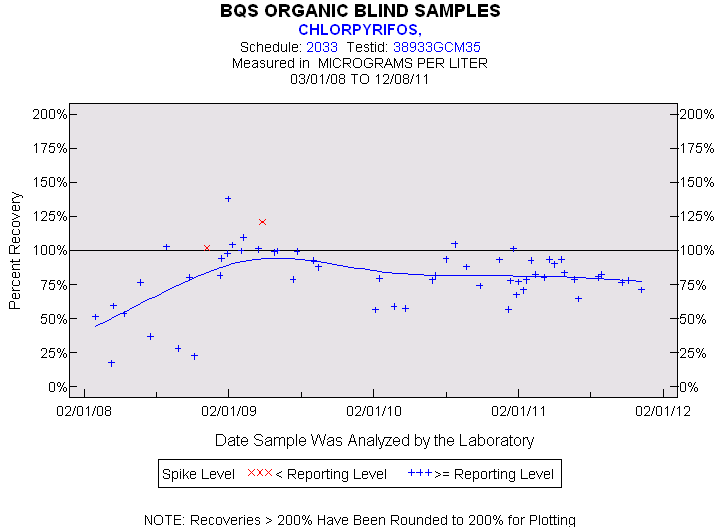
| Statistics for the Plotted Points |
| CHLORPYRIFOS |
| Spike Level | N | Mean | Std-Dev. | Median | F_Pseudo |
|---|---|---|---|---|---|
| < Reporting Level | 2 | 112% | 14% | 112% | 14% |
| >= Reporting Level | 56 | 80% | 22% | 80% | 17% |
| Total | 58 | 81% | 22% | 81% | 17% |
| Miscellaneous Statistics for the Samples |
| CHLORPYRIFOS |
| Characteristic | N | % | % Basis |
|---|---|---|---|
| Plotted | 58 | 97% | Spiked |
| Estimated Values | 3 | 5% | Spiked |
| Deleted Values | 0 | 0% | Spiked + Not Spiked |
| Spiked, Censored | 1 | 2% | Spiked |
| Spiked | 60 | . | |
| False Negatives | 1 | 2% | 1 out of 60 |
| Not Spiked | 123 | . | |
| False Positives | 2 | 2% | 2 out of 123 |
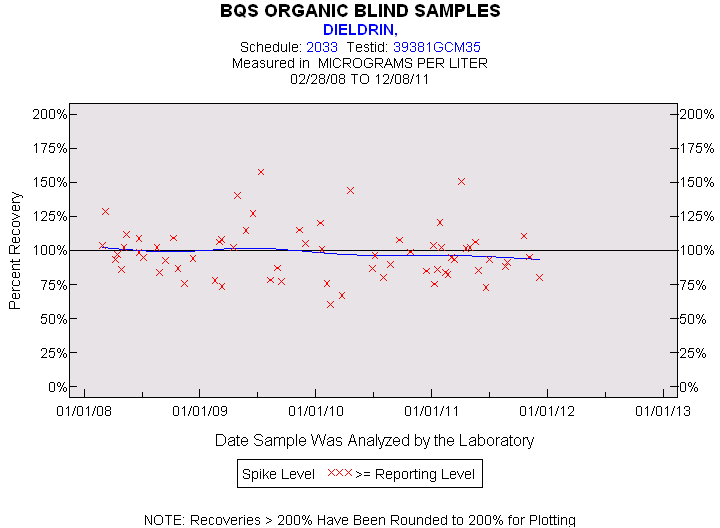
| Statistics for the Plotted Points |
| DIELDRIN |
| Spike Level | N | Mean | Std-Dev. | Median | F_Pseudo |
|---|---|---|---|---|---|
| >= Reporting Level | 65 | 98% | 19% | 95% | 16% |
| Total | 65 | 98% | 19% | 95% | 16% |
| Miscellaneous Statistics for the Samples |
| DIELDRIN |
| Characteristic | N | % | % Basis |
|---|---|---|---|
| Plotted | 65 | 98% | Spiked |
| Estimated Values | 2 | 3% | Spiked |
| Deleted Values | 0 | 0% | Spiked + Not Spiked |
| Spiked, Censored | 0 | 0% | Spiked |
| Spiked | 66 | . | |
| False Negatives | 1 | 2% | 1 out of 66 |
| Not Spiked | 117 | . | |
| False Positives | 1 | 1% | 1 out of 117 |
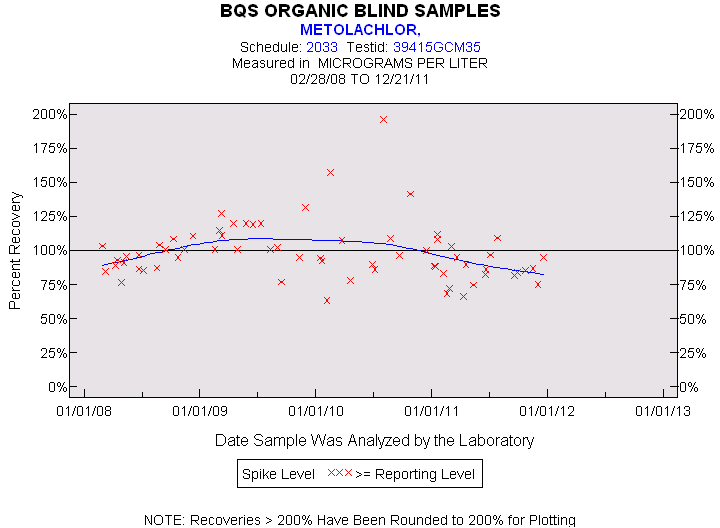
| Statistics for the Plotted Points |
| METOLACHLOR |
| Spike Level | N | Mean | Std-Dev. | Median | F_Pseudo |
|---|---|---|---|---|---|
| >= Reporting Level | 66 | 99% | 21% | 95% | 16% |
| Total | 66 | 99% | 21% | 95% | 16% |
| Miscellaneous Statistics for the Samples |
| METOLACHLOR |
| Characteristic | N | % | % Basis |
|---|---|---|---|
| Plotted | 66 | 99% | Spiked |
| Estimated Values | 2 | 3% | Spiked |
| Deleted Values | 0 | 0% | Spiked + Not Spiked |
| Spiked, Censored | 0 | 0% | Spiked |
| Spiked | 67 | . | |
| False Negatives | 1 | 1% | 1 out of 67 |
| Not Spiked | 116 | . | |
| False Positives | 2 | 2% | 2 out of 116 |
| Statistics for the Plotted Points |
| MALATHION |
| Spike Level | N | Mean | Std-Dev. | Median | F_Pseudo |
|---|---|---|---|---|---|
| >= Reporting Level | 58 | 91% | 22% | 90% | 18% |
| Total | 58 | 91% | 22% | 90% | 18% |
| Miscellaneous Statistics for the Samples |
| MALATHION |
| Characteristic | N | % | % Basis |
|---|---|---|---|
| Plotted | 58 | 97% | Spiked |
| Estimated Values | 2 | 3% | Spiked |
| Deleted Values | 0 | 0% | Spiked + Not Spiked |
| Spiked, Censored | 0 | 0% | Spiked |
| Spiked | 60 | . | |
| False Negatives | 2 | 3% | 2 out of 60 |
| Not Spiked | 123 | . | |
| False Positives | 2 | 2% | 2 out of 123 |
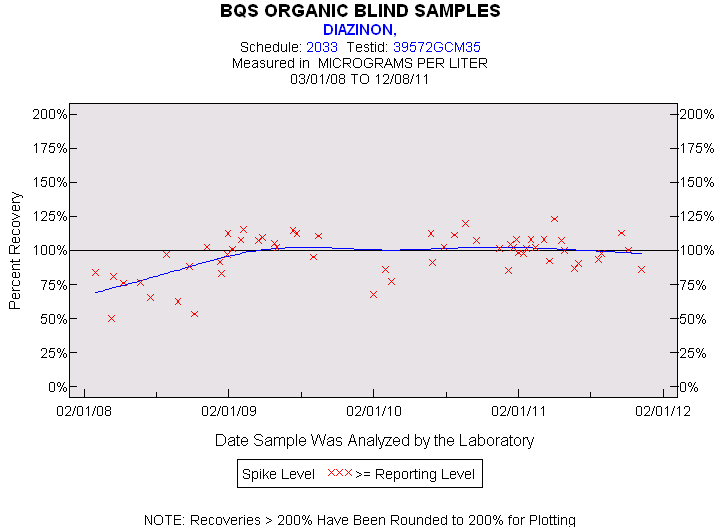
| Statistics for the Plotted Points |
| DIAZINON |
| Spike Level | N | Mean | Std-Dev. | Median | F_Pseudo |
|---|---|---|---|---|---|
| >= Reporting Level | 57 | 96% | 16% | 101% | 15% |
| Total | 57 | 96% | 16% | 101% | 15% |
| Miscellaneous Statistics for the Samples |
| DIAZINON |
| Characteristic | N | % | % Basis |
|---|---|---|---|
| Plotted | 57 | 97% | Spiked |
| Estimated Values | 1 | 2% | Spiked |
| Deleted Values | 0 | 0% | Spiked + Not Spiked |
| Spiked, Censored | 0 | 0% | Spiked |
| Spiked | 59 | . | |
| False Negatives | 2 | 3% | 2 out of 59 |
| Not Spiked | 124 | . | |
| False Positives | 2 | 2% | 2 out of 124 |
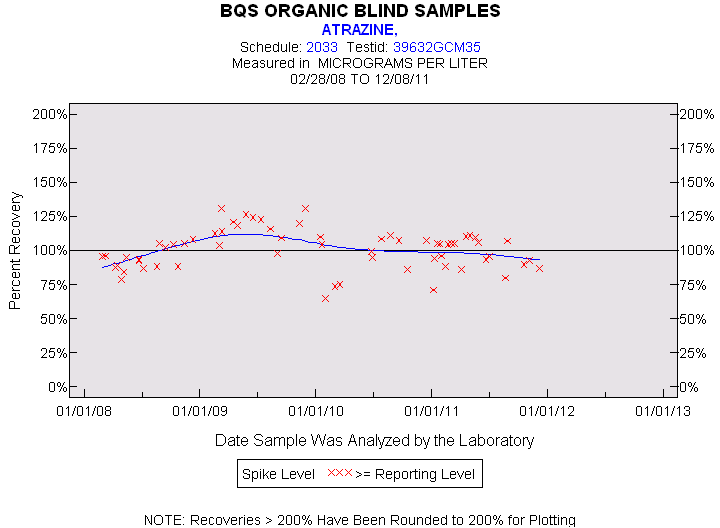
| Statistics for the Plotted Points |
| ATRAZINE |
| Spike Level | N | Mean | Std-Dev. | Median | F_Pseudo |
|---|---|---|---|---|---|
| >= Reporting Level | 64 | 101% | 14% | 104% | 15% |
| Total | 64 | 101% | 14% | 104% | 15% |
| Miscellaneous Statistics for the Samples |
| ATRAZINE |
| Characteristic | N | % | % Basis |
|---|---|---|---|
| Plotted | 64 | 98% | Spiked |
| Estimated Values | 1 | 2% | Spiked |
| Deleted Values | 0 | 0% | Spiked + Not Spiked |
| Spiked, Censored | 0 | 0% | Spiked |
| Spiked | 65 | . | |
| False Negatives | 1 | 2% | 1 out of 65 |
| Not Spiked | 118 | . | |
| False Positives | 3 | 3% | 3 out of 118 |
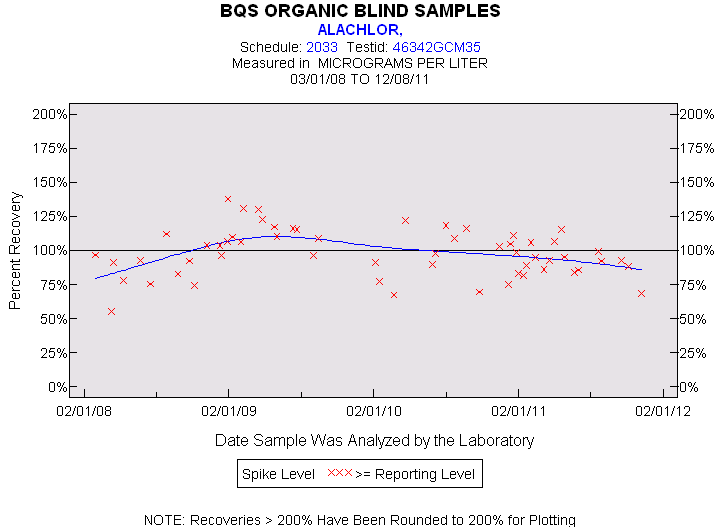
| Statistics for the Plotted Points |
| ALACHLOR |
| Spike Level | N | Mean | Std-Dev. | Median | F_Pseudo |
|---|---|---|---|---|---|
| >= Reporting Level | 58 | 98% | 17% | 97% | 18% |
| Total | 58 | 98% | 17% | 97% | 18% |
| Miscellaneous Statistics for the Samples |
| ALACHLOR |
| Characteristic | N | % | % Basis |
|---|---|---|---|
| Plotted | 58 | 97% | Spiked |
| Estimated Values | 2 | 3% | Spiked |
| Deleted Values | 0 | 0% | Spiked + Not Spiked |
| Spiked, Censored | 0 | 0% | Spiked |
| Spiked | 60 | . | |
| False Negatives | 2 | 3% | 2 out of 60 |
| Not Spiked | 123 | . | |
| False Positives | 2 | 2% | 2 out of 123 |
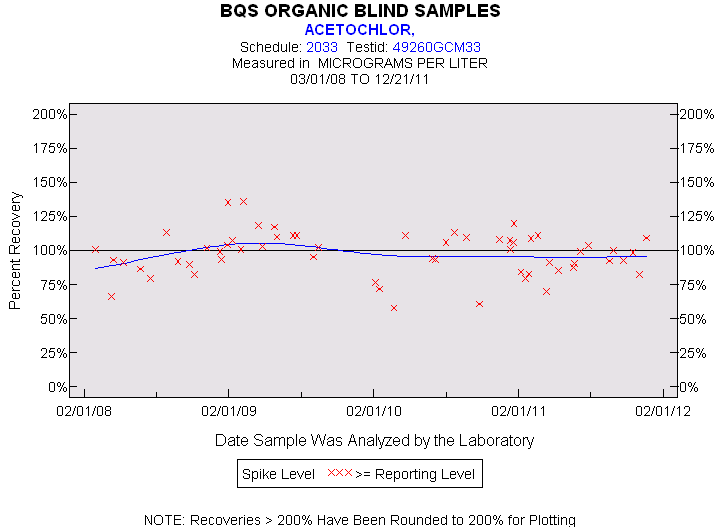
| Statistics for the Plotted Points |
| ACETOCHLOR |
| Spike Level | N | Mean | Std-Dev. | Median | F_Pseudo |
|---|---|---|---|---|---|
| >= Reporting Level | 59 | 98% | 16% | 100% | 16% |
| Total | 59 | 98% | 16% | 100% | 16% |
| Miscellaneous Statistics for the Samples |
| ACETOCHLOR |
| Characteristic | N | % | % Basis |
|---|---|---|---|
| Plotted | 59 | 97% | Spiked |
| Estimated Values | 2 | 3% | Spiked |
| Deleted Values | 0 | 0% | Spiked + Not Spiked |
| Spiked, Censored | 0 | 0% | Spiked |
| Spiked | 61 | . | |
| False Negatives | 2 | 3% | 2 out of 61 |
| Not Spiked | 122 | . | |
| False Positives | 2 | 2% | 2 out of 122 |
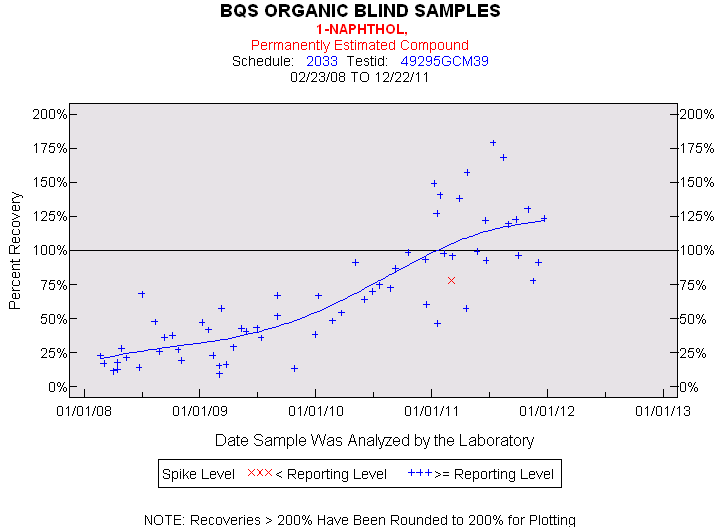
| Statistics for the Plotted Points |
| 1-NAPHTHOL |
| Spike Level | N | Mean | Std-Dev. | Median | F_Pseudo |
|---|---|---|---|---|---|
| < Reporting Level | 1 | 78% | . | 78% | 0% |
| >= Reporting Level | 64 | 67% | 44% | 58% | 50% |
| Total | 65 | 67% | 44% | 58% | 50% |
| Miscellaneous Statistics for the Samples |
| 1-NAPHTHOL |
| Characteristic | N | % | % Basis |
|---|---|---|---|
| Plotted | 65 | 97% | Spiked |
| Estimated Values | 65 | 97% | Spiked |
| Deleted Values | 0 | 0% | Spiked + Not Spiked |
| Spiked, Censored | 0 | 0% | Spiked |
| Spiked | 67 | . | |
| False Negatives | 2 | 3% | 2 out of 67 |
| Not Spiked | 116 | . | |
| False Positives | 2 | 2% | 2 out of 116 |
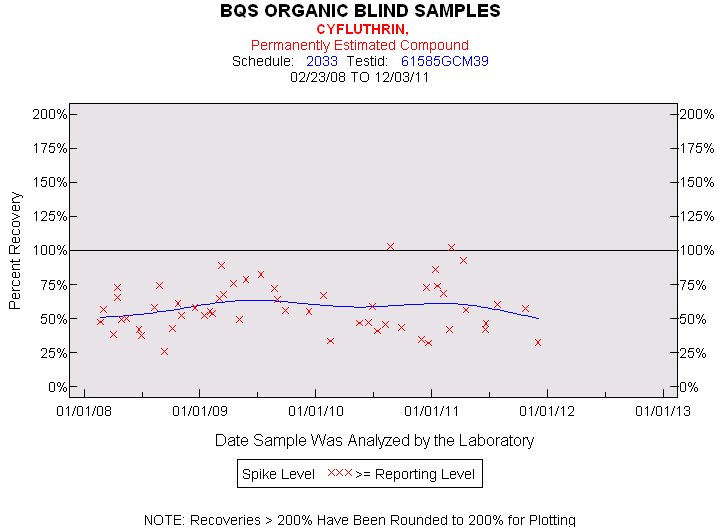
| Statistics for the Plotted Points |
| CYFLUTHRIN |
| Spike Level | N | Mean | Std-Dev. | Median | F_Pseudo |
|---|---|---|---|---|---|
| >= Reporting Level | 54 | 58% | 18% | 56% | 17% |
| Total | 54 | 58% | 18% | 56% | 17% |
| Miscellaneous Statistics for the Samples |
| CYFLUTHRIN |
| Characteristic | N | % | % Basis |
|---|---|---|---|
| Plotted | 54 | 82% | Spiked |
| Estimated Values | 54 | 82% | Spiked |
| Deleted Values | 0 | 0% | Spiked + Not Spiked |
| Spiked, Censored | 0 | 0% | Spiked |
| Spiked | 66 | . | |
| False Negatives | 12 | 18% | 12 out of 66 |
| Not Spiked | 117 | . | |
| False Positives | 2 | 2% | 2 out of 117 |
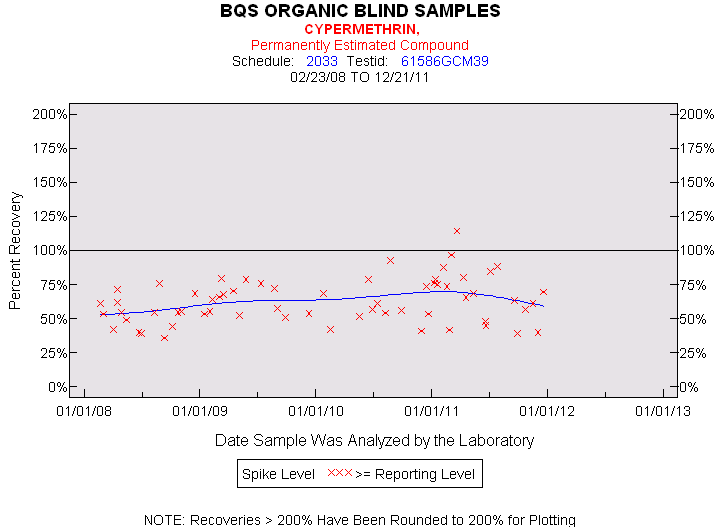
| Statistics for the Plotted Points |
| CYPERMETHRIN |
| Spike Level | N | Mean | Std-Dev. | Median | F_Pseudo |
|---|---|---|---|---|---|
| >= Reporting Level | 64 | 63% | 16% | 61% | 16% |
| Total | 64 | 63% | 16% | 61% | 16% |
| Miscellaneous Statistics for the Samples |
| CYPERMETHRIN |
| Characteristic | N | % | % Basis |
|---|---|---|---|
| Plotted | 64 | 97% | Spiked |
| Estimated Values | 64 | 97% | Spiked |
| Deleted Values | 0 | 0% | Spiked + Not Spiked |
| Spiked, Censored | 0 | 0% | Spiked |
| Spiked | 66 | . | |
| False Negatives | 2 | 3% | 2 out of 66 |
| Not Spiked | 117 | . | |
| False Positives | 2 | 2% | 2 out of 117 |
| Statistics for the Plotted Points |
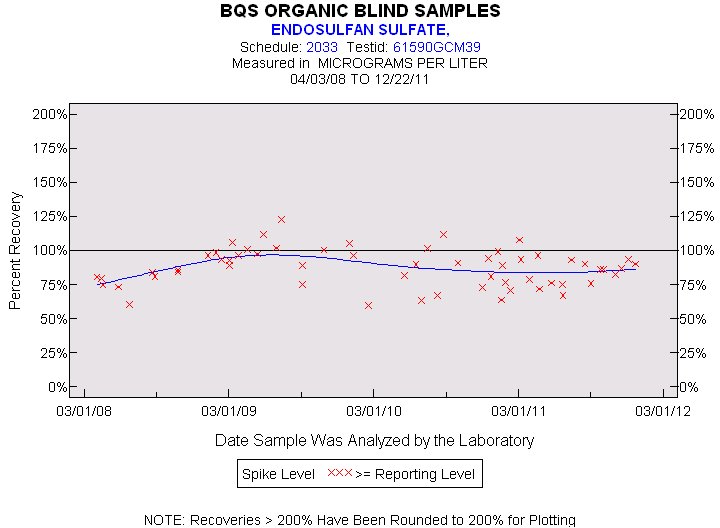
| ENDOSULFAN SULFATE |
| Spike Level | N | Mean | Std-Dev. | Median | F_Pseudo |
|---|---|---|---|---|---|
| >= Reporting Level | 59 | 87% | 14% | 89% | 15% |
| Total | 59 | 87% | 14% | 89% | 15% |
| Miscellaneous Statistics for the Samples |
| ENDOSULFAN SULFATE |
| Characteristic | N | % | % Basis |
|---|---|---|---|
| Plotted | 59 | 97% | Spiked |
| Estimated Values | 2 | 3% | Spiked |
| Deleted Values | 0 | 0% | Spiked + Not Spiked |
| Spiked, Censored | 0 | 0% | Spiked |
| Spiked | 61 | . | |
| False Negatives | 2 | 3% | 2 out of 61 |
| Not Spiked | 122 | . | |
| False Positives | 2 | 2% | 2 out of 122 |
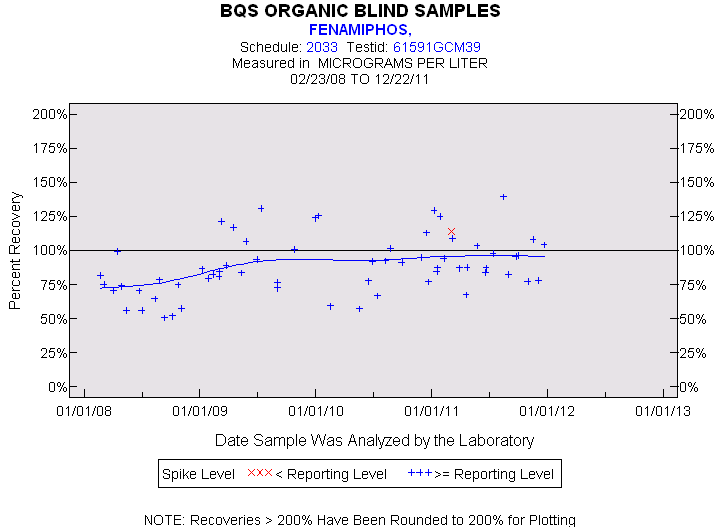
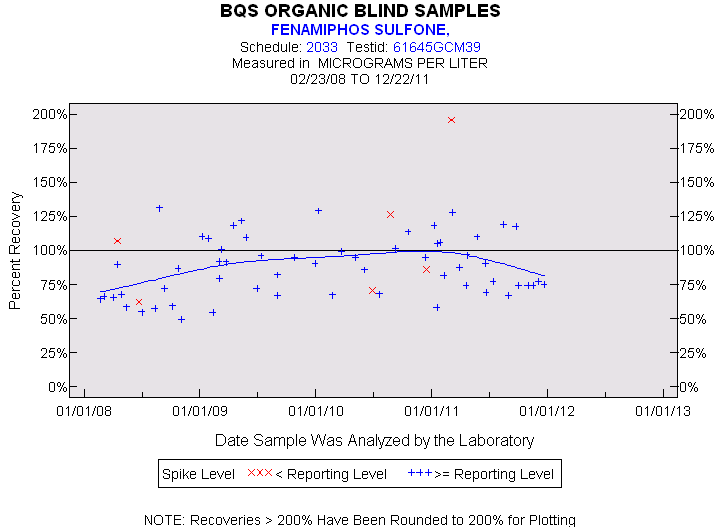
| Statistics for the Plotted Points |
| FENAMIPHOS |
| Spike Level | N | Mean | Std-Dev. | Median | F_Pseudo |
|---|---|---|---|---|---|
| < Reporting Level | 1 | 114% | . | 114% | 0% |
| >= Reporting Level | 64 | 89% | 21% | 87% | 18% |
| Total | 65 | 89% | 21% | 87% | 18% |
| Miscellaneous Statistics for the Samples |
| FENAMIPHOS |
| Characteristic | N | % | % Basis |
|---|---|---|---|
| Plotted | 65 | 97% | Spiked |
| Estimated Values | 2 | 3% | Spiked |
| Deleted Values | 0 | 0% | Spiked + Not Spiked |
| Spiked, Censored | 0 | 0% | Spiked |
| Spiked | 67 | . | |
| False Negatives | 2 | 3% | 2 out of 67 |
| Not Spiked | 116 | . | |
| False Positives | 3 | 3% | 3 out of 116 |
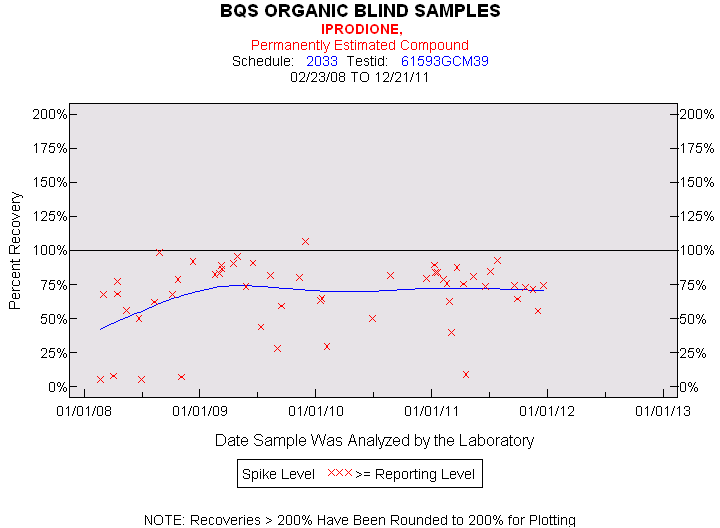
| Statistics for the Plotted Points |
| IPRODIONE |
| Spike Level | N | Mean | Std-Dev. | Median | F_Pseudo |
|---|---|---|---|---|---|
| >= Reporting Level | 55 | 68% | 25% | 75% | 18% |
| Total | 55 | 68% | 25% | 75% | 18% |
| Miscellaneous Statistics for the Samples |
| IPRODIONE |
| Characteristic | N | % | % Basis |
|---|---|---|---|
| Plotted | 55 | 83% | Spiked |
| Estimated Values | 55 | 83% | Spiked |
| Deleted Values | 0 | 0% | Spiked + Not Spiked |
| Spiked, Censored | 0 | 0% | Spiked |
| Spiked | 66 | . | |
| False Negatives | 11 | 17% | 11 out of 66 |
| Not Spiked | 117 | . | |
| False Positives | 1 | 1% | 1 out of 117 |
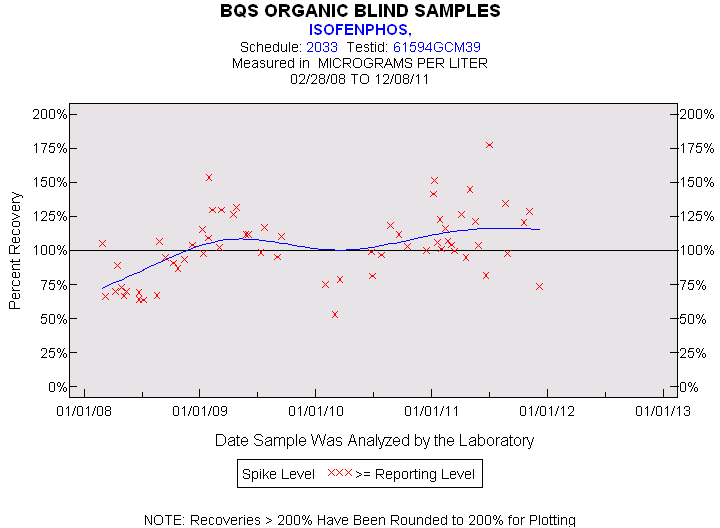
| Statistics for the Plotted Points |
| ISOFENPHOS |
| Spike Level | N | Mean | Std-Dev. | Median | F_Pseudo |
|---|---|---|---|---|---|
| >= Reporting Level | 63 | 103% | 25% | 103% | 23% |
| Total | 63 | 103% | 25% | 103% | 23% |
| Miscellaneous Statistics for the Samples |
| ISOFENPHOS |
| Characteristic | N | % | % Basis |
|---|---|---|---|
| Plotted | 63 | 97% | Spiked |
| Estimated Values | 2 | 3% | Spiked |
| Deleted Values | 0 | 0% | Spiked + Not Spiked |
| Spiked, Censored | 0 | 0% | Spiked |
| Spiked | 65 | . | |
| False Negatives | 2 | 3% | 2 out of 65 |
| Not Spiked | 118 | . | |
| False Positives | 2 | 2% | 2 out of 118 |
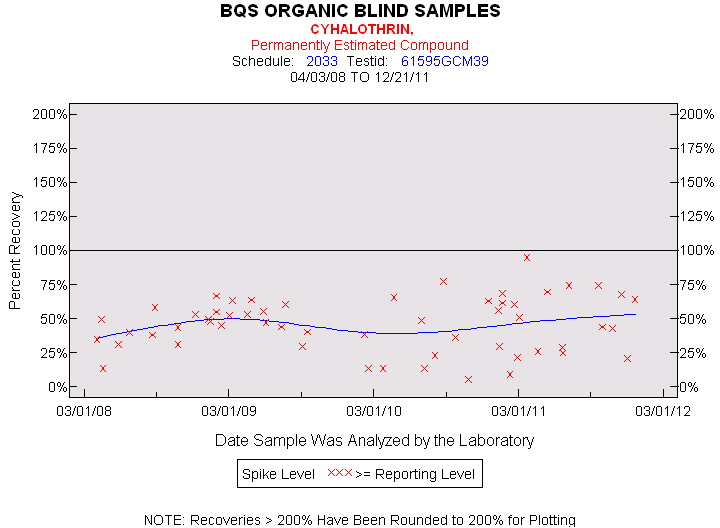
| Statistics for the Plotted Points |
| CYHALOTHRIN |
| Spike Level | N | Mean | Std-Dev. | Median | F_Pseudo |
|---|---|---|---|---|---|
| >= Reporting Level | 56 | 46% | 20% | 48% | 23% |
| Total | 56 | 46% | 20% | 48% | 23% |
| Miscellaneous Statistics for the Samples |
| CYHALOTHRIN |
| Characteristic | N | % | % Basis |
|---|---|---|---|
| Plotted | 56 | 93% | Spiked |
| Estimated Values | 56 | 93% | Spiked |
| Deleted Values | 0 | 0% | Spiked + Not Spiked |
| Spiked, Censored | 0 | 0% | Spiked |
| Spiked | 60 | . | |
| False Negatives | 4 | 7% | 4 out of 60 |
| Not Spiked | 123 | . | |
| False Positives | 2 | 2% | 2 out of 123 |
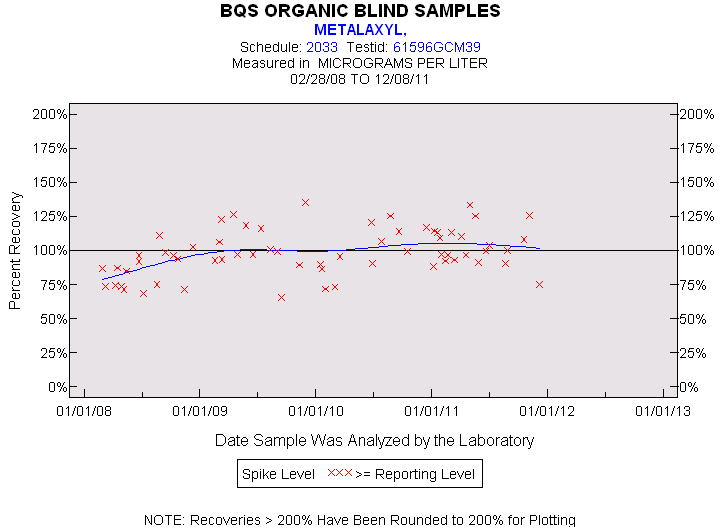
| Statistics for the Plotted Points |
| METALAXYL |
| Spike Level | N | Mean | Std-Dev. | Median | F_Pseudo |
|---|---|---|---|---|---|
| >= Reporting Level | 64 | 98% | 17% | 97% | 16% |
| Total | 64 | 98% | 17% | 97% | 16% |
| Miscellaneous Statistics for the Samples |
| METALAXYL |
| Characteristic | N | % | % Basis |
|---|---|---|---|
| Plotted | 64 | 98% | Spiked |
| Estimated Values | 1 | 2% | Spiked |
| Deleted Values | 0 | 0% | Spiked + Not Spiked |
| Spiked, Censored | 0 | 0% | Spiked |
| Spiked | 65 | . | |
| False Negatives | 1 | 2% | 1 out of 65 |
| Not Spiked | 118 | . | |
| False Positives | 1 | 1% | 1 out of 118 |
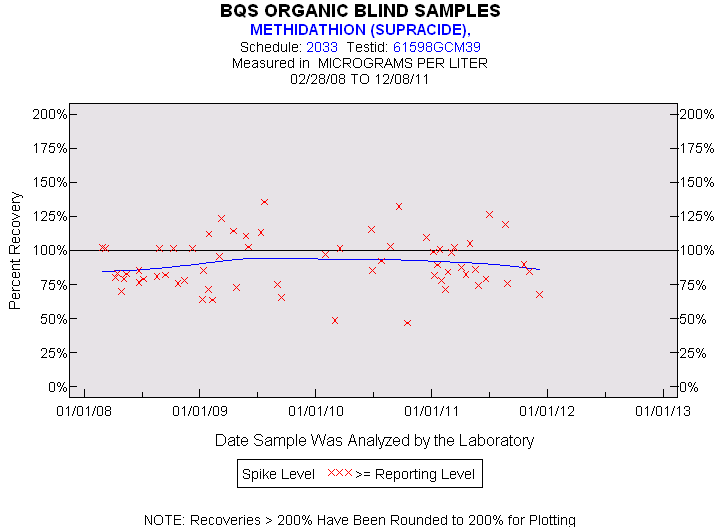
| Statistics for the Plotted Points |
| METHIDATHION (SUPRACIDE) |
| Spike Level | N | Mean | Std-Dev. | Median | F_Pseudo |
|---|---|---|---|---|---|
| >= Reporting Level | 63 | 90% | 19% | 85% | 18% |
| Total | 63 | 90% | 19% | 85% | 18% |
| Miscellaneous Statistics for the Samples |
| METHIDATHION (SUPRACIDE) |
| Characteristic | N | % | % Basis |
|---|---|---|---|
| Plotted | 63 | 97% | Spiked |
| Estimated Values | 3 | 5% | Spiked |
| Deleted Values | 0 | 0% | Spiked + Not Spiked |
| Spiked, Censored | 0 | 0% | Spiked |
| Spiked | 65 | . | |
| False Negatives | 2 | 3% | 2 out of 65 |
| Not Spiked | 118 | . | |
| False Positives | 2 | 2% | 2 out of 118 |
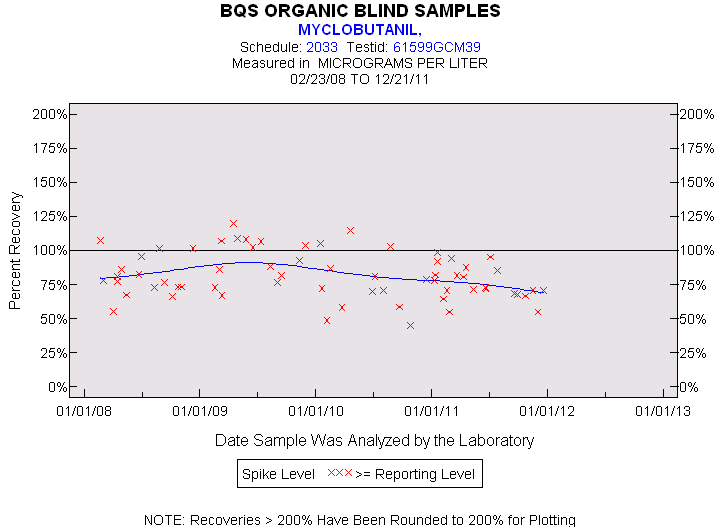
| Statistics for the Plotted Points |
| MYCLOBUTANIL |
| Spike Level | N | Mean | Std-Dev. | Median | F_Pseudo |
|---|---|---|---|---|---|
| >= Reporting Level | 65 | 82% | 17% | 79% | 17% |
| Total | 65 | 82% | 17% | 79% | 17% |
| Miscellaneous Statistics for the Samples |
| MYCLOBUTANIL |
| Characteristic | N | % | % Basis |
|---|---|---|---|
| Plotted | 65 | 98% | Spiked |
| Estimated Values | 0 | 0% | Spiked |
| Deleted Values | 0 | 0% | Spiked + Not Spiked |
| Spiked, Censored | 0 | 0% | Spiked |
| Spiked | 66 | . | |
| False Negatives | 1 | 2% | 1 out of 66 |
| Not Spiked | 117 | . | |
| False Positives | 1 | 1% | 1 out of 117 |
| Statistics for the Plotted Points |
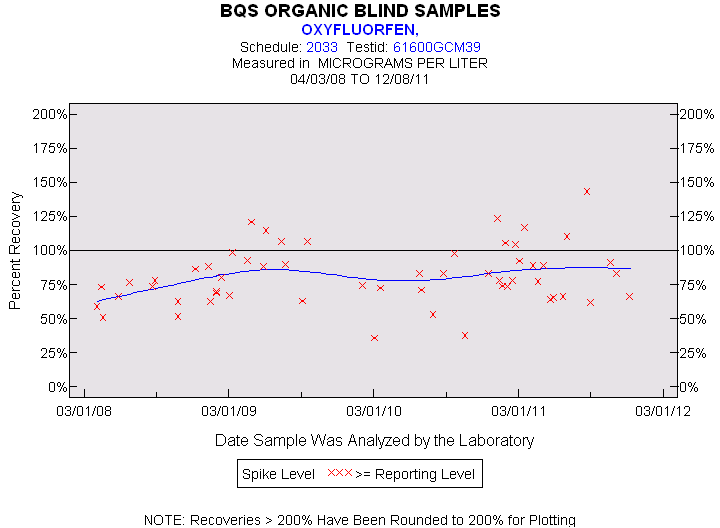
| OXYFLUORFEN |
| Spike Level | N | Mean | Std-Dev. | Median | F_Pseudo |
|---|---|---|---|---|---|
| >= Reporting Level | 56 | 81% | 21% | 78% | 19% |
| Total | 56 | 81% | 21% | 78% | 19% |
| Miscellaneous Statistics for the Samples |
| OXYFLUORFEN |
| Characteristic | N | % | % Basis |
|---|---|---|---|
| Plotted | 56 | 97% | Spiked |
| Estimated Values | 1 | 2% | Spiked |
| Deleted Values | 0 | 0% | Spiked + Not Spiked |
| Spiked, Censored | 0 | 0% | Spiked |
| Spiked | 58 | . | |
| False Negatives | 2 | 3% | 2 out of 58 |
| Not Spiked | 125 | . | |
| False Positives | 2 | 2% | 2 out of 125 |
| Statistics for the Plotted Points |
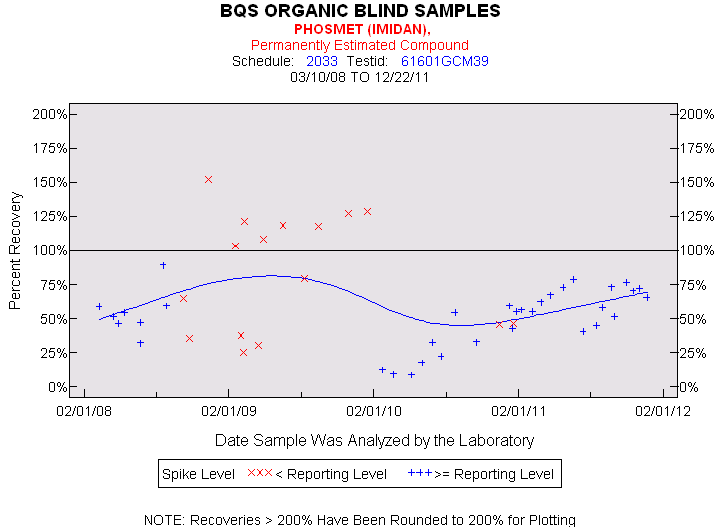
| PHOSMET (IMIDAN) |
| Spike Level | N | Mean | Std-Dev. | Median | F_Pseudo |
|---|---|---|---|---|---|
| < Reporting Level | 16 | 84% | 43% | 92% | 58% |
| >= Reporting Level | 34 | 51% | 20% | 55% | 18% |
| Total | 50 | 62% | 33% | 56% | 24% |
| Miscellaneous Statistics for the Samples |
| PHOSMET (IMIDAN) |
| Characteristic | N | % | % Basis |
|---|---|---|---|
| Plotted | 50 | 74% | Spiked |
| Estimated Values | 50 | 74% | Spiked |
| Deleted Values | 0 | 0% | Spiked + Not Spiked |
| Spiked, Censored | 9 | 13% | Spiked |
| Spiked | 68 | . | |
| False Negatives | 9 | 13% | 9 out of 68 |
| Not Spiked | 115 | . | |
| False Positives | 2 | 2% | 2 out of 115 |
| Statistics for the Plotted Points |
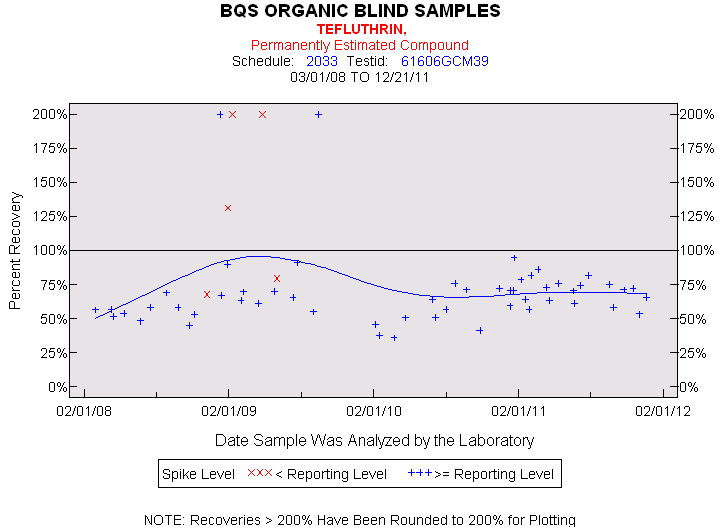
| TEFLUTHRIN |
| Spike Level | N | Mean | Std-Dev. | Median | F_Pseudo |
|---|---|---|---|---|---|
| < Reporting Level | 5 | 136% | 63% | 131% | 89% |
| >= Reporting Level | 54 | 69% | 29% | 65% | 12% |
| Total | 59 | 75% | 37% | 67% | 14% |
| Miscellaneous Statistics for the Samples |
| TEFLUTHRIN |
| Characteristic | N | % | % Basis |
|---|---|---|---|
| Plotted | 59 | 97% | Spiked |
| Estimated Values | 59 | 97% | Spiked |
| Deleted Values | 0 | 0% | Spiked + Not Spiked |
| Spiked, Censored | 1 | 2% | Spiked |
| Spiked | 61 | . | |
| False Negatives | 1 | 2% | 1 out of 61 |
| Not Spiked | 122 | . | |
| False Positives | 3 | 2% | 3 out of 122 |
| Statistics for the Plotted Points |
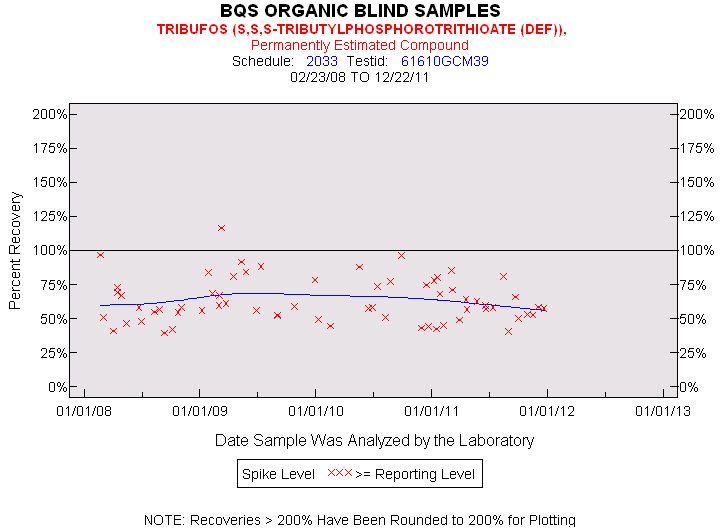
| TRIBUFOS (S,S,S-TRIBUTYLPHOSPHOROTRITHIOATE (DEF)) |
| Spike Level | N | Mean | Std-Dev. | Median | F_Pseudo |
|---|---|---|---|---|---|
| >= Reporting Level | 65 | 63% | 16% | 58% | 16% |
| Total | 65 | 63% | 16% | 58% | 16% |
| Miscellaneous Statistics for the Samples |
| TRIBUFOS (S,S,S-TRIBUTYLPHOSPHOROTRITHIOATE (DEF)) |
| Characteristic | N | % | % Basis |
|---|---|---|---|
| Plotted | 65 | 97% | Spiked |
| Estimated Values | 65 | 97% | Spiked |
| Deleted Values | 0 | 0% | Spiked + Not Spiked |
| Spiked, Censored | 0 | 0% | Spiked |
| Spiked | 67 | . | |
| False Negatives | 2 | 3% | 2 out of 67 |
| Not Spiked | 116 | . | |
| False Positives | 10 | 9% | 10 out of 116 |
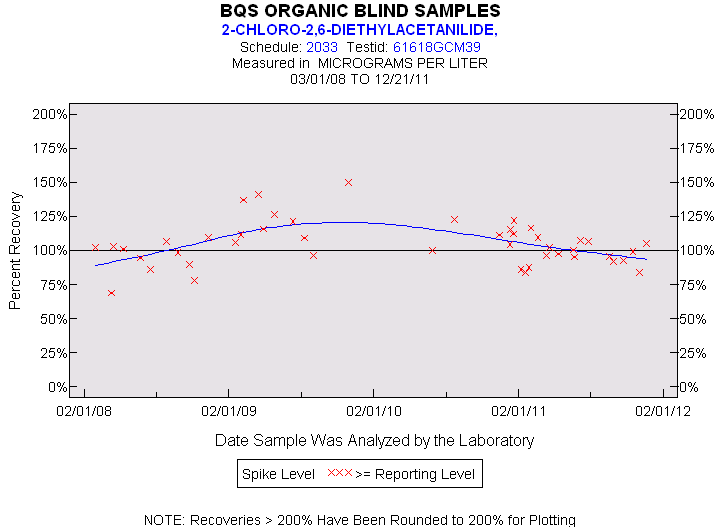
| Statistics for the Plotted Points |
| 2-CHLORO-2,6-DIETHYLACETANILIDE |
| Spike Level | N | Mean | Std-Dev. | Median | F_Pseudo |
|---|---|---|---|---|---|
| >= Reporting Level | 46 | 104% | 16% | 103% | 12% |
| Total | 46 | 104% | 16% | 103% | 12% |
| Miscellaneous Statistics for the Samples |
| 2-CHLORO-2,6-DIETHYLACETANILIDE |
| Characteristic | N | % | % Basis |
|---|---|---|---|
| Plotted | 46 | 98% | Spiked |
| Estimated Values | 0 | 0% | Spiked |
| Deleted Values | 0 | 0% | Spiked + Not Spiked |
| Spiked, Censored | 0 | 0% | Spiked |
| Spiked | 47 | . | |
| False Negatives | 1 | 2% | 1 out of 47 |
| Not Spiked | 136 | . | |
| False Positives | 1 | 1% | 1 out of 136 |
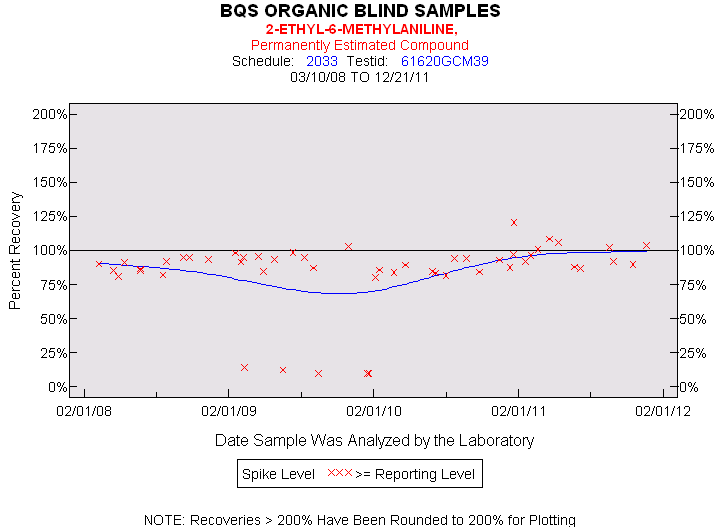
| Statistics for the Plotted Points |
| 2-ETHYL-6-METHYLANILINE |
| Spike Level | N | Mean | Std-Dev. | Median | F_Pseudo |
|---|---|---|---|---|---|
| >= Reporting Level | 51 | 84% | 26% | 91% | 8% |
| Total | 51 | 84% | 26% | 91% | 8% |
| Miscellaneous Statistics for the Samples |
| 2-ETHYL-6-METHYLANILINE |
| Characteristic | N | % | % Basis |
|---|---|---|---|
| Plotted | 51 | 98% | Spiked |
| Estimated Values | 51 | 98% | Spiked |
| Deleted Values | 0 | 0% | Spiked + Not Spiked |
| Spiked, Censored | 0 | 0% | Spiked |
| Spiked | 52 | . | |
| False Negatives | 1 | 2% | 1 out of 52 |
| Not Spiked | 131 | . | |
| False Positives | 0 | 0% | 0 out of 131 |
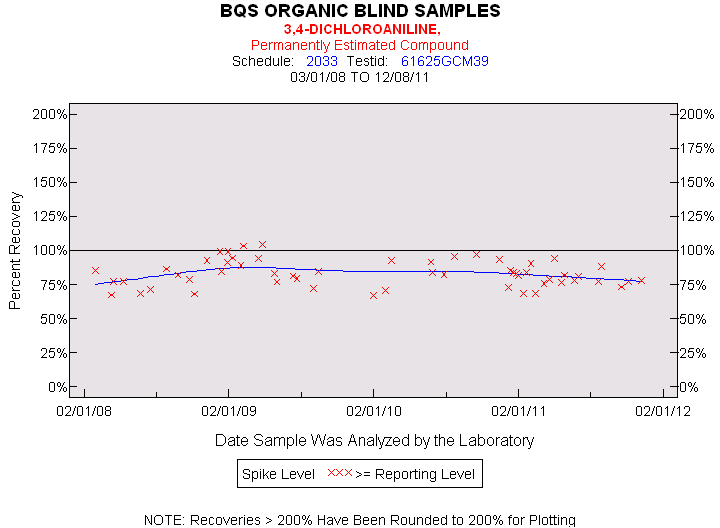
| Statistics for the Plotted Points |
| 3,4-DICHLOROANILINE |
| Spike Level | N | Mean | Std-Dev. | Median | F_Pseudo |
|---|---|---|---|---|---|
| >= Reporting Level | 56 | 83% | 10% | 82% | 10% |
| Total | 56 | 83% | 10% | 82% | 10% |
| Miscellaneous Statistics for the Samples |
| 3,4-DICHLOROANILINE |
| Characteristic | N | % | % Basis |
|---|---|---|---|
| Plotted | 56 | 95% | Spiked |
| Estimated Values | 56 | 95% | Spiked |
| Deleted Values | 0 | 0% | Spiked + Not Spiked |
| Spiked, Censored | 1 | 2% | Spiked |
| Spiked | 59 | . | |
| False Negatives | 2 | 3% | 2 out of 59 |
| Not Spiked | 124 | . | |
| False Positives | 2 | 2% | 2 out of 124 |
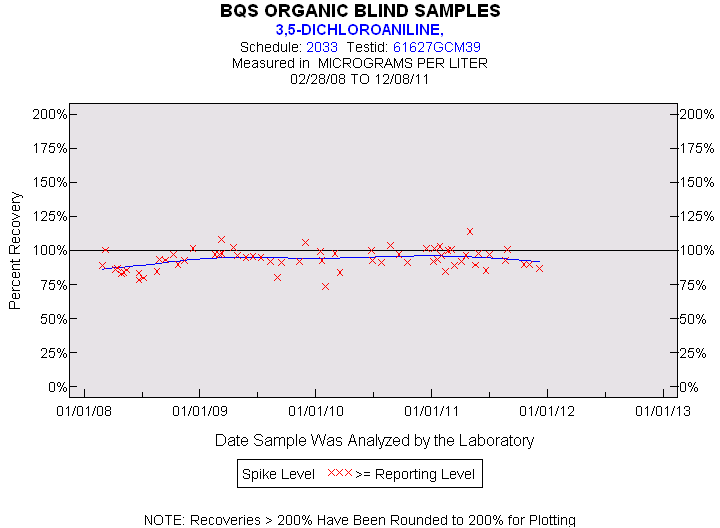
| Statistics for the Plotted Points |
| 3,5-DICHLOROANILINE |
| Spike Level | N | Mean | Std-Dev. | Median | F_Pseudo |
|---|---|---|---|---|---|
| >= Reporting Level | 64 | 93% | 8% | 93% | 7% |
| Total | 64 | 93% | 8% | 93% | 7% |
| Miscellaneous Statistics for the Samples |
| 3,5-DICHLOROANILINE |
| Characteristic | N | % | % Basis |
|---|---|---|---|
| Plotted | 64 | 98% | Spiked |
| Estimated Values | 2 | 3% | Spiked |
| Deleted Values | 0 | 0% | Spiked + Not Spiked |
| Spiked, Censored | 0 | 0% | Spiked |
| Spiked | 65 | . | |
| False Negatives | 1 | 2% | 1 out of 65 |
| Not Spiked | 118 | . | |
| False Positives | 3 | 3% | 3 out of 118 |
| Statistics for the Plotted Points |
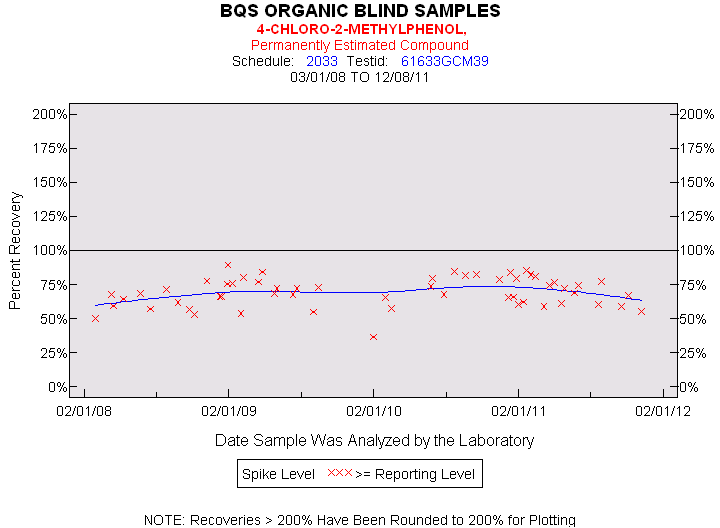
| 4-CHLORO-2-METHYLPHENOL |
| Spike Level | N | Mean | Std-Dev. | Median | F_Pseudo |
|---|---|---|---|---|---|
| >= Reporting Level | 57 | 69% | 11% | 69% | 12% |
| Total | 57 | 69% | 11% | 69% | 12% |
| Miscellaneous Statistics for the Samples |
| 4-CHLORO-2-METHYLPHENOL |
| Characteristic | N | % | % Basis |
|---|---|---|---|
| Plotted | 57 | 97% | Spiked |
| Estimated Values | 57 | 97% | Spiked |
| Deleted Values | 0 | 0% | Spiked + Not Spiked |
| Spiked, Censored | 0 | 0% | Spiked |
| Spiked | 59 | . | |
| False Negatives | 2 | 3% | 2 out of 59 |
| Not Spiked | 124 | . | |
| False Positives | 2 | 2% | 2 out of 124 |
| Statistics for the Plotted Points |
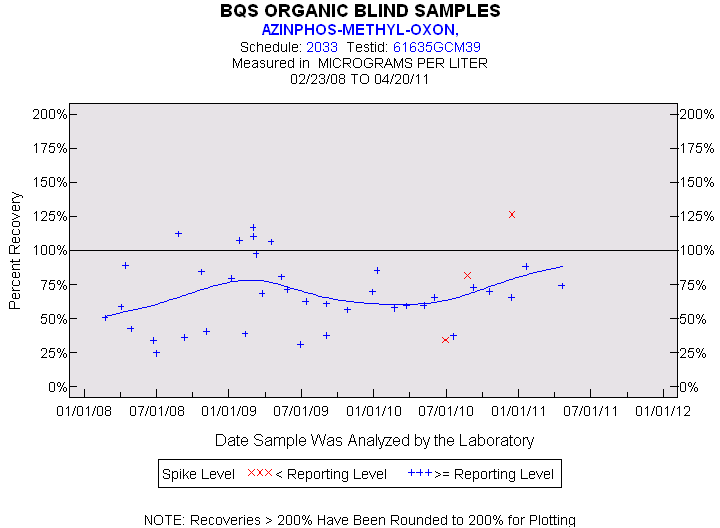
| AZINPHOS-METHYL-OXON |
| Spike Level | N | Mean | Std-Dev. | Median | F_Pseudo |
|---|---|---|---|---|---|
| < Reporting Level | 3 | 81% | 46% | 82% | 68% |
| >= Reporting Level | 37 | 68% | 25% | 66% | 25% |
| Total | 40 | 69% | 26% | 67% | 28% |
| Miscellaneous Statistics for the Samples |
| AZINPHOS-METHYL-OXON |
| Characteristic | N | % | % Basis |
|---|---|---|---|
| Plotted | 40 | 95% | Spiked |
| Estimated Values | 40 | 95% | Spiked |
| Deleted Values | 0 | 0% | Spiked + Not Spiked |
| Spiked, Censored | 1 | 2% | Spiked |
| Spiked | 42 | . | |
| False Negatives | 1 | 2% | 1 out of 42 |
| Not Spiked | 141 | . | |
| False Positives | 1 | 1% | 1 out of 141 |
| Statistics for the Plotted Points |
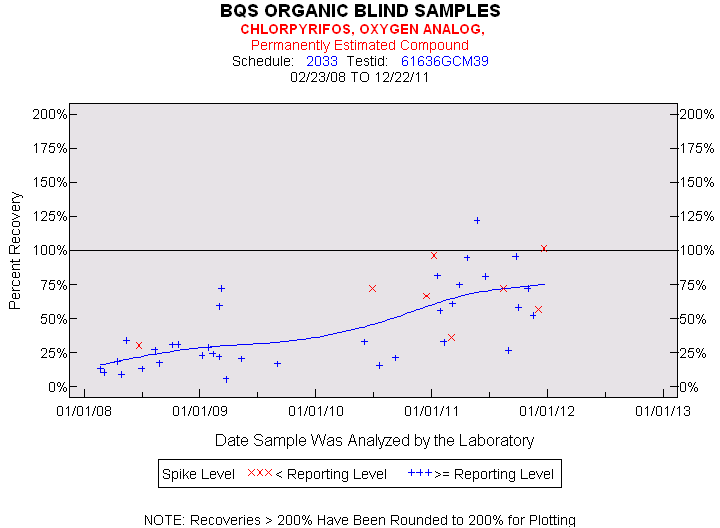
| CHLORPYRIFOS, OXYGEN ANALOG |
| Spike Level | N | Mean | Std-Dev. | Median | F_Pseudo |
|---|---|---|---|---|---|
| < Reporting Level | 8 | 67% | 25% | 69% | 28% |
| >= Reporting Level | 35 | 42% | 30% | 31% | 31% |
| Total | 43 | 46% | 30% | 33% | 38% |
| Miscellaneous Statistics for the Samples |
| CHLORPYRIFOS, OXYGEN ANALOG |
| Characteristic | N | % | % Basis |
|---|---|---|---|
| Plotted | 43 | 64% | Spiked |
| Estimated Values | 43 | 64% | Spiked |
| Deleted Values | 3 | 2% | Spiked + Not Spiked |
| Spiked, Censored | 3 | 4% | Spiked |
| Spiked | 67 | . | |
| False Negatives | 21 | 31% | 21 out of 67 |
| Not Spiked | 116 | . | |
| False Positives | 3 | 3% | 3 out of 113 |
| Statistics for the Plotted Points |
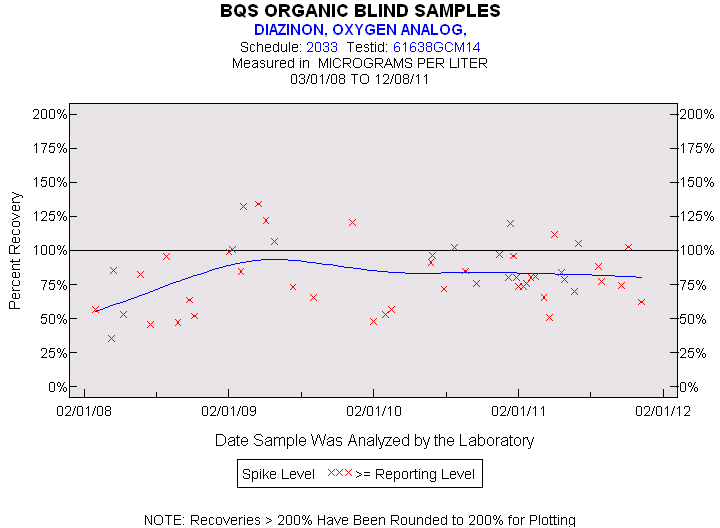
| DIAZINON, OXYGEN ANALOG |
| Spike Level | N | Mean | Std-Dev. | Median | F_Pseudo |
|---|---|---|---|---|---|
| >= Reporting Level | 51 | 82% | 23% | 80% | 23% |
| Total | 51 | 82% | 23% | 80% | 23% |
| Miscellaneous Statistics for the Samples |
| DIAZINON, OXYGEN ANALOG |
| Characteristic | N | % | % Basis |
|---|---|---|---|
| Plotted | 51 | 86% | Spiked |
| Estimated Values | 4 | 7% | Spiked |
| Deleted Values | 0 | 0% | Spiked + Not Spiked |
| Spiked, Censored | 1 | 2% | Spiked |
| Spiked | 59 | . | |
| False Negatives | 7 | 12% | 7 out of 59 |
| Not Spiked | 124 | . | |
| False Positives | 3 | 2% | 3 out of 124 |
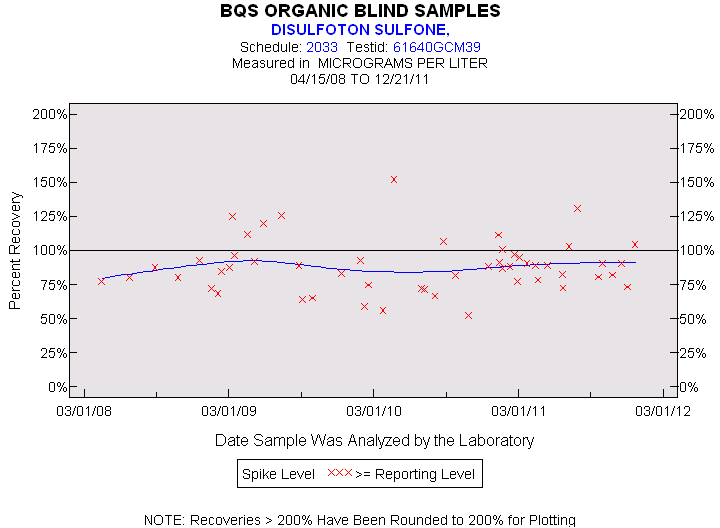
| Statistics for the Plotted Points |
| DISULFOTON SULFONE |
| Spike Level | N | Mean | Std-Dev. | Median | F_Pseudo |
|---|---|---|---|---|---|
| >= Reporting Level | 53 | 88% | 19% | 88% | 13% |
| Total | 53 | 88% | 19% | 88% | 13% |
| Miscellaneous Statistics for the Samples |
| DISULFOTON SULFONE |
| Characteristic | N | % | % Basis |
|---|---|---|---|
| Plotted | 53 | 96% | Spiked |
| Estimated Values | 1 | 2% | Spiked |
| Deleted Values | 0 | 0% | Spiked + Not Spiked |
| Spiked, Censored | 0 | 0% | Spiked |
| Spiked | 55 | . | |
| False Negatives | 2 | 4% | 2 out of 55 |
| Not Spiked | 128 | . | |
| False Positives | 2 | 2% | 2 out of 128 |
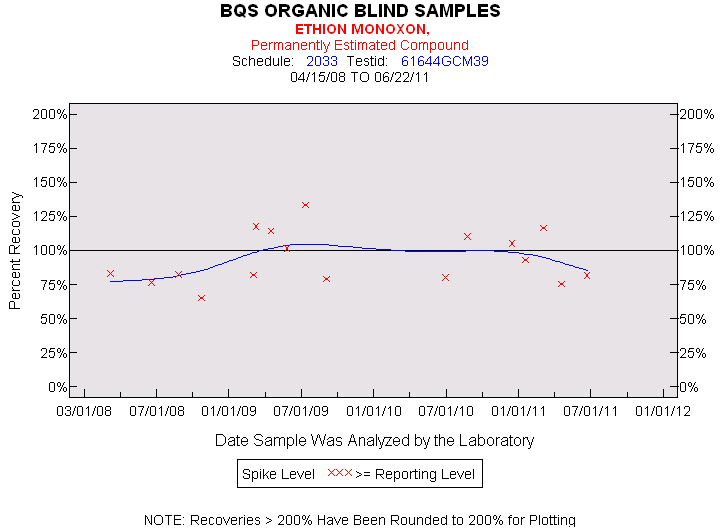
| Statistics for the Plotted Points |
| ETHION MONOXON |
| Spike Level | N | Mean | Std-Dev. | Median | F_Pseudo |
|---|---|---|---|---|---|
| >= Reporting Level | 17 | 94% | 19% | 83% | 22% |
| Total | 17 | 94% | 19% | 83% | 22% |
| Miscellaneous Statistics for the Samples |
| ETHION MONOXON |
| Characteristic | N | % | % Basis |
|---|---|---|---|
| Plotted | 17 | 100% | Spiked |
| Estimated Values | 17 | 100% | Spiked |
| Deleted Values | 0 | 0% | Spiked + Not Spiked |
| Spiked, Censored | 0 | 0% | Spiked |
| Spiked | 17 | . | |
| False Negatives | 0 | 0% | 0 out of 17 |
| Not Spiked | 166 | . | |
| False Positives | 6 | 4% | 6 out of 166 |
| Statistics for the Plotted Points |
| FENAMIPHOS SULFONE |
| Spike Level | N | Mean | Std-Dev. | Median | F_Pseudo |
|---|---|---|---|---|---|
| < Reporting Level | 6 | 108% | 49% | 97% | 41% |
| >= Reporting Level | 59 | 87% | 22% | 87% | 28% |
| Total | 65 | 89% | 25% | 87% | 27% |
| Miscellaneous Statistics for the Samples |
| FENAMIPHOS SULFONE |
| Characteristic | N | % | % Basis |
|---|---|---|---|
| Plotted | 65 | 97% | Spiked |
| Estimated Values | 18 | 27% | Spiked |
| Deleted Values | 0 | 0% | Spiked + Not Spiked |
| Spiked, Censored | 0 | 0% | Spiked |
| Spiked | 67 | . | |
| False Negatives | 2 | 3% | 2 out of 67 |
| Not Spiked | 116 | . | |
| False Positives | 2 | 2% | 2 out of 116 |
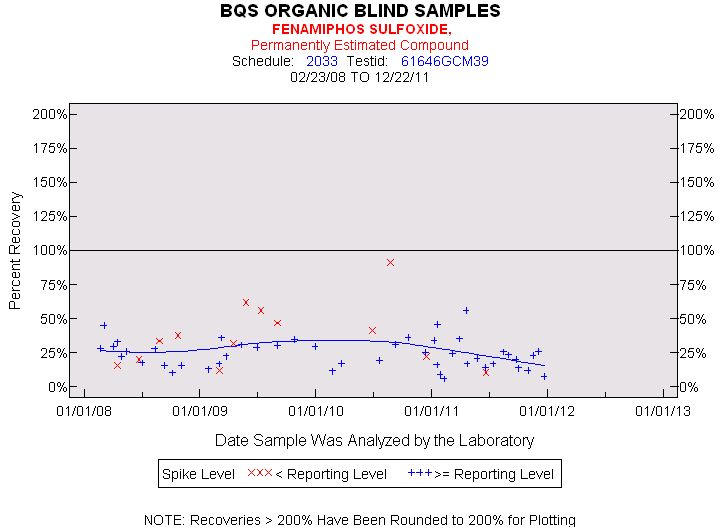
| Statistics for the Plotted Points |
| FENAMIPHOS SULFOXIDE |
| Spike Level | N | Mean | Std-Dev. | Median | F_Pseudo |
|---|---|---|---|---|---|
| < Reporting Level | 13 | 37% | 23% | 34% | 20% |
| >= Reporting Level | 46 | 24% | 11% | 23% | 11% |
| Total | 59 | 27% | 15% | 25% | 13% |
| Miscellaneous Statistics for the Samples |
| FENAMIPHOS SULFOXIDE |
| Characteristic | N | % | % Basis |
|---|---|---|---|
| Plotted | 59 | 89% | Spiked |
| Estimated Values | 59 | 89% | Spiked |
| Deleted Values | 2 | 1% | Spiked + Not Spiked |
| Spiked, Censored | 1 | 2% | Spiked |
| Spiked | 67 | . | |
| False Negatives | 6 | 9% | 6 out of 66 |
| Not Spiked | 116 | . | |
| False Positives | 5 | 4% | 5 out of 115 |
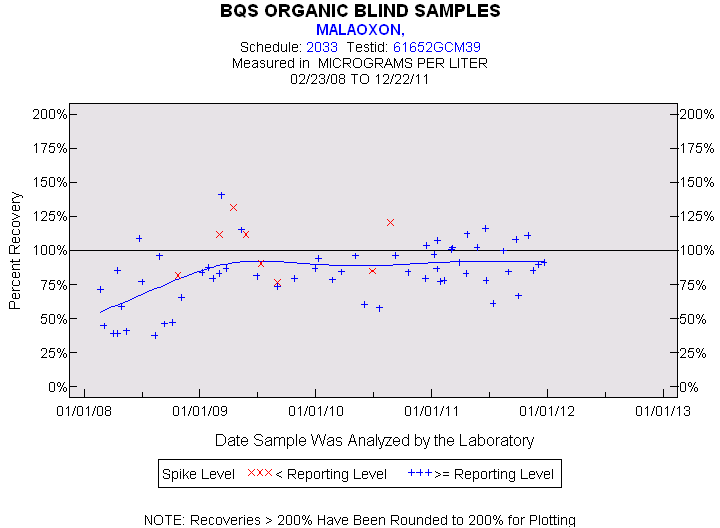
| Statistics for the Plotted Points |
| MALAOXON |
| Spike Level | N | Mean | Std-Dev. | Median | F_Pseudo |
|---|---|---|---|---|---|
| < Reporting Level | 8 | 101% | 20% | 101% | 25% |
| >= Reporting Level | 57 | 83% | 22% | 84% | 17% |
| Total | 65 | 85% | 22% | 85% | 17% |
| Miscellaneous Statistics for the Samples |
| MALAOXON |
| Characteristic | N | % | % Basis |
|---|---|---|---|
| Plotted | 65 | 97% | Spiked |
| Estimated Values | 14 | 21% | Spiked |
| Deleted Values | 0 | 0% | Spiked + Not Spiked |
| Spiked, Censored | 0 | 0% | Spiked |
| Spiked | 67 | . | |
| False Negatives | 2 | 3% | 2 out of 67 |
| Not Spiked | 116 | . | |
| False Positives | 3 | 3% | 3 out of 116 |
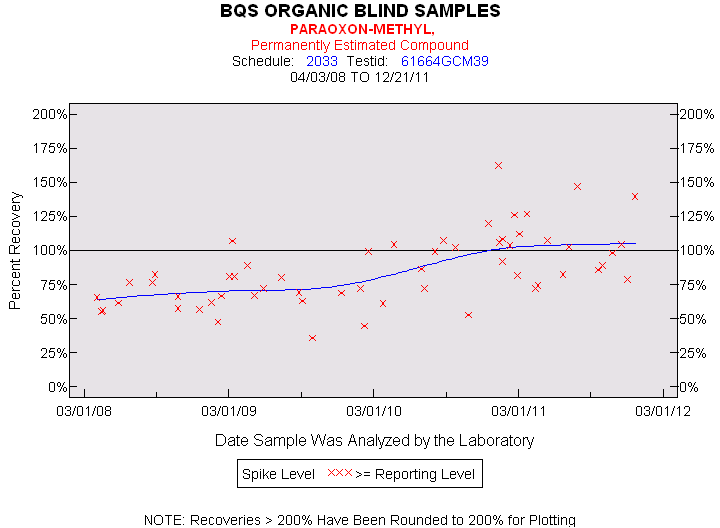
| Statistics for the Plotted Points |
| PARAOXON-METHYL |
| Spike Level | N | Mean | Std-Dev. | Median | F_Pseudo |
|---|---|---|---|---|---|
| >= Reporting Level | 57 | 86% | 26% | 81% | 27% |
| Total | 57 | 86% | 26% | 81% | 27% |
| Miscellaneous Statistics for the Samples |
| PARAOXON-METHYL |
| Characteristic | N | % | % Basis |
|---|---|---|---|
| Plotted | 57 | 95% | Spiked |
| Estimated Values | 57 | 95% | Spiked |
| Deleted Values | 0 | 0% | Spiked + Not Spiked |
| Spiked, Censored | 0 | 0% | Spiked |
| Spiked | 60 | . | |
| False Negatives | 3 | 5% | 3 out of 60 |
| Not Spiked | 123 | . | |
| False Positives | 2 | 2% | 2 out of 123 |
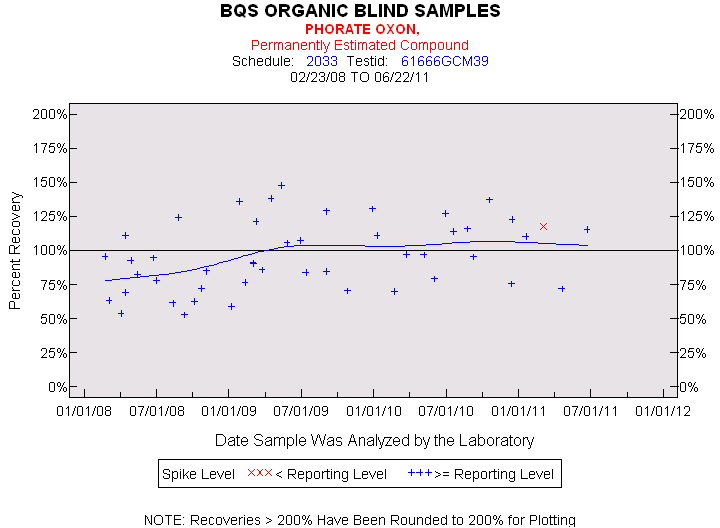
| Statistics for the Plotted Points |
| PHORATE OXON |
| Spike Level | N | Mean | Std-Dev. | Median | F_Pseudo |
|---|---|---|---|---|---|
| < Reporting Level | 1 | 118% | . | 118% | 0% |
| >= Reporting Level | 46 | 96% | 25% | 94% | 29% |
| Total | 47 | 96% | 25% | 95% | 30% |
| Miscellaneous Statistics for the Samples |
| PHORATE OXON |
| Characteristic | N | % | % Basis |
|---|---|---|---|
| Plotted | 47 | 100% | Spiked |
| Estimated Values | 47 | 100% | Spiked |
| Deleted Values | 0 | 0% | Spiked + Not Spiked |
| Spiked, Censored | 0 | 0% | Spiked |
| Spiked | 47 | . | |
| False Negatives | 0 | 0% | 0 out of 47 |
| Not Spiked | 136 | . | |
| False Positives | 0 | 0% | 0 out of 136 |
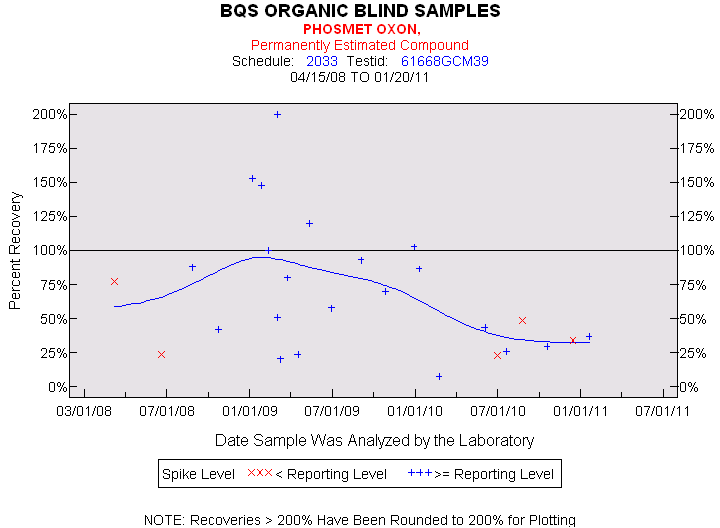
| Statistics for the Plotted Points |
| PHOSMET OXON |
| Spike Level | N | Mean | Std-Dev. | Median | F_Pseudo |
|---|---|---|---|---|---|
| < Reporting Level | 5 | 42% | 23% | 34% | 18% |
| >= Reporting Level | 21 | 75% | 50% | 70% | 47% |
| Total | 26 | 69% | 48% | 55% | 47% |
| Miscellaneous Statistics for the Samples |
| PHOSMET OXON |
| Characteristic | N | % | % Basis |
|---|---|---|---|
| Plotted | 26 | 65% | Spiked |
| Estimated Values | 26 | 65% | Spiked |
| Deleted Values | 10 | 5% | Spiked + Not Spiked |
| Spiked, Censored | 1 | 3% | Spiked |
| Spiked | 42 | . | |
| False Negatives | 13 | 33% | 13 out of 40 |
| Not Spiked | 141 | . | |
| False Positives | 0 | 0% | 0 out of 133 |
| Statistics for the Plotted Points |
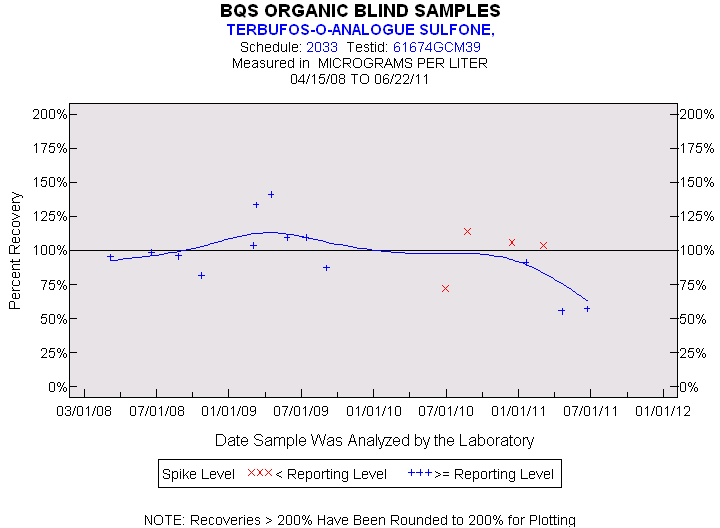
| TERBUFOS-O-ANALOGUE SULFONE |
| Spike Level | N | Mean | Std-Dev. | Median | F_Pseudo |
|---|---|---|---|---|---|
| < Reporting Level | 4 | 99% | 18% | 105% | 16% |
| >= Reporting Level | 13 | 97% | 25% | 96% | 16% |
| Total | 17 | 97% | 23% | 99% | 16% |
| Miscellaneous Statistics for the Samples |
| TERBUFOS-O-ANALOGUE SULFONE |
| Characteristic | N | % | % Basis |
|---|---|---|---|
| Plotted | 17 | 100% | Spiked |
| Estimated Values | 1 | 6% | Spiked |
| Deleted Values | 0 | 0% | Spiked + Not Spiked |
| Spiked, Censored | 0 | 0% | Spiked |
| Spiked | 17 | . | |
| False Negatives | 0 | 0% | 0 out of 17 |
| Not Spiked | 166 | . | |
| False Positives | 0 | 0% | 0 out of 166 |
| Statistics for the Plotted Points |
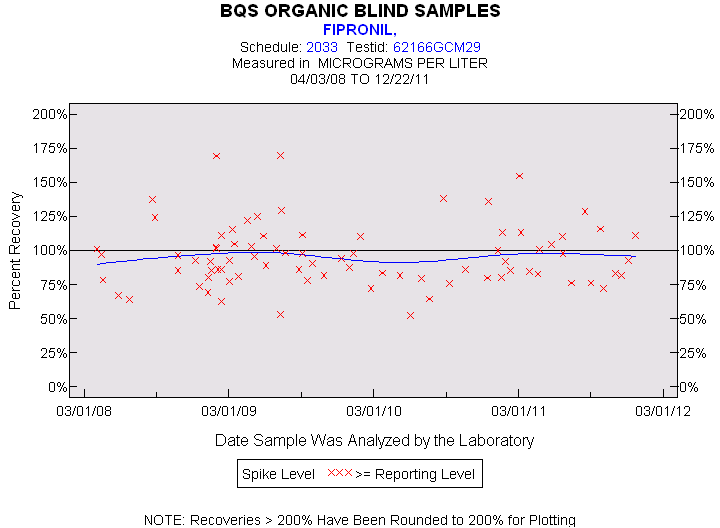
| FIPRONIL |
| Spike Level | N | Mean | Std-Dev. | Median | F_Pseudo |
|---|---|---|---|---|---|
| >= Reporting Level | 81 | 96% | 23% | 93% | 21% |
| Total | 81 | 96% | 23% | 93% | 21% |
| Miscellaneous Statistics for the Samples |
| FIPRONIL |
| Characteristic | N | % | % Basis |
|---|---|---|---|
| Plotted | 81 | 98% | Spiked |
| Estimated Values | 81 | 98% | Spiked |
| Deleted Values | 0 | 0% | Spiked + Not Spiked |
| Spiked, Censored | 0 | 0% | Spiked |
| Spiked | 83 | . | |
| False Negatives | 2 | 2% | 2 out of 83 |
| Not Spiked | 100 | . | |
| False Positives | 5 | 5% | 5 out of 100 |
| Statistics for the Plotted Points |
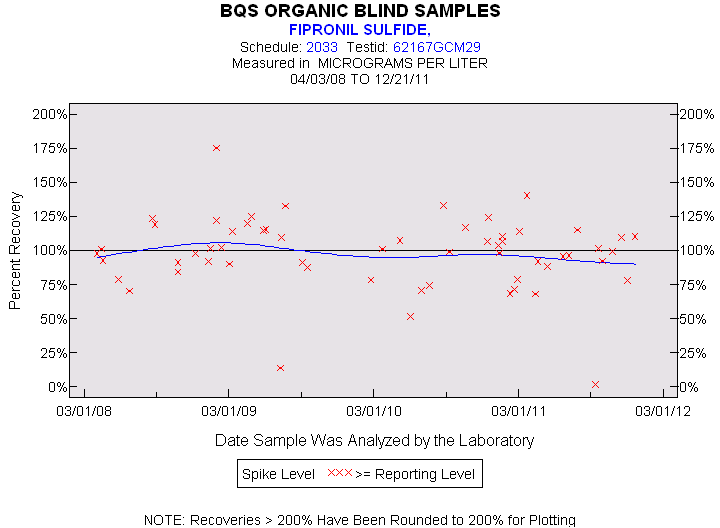
| FIPRONIL SULFIDE |
| Spike Level | N | Mean | Std-Dev. | Median | F_Pseudo |
|---|---|---|---|---|---|
| >= Reporting Level | 59 | 98% | 27% | 99% | 20% |
| Total | 59 | 98% | 27% | 99% | 20% |
| Miscellaneous Statistics for the Samples |
| FIPRONIL SULFIDE |
| Characteristic | N | % | % Basis |
|---|---|---|---|
| Plotted | 59 | 98% | Spiked |
| Estimated Values | 1 | 2% | Spiked |
| Deleted Values | 0 | 0% | Spiked + Not Spiked |
| Spiked, Censored | 0 | 0% | Spiked |
| Spiked | 60 | . | |
| False Negatives | 1 | 2% | 1 out of 60 |
| Not Spiked | 123 | . | |
| False Positives | 35 | 28% | 35 out of 123 |
| Statistics for the Plotted Points |
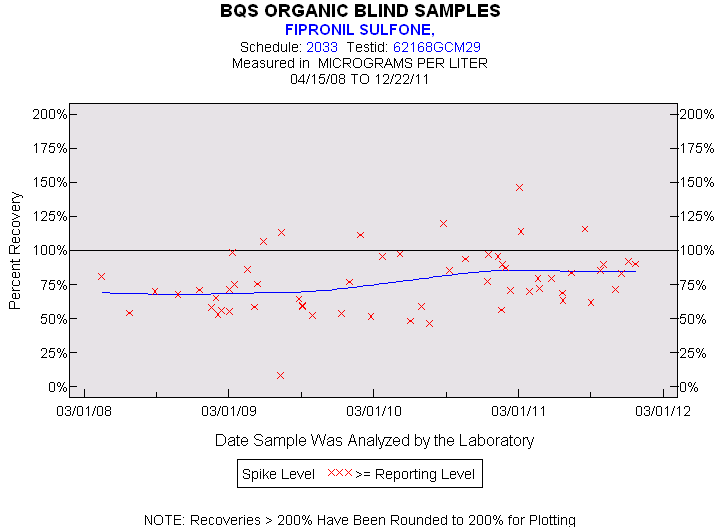
| FIPRONIL SULFONE |
| Spike Level | N | Mean | Std-Dev. | Median | F_Pseudo |
|---|---|---|---|---|---|
| >= Reporting Level | 59 | 77% | 23% | 75% | 23% |
| Total | 59 | 77% | 23% | 75% | 23% |
| Miscellaneous Statistics for the Samples |
| FIPRONIL SULFONE |
| Characteristic | N | % | % Basis |
|---|---|---|---|
| Plotted | 59 | 97% | Spiked |
| Estimated Values | 6 | 10% | Spiked |
| Deleted Values | 0 | 0% | Spiked + Not Spiked |
| Spiked, Censored | 0 | 0% | Spiked |
| Spiked | 61 | . | |
| False Negatives | 2 | 3% | 2 out of 61 |
| Not Spiked | 122 | . | |
| False Positives | 21 | 17% | 21 out of 122 |
| Statistics for the Plotted Points |
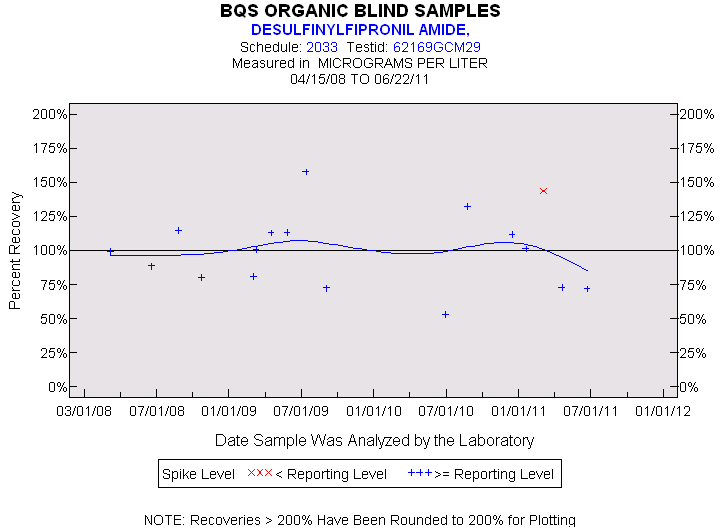
| DESULFINYLFIPRONIL AMIDE |
| Spike Level | N | Mean | Std-Dev. | Median | F_Pseudo |
|---|---|---|---|---|---|
| < Reporting Level | 1 | 144% | . | 144% | 0% |
| >= Reporting Level | 16 | 98% | 26% | 100% | 27% |
| Total | 17 | 101% | 28% | 101% | 25% |
| Miscellaneous Statistics for the Samples |
| DESULFINYLFIPRONIL AMIDE |
| Characteristic | N | % | % Basis |
|---|---|---|---|
| Plotted | 17 | 100% | Spiked |
| Estimated Values | 16 | 94% | Spiked |
| Deleted Values | 0 | 0% | Spiked + Not Spiked |
| Spiked, Censored | 0 | 0% | Spiked |
| Spiked | 17 | . | |
| False Negatives | 0 | 0% | 0 out of 17 |
| Not Spiked | 166 | . | |
| False Positives | 0 | 0% | 0 out of 166 |
| Statistics for the Plotted Points |
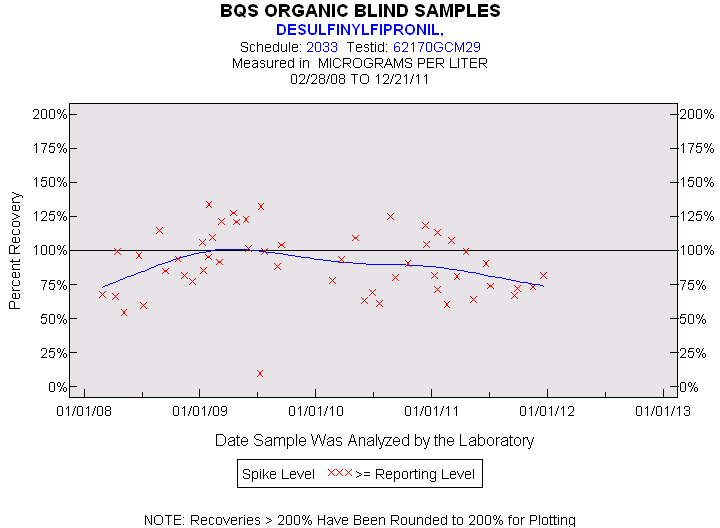
| DESULFINYLFIPRONIL |
| Spike Level | N | Mean | Std-Dev. | Median | F_Pseudo |
|---|---|---|---|---|---|
| >= Reporting Level | 52 | 90% | 24% | 91% | 25% |
| Total | 52 | 90% | 24% | 91% | 25% |
| Miscellaneous Statistics for the Samples |
| DESULFINYLFIPRONIL |
| Characteristic | N | % | % Basis |
|---|---|---|---|
| Plotted | 52 | 100% | Spiked |
| Estimated Values | 1 | 2% | Spiked |
| Deleted Values | 0 | 0% | Spiked + Not Spiked |
| Spiked, Censored | 0 | 0% | Spiked |
| Spiked | 52 | . | |
| False Negatives | 0 | 0% | 0 out of 52 |
| Not Spiked | 131 | . | |
| False Positives | 1 | 1% | 1 out of 131 |
| Statistics for the Plotted Points |
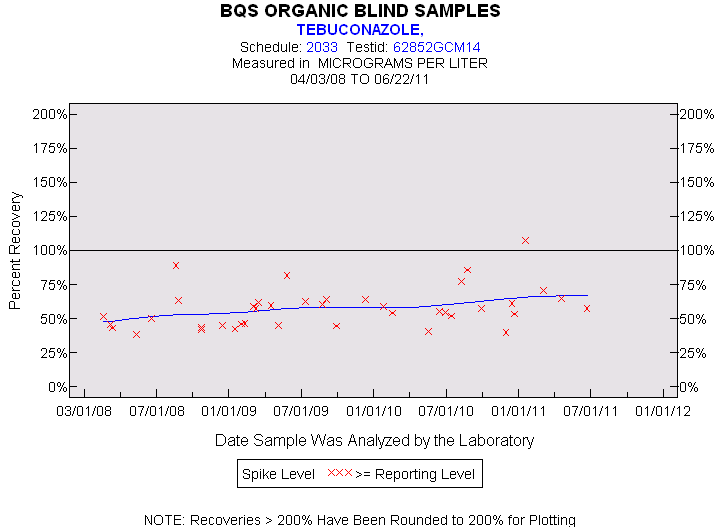
| TEBUCONAZOLE |
| Spike Level | N | Mean | Std-Dev. | Median | F_Pseudo |
|---|---|---|---|---|---|
| >= Reporting Level | 40 | 58% | 15% | 56% | 13% |
| Total | 40 | 58% | 15% | 56% | 13% |
| Miscellaneous Statistics for the Samples |
| TEBUCONAZOLE |
| Characteristic | N | % | % Basis |
|---|---|---|---|
| Plotted | 40 | 98% | Spiked |
| Estimated Values | 1 | 2% | Spiked |
| Deleted Values | 0 | 0% | Spiked + Not Spiked |
| Spiked, Censored | 0 | 0% | Spiked |
| Spiked | 41 | . | |
| False Negatives | 1 | 2% | 1 out of 41 |
| Not Spiked | 142 | . | |
| False Positives | 1 | 1% | 1 out of 142 |
| Statistics for the Plotted Points |
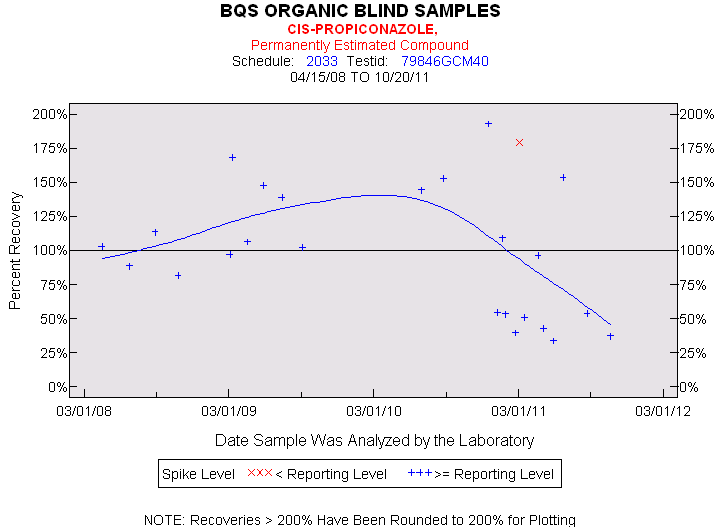
| CIS-PROPICONAZOLE |
| Spike Level | N | Mean | Std-Dev. | Median | F_Pseudo |
|---|---|---|---|---|---|
| < Reporting Level | 1 | 179% | . | 179% | 0% |
| >= Reporting Level | 24 | 99% | 46% | 100% | 65% |
| Total | 25 | 102% | 48% | 102% | 67% |
| Miscellaneous Statistics for the Samples |
| CIS-PROPICONAZOLE |
| Characteristic | N | % | % Basis |
|---|---|---|---|
| Plotted | 25 | 100% | Spiked |
| Estimated Values | 25 | 100% | Spiked |
| Deleted Values | 0 | 0% | Spiked + Not Spiked |
| Spiked, Censored | 0 | 0% | Spiked |
| Spiked | 25 | . | |
| False Negatives | 0 | 0% | 0 out of 25 |
| Not Spiked | 158 | . | |
| False Positives | 0 | 0% | 0 out of 158 |
| Statistics for the Plotted Points |
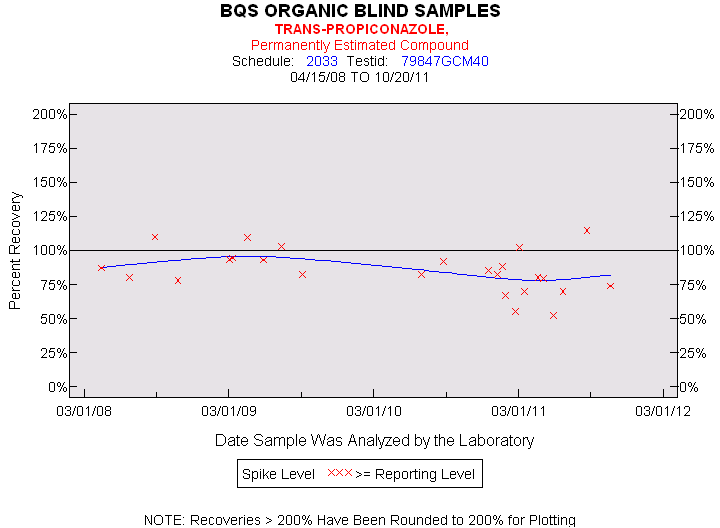
| TRANS-PROPICONAZOLE |
| Spike Level | N | Mean | Std-Dev. | Median | F_Pseudo |
|---|---|---|---|---|---|
| >= Reporting Level | 25 | 85% | 16% | 83% | 11% |
| Total | 25 | 85% | 16% | 83% | 11% |
| Miscellaneous Statistics for the Samples |
| TRANS-PROPICONAZOLE |
| Characteristic | N | % | % Basis |
|---|---|---|---|
| Plotted | 25 | 100% | Spiked |
| Estimated Values | 25 | 100% | Spiked |
| Deleted Values | 0 | 0% | Spiked + Not Spiked |
| Spiked, Censored | 0 | 0% | Spiked |
| Spiked | 25 | . | |
| False Negatives | 0 | 0% | 0 out of 25 |
| Not Spiked | 158 | . | |
| False Positives | 0 | 0% | 0 out of 158 |
| Statistics for the Plotted Points |
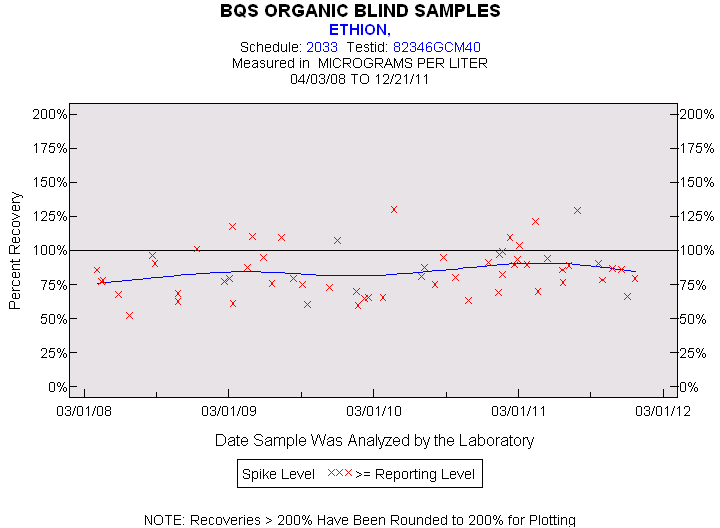
| ETHION |
| Spike Level | N | Mean | Std-Dev. | Median | F_Pseudo |
|---|---|---|---|---|---|
| >= Reporting Level | 59 | 85% | 18% | 82% | 18% |
| Total | 59 | 85% | 18% | 82% | 18% |
| Miscellaneous Statistics for the Samples |
| ETHION |
| Characteristic | N | % | % Basis |
|---|---|---|---|
| Plotted | 59 | 98% | Spiked |
| Estimated Values | 0 | 0% | Spiked |
| Deleted Values | 0 | 0% | Spiked + Not Spiked |
| Spiked, Censored | 0 | 0% | Spiked |
| Spiked | 60 | . | |
| False Negatives | 1 | 2% | 1 out of 60 |
| Not Spiked | 123 | . | |
| False Positives | 1 | 1% | 1 out of 123 |
| Statistics for the Plotted Points |
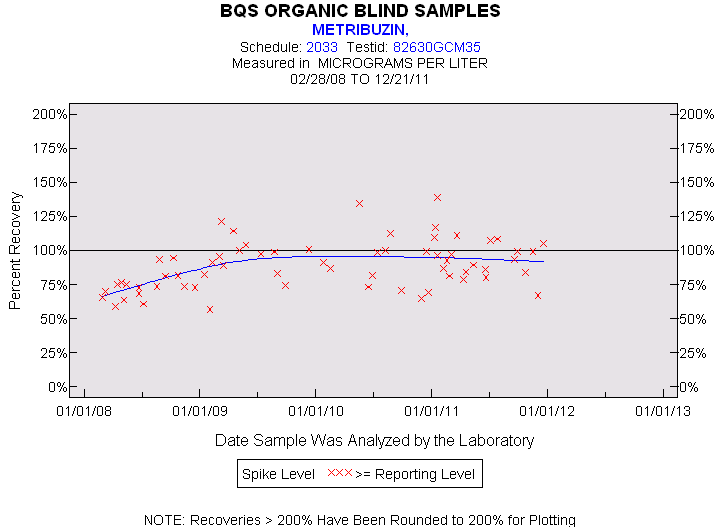
| METRIBUZIN |
| Spike Level | N | Mean | Std-Dev. | Median | F_Pseudo |
|---|---|---|---|---|---|
| >= Reporting Level | 65 | 89% | 18% | 87% | 18% |
| Total | 65 | 89% | 18% | 87% | 18% |
| Miscellaneous Statistics for the Samples |
| METRIBUZIN |
| Characteristic | N | % | % Basis |
|---|---|---|---|
| Plotted | 65 | 97% | Spiked |
| Estimated Values | 0 | 0% | Spiked |
| Deleted Values | 0 | 0% | Spiked + Not Spiked |
| Spiked, Censored | 0 | 0% | Spiked |
| Spiked | 67 | . | |
| False Negatives | 2 | 3% | 2 out of 67 |
| Not Spiked | 116 | . | |
| False Positives | 2 | 2% | 2 out of 116 |
| Statistics for the Plotted Points |
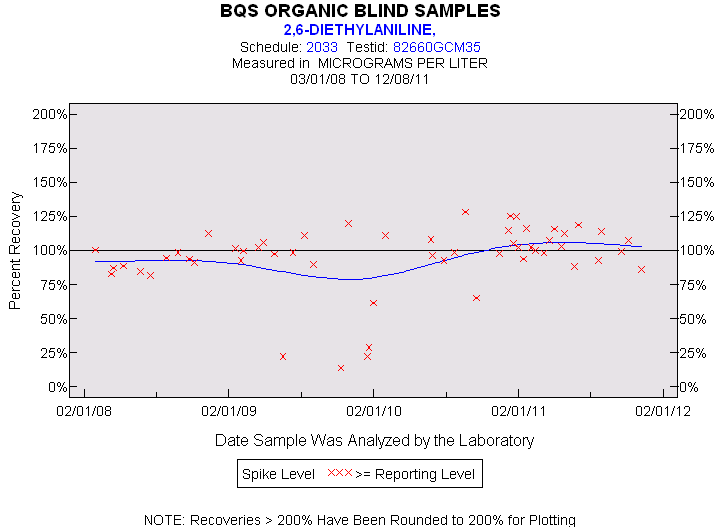
| 2,6-DIETHYLANILINE |
| Spike Level | N | Mean | Std-Dev. | Median | F_Pseudo |
|---|---|---|---|---|---|
| >= Reporting Level | 55 | 95% | 24% | 99% | 13% |
| Total | 55 | 95% | 24% | 99% | 13% |
| Miscellaneous Statistics for the Samples |
| 2,6-DIETHYLANILINE |
| Characteristic | N | % | % Basis |
|---|---|---|---|
| Plotted | 55 | 93% | Spiked |
| Estimated Values | 7 | 12% | Spiked |
| Deleted Values | 0 | 0% | Spiked + Not Spiked |
| Spiked, Censored | 0 | 0% | Spiked |
| Spiked | 59 | . | |
| False Negatives | 4 | 7% | 4 out of 59 |
| Not Spiked | 124 | . | |
| False Positives | 1 | 1% | 1 out of 124 |
| Statistics for the Plotted Points |
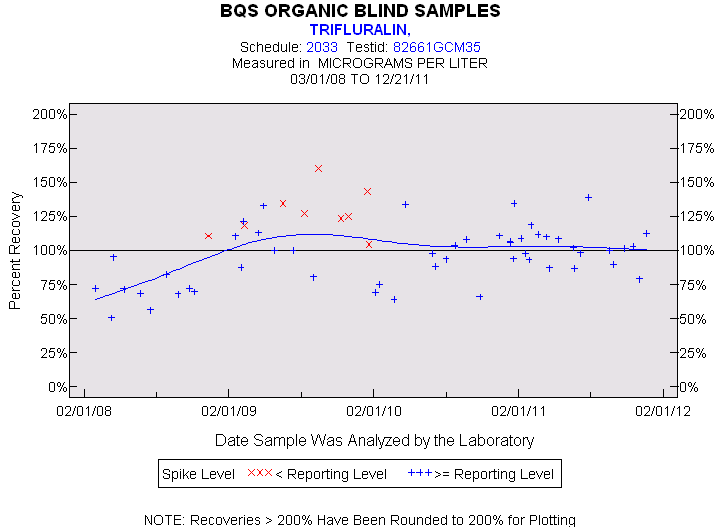
| TRIFLURALIN |
| Spike Level | N | Mean | Std-Dev. | Median | F_Pseudo |
|---|---|---|---|---|---|
| < Reporting Level | 9 | 128% | 17% | 125% | 12% |
| >= Reporting Level | 51 | 95% | 21% | 98% | 22% |
| Total | 60 | 100% | 23% | 101% | 20% |
| Miscellaneous Statistics for the Samples |
| TRIFLURALIN |
| Characteristic | N | % | % Basis |
|---|---|---|---|
| Plotted | 60 | 98% | Spiked |
| Estimated Values | 4 | 7% | Spiked |
| Deleted Values | 0 | 0% | Spiked + Not Spiked |
| Spiked, Censored | 0 | 0% | Spiked |
| Spiked | 61 | . | |
| False Negatives | 1 | 2% | 1 out of 61 |
| Not Spiked | 122 | . | |
| False Positives | 1 | 1% | 1 out of 122 |
| Statistics for the Plotted Points |
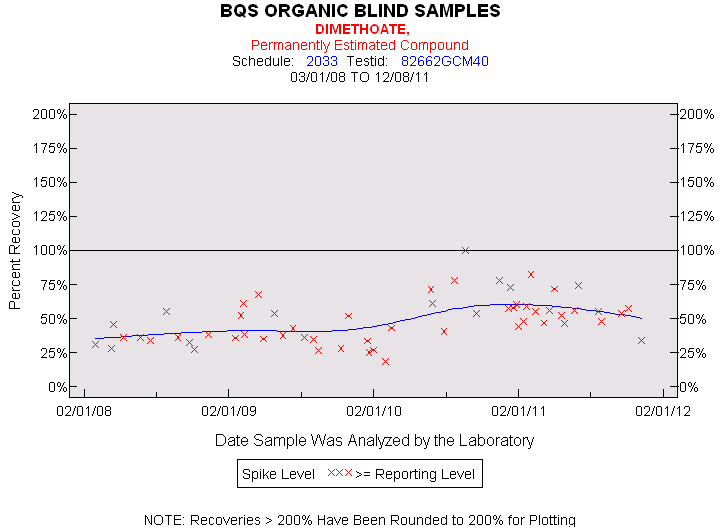
| DIMETHOATE |
| Spike Level | N | Mean | Std-Dev. | Median | F_Pseudo |
|---|---|---|---|---|---|
| >= Reporting Level | 58 | 49% | 17% | 47% | 16% |
| Total | 58 | 49% | 17% | 47% | 16% |
| Miscellaneous Statistics for the Samples |
| DIMETHOATE |
| Characteristic | N | % | % Basis |
|---|---|---|---|
| Plotted | 58 | 98% | Spiked |
| Estimated Values | 58 | 98% | Spiked |
| Deleted Values | 0 | 0% | Spiked + Not Spiked |
| Spiked, Censored | 0 | 0% | Spiked |
| Spiked | 59 | . | |
| False Negatives | 1 | 2% | 1 out of 59 |
| Not Spiked | 124 | . | |
| False Positives | 1 | 1% | 1 out of 124 |
| Statistics for the Plotted Points |
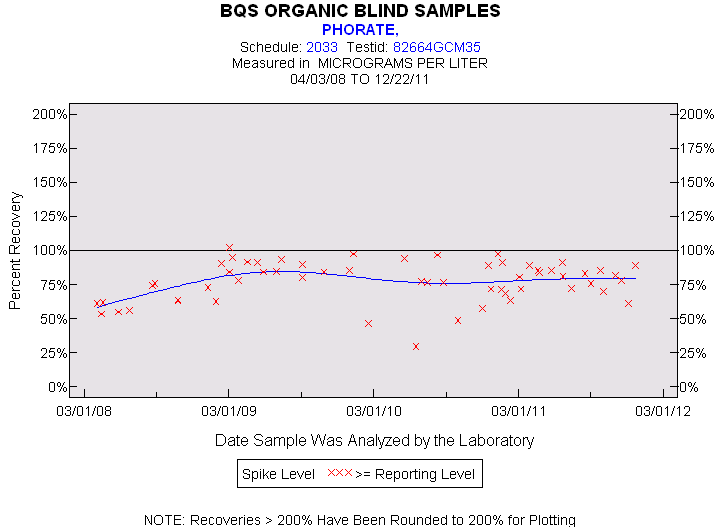
| PHORATE |
| Spike Level | N | Mean | Std-Dev. | Median | F_Pseudo |
|---|---|---|---|---|---|
| >= Reporting Level | 59 | 77% | 15% | 81% | 15% |
| Total | 59 | 77% | 15% | 81% | 15% |
| Miscellaneous Statistics for the Samples |
| PHORATE |
| Characteristic | N | % | % Basis |
|---|---|---|---|
| Plotted | 59 | 97% | Spiked |
| Estimated Values | 4 | 7% | Spiked |
| Deleted Values | 0 | 0% | Spiked + Not Spiked |
| Spiked, Censored | 0 | 0% | Spiked |
| Spiked | 61 | . | |
| False Negatives | 2 | 3% | 2 out of 61 |
| Not Spiked | 122 | . | |
| False Positives | 2 | 2% | 2 out of 122 |
| Statistics for the Plotted Points |
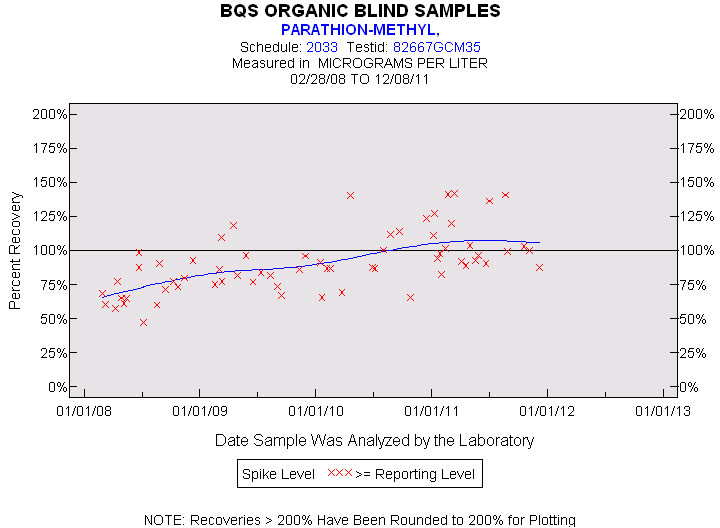
| PARATHION-METHYL |
| Spike Level | N | Mean | Std-Dev. | Median | F_Pseudo |
|---|---|---|---|---|---|
| >= Reporting Level | 65 | 91% | 22% | 88% | 17% |
| Total | 65 | 91% | 22% | 88% | 17% |
| Miscellaneous Statistics for the Samples |
| PARATHION-METHYL |
| Characteristic | N | % | % Basis |
|---|---|---|---|
| Plotted | 65 | 98% | Spiked |
| Estimated Values | 4 | 6% | Spiked |
| Deleted Values | 0 | 0% | Spiked + Not Spiked |
| Spiked, Censored | 0 | 0% | Spiked |
| Spiked | 66 | . | |
| False Negatives | 1 | 2% | 1 out of 66 |
| Not Spiked | 117 | . | |
| False Positives | 1 | 1% | 1 out of 117 |
| Statistics for the Plotted Points |
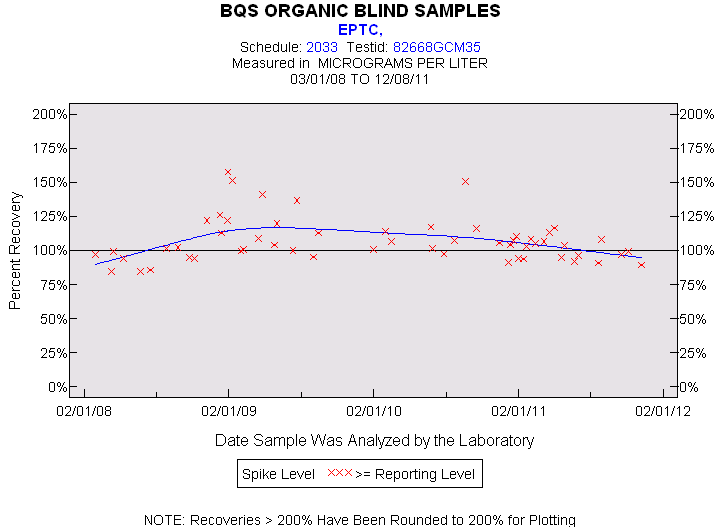
| EPTC |
| Spike Level | N | Mean | Std-Dev. | Median | F_Pseudo |
|---|---|---|---|---|---|
| >= Reporting Level | 57 | 107% | 16% | 104% | 12% |
| Total | 57 | 107% | 16% | 104% | 12% |
| Miscellaneous Statistics for the Samples |
| EPTC |
| Characteristic | N | % | % Basis |
|---|---|---|---|
| Plotted | 57 | 97% | Spiked |
| Estimated Values | 9 | 15% | Spiked |
| Deleted Values | 0 | 0% | Spiked + Not Spiked |
| Spiked, Censored | 0 | 0% | Spiked |
| Spiked | 59 | . | |
| False Negatives | 2 | 3% | 2 out of 59 |
| Not Spiked | 124 | . | |
| False Positives | 2 | 2% | 2 out of 124 |
| Statistics for the Plotted Points |
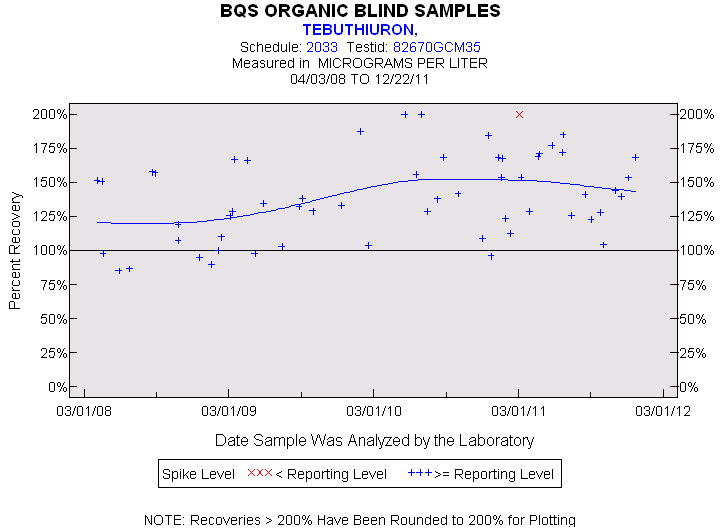
| TEBUTHIURON |
| Spike Level | N | Mean | Std-Dev. | Median | F_Pseudo |
|---|---|---|---|---|---|
| < Reporting Level | 1 | 200% | . | 200% | 0% |
| >= Reporting Level | 57 | 138% | 30% | 138% | 40% |
| Total | 58 | 139% | 31% | 138% | 40% |
| Miscellaneous Statistics for the Samples |
| TEBUTHIURON |
| Characteristic | N | % | % Basis |
|---|---|---|---|
| Plotted | 58 | 95% | Spiked |
| Estimated Values | 13 | 21% | Spiked |
| Deleted Values | 0 | 0% | Spiked + Not Spiked |
| Spiked, Censored | 0 | 0% | Spiked |
| Spiked | 61 | . | |
| False Negatives | 3 | 5% | 3 out of 61 |
| Not Spiked | 122 | . | |
| False Positives | 3 | 2% | 3 out of 122 |
| Statistics for the Plotted Points |
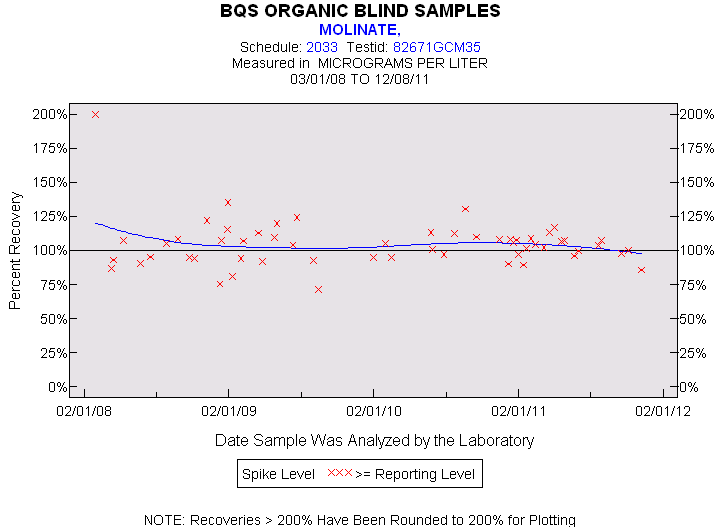
| MOLINATE |
| Spike Level | N | Mean | Std-Dev. | Median | F_Pseudo |
|---|---|---|---|---|---|
| >= Reporting Level | 57 | 105% | 18% | 105% | 10% |
| Total | 57 | 105% | 18% | 105% | 10% |
| Miscellaneous Statistics for the Samples |
| MOLINATE |
| Characteristic | N | % | % Basis |
|---|---|---|---|
| Plotted | 57 | 97% | Spiked |
| Estimated Values | 2 | 3% | Spiked |
| Deleted Values | 0 | 0% | Spiked + Not Spiked |
| Spiked, Censored | 0 | 0% | Spiked |
| Spiked | 59 | . | |
| False Negatives | 2 | 3% | 2 out of 59 |
| Not Spiked | 124 | . | |
| False Positives | 2 | 2% | 2 out of 124 |
| Statistics for the Plotted Points |
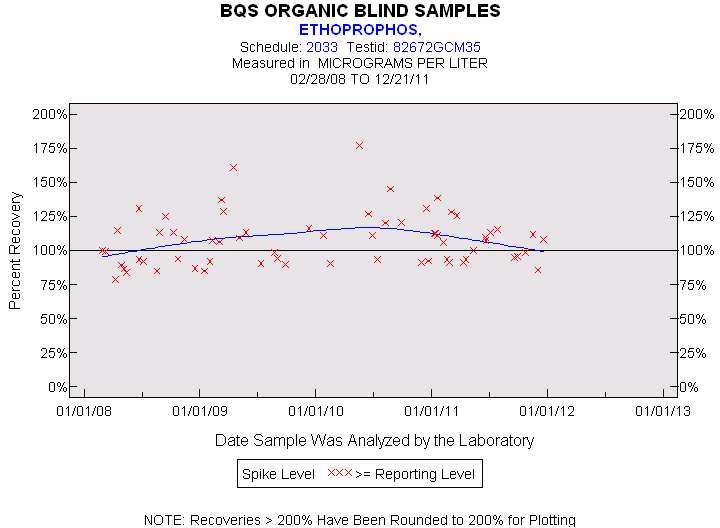
| ETHOPROPHOS |
| Spike Level | N | Mean | Std-Dev. | Median | F_Pseudo |
|---|---|---|---|---|---|
| >= Reporting Level | 65 | 108% | 19% | 107% | 17% |
| Total | 65 | 108% | 19% | 107% | 17% |
| Miscellaneous Statistics for the Samples |
| ETHOPROPHOS |
| Characteristic | N | % | % Basis |
|---|---|---|---|
| Plotted | 65 | 97% | Spiked |
| Estimated Values | 5 | 7% | Spiked |
| Deleted Values | 0 | 0% | Spiked + Not Spiked |
| Spiked, Censored | 0 | 0% | Spiked |
| Spiked | 67 | . | |
| False Negatives | 2 | 3% | 2 out of 67 |
| Not Spiked | 116 | . | |
| False Positives | 3 | 3% | 3 out of 116 |
| Statistics for the Plotted Points |
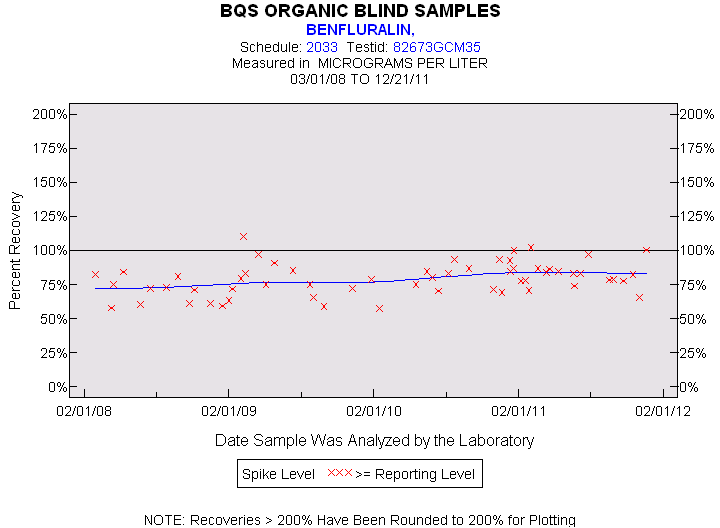
| BENFLURALIN |
| Spike Level | N | Mean | Std-Dev. | Median | F_Pseudo |
|---|---|---|---|---|---|
| >= Reporting Level | 59 | 79% | 12% | 79% | 11% |
| Total | 59 | 79% | 12% | 79% | 11% |
| Miscellaneous Statistics for the Samples |
| BENFLURALIN |
| Characteristic | N | % | % Basis |
|---|---|---|---|
| Plotted | 59 | 97% | Spiked |
| Estimated Values | 2 | 3% | Spiked |
| Deleted Values | 0 | 0% | Spiked + Not Spiked |
| Spiked, Censored | 0 | 0% | Spiked |
| Spiked | 61 | . | |
| False Negatives | 2 | 3% | 2 out of 61 |
| Not Spiked | 122 | . | |
| False Positives | 2 | 2% | 2 out of 122 |
| Statistics for the Plotted Points |
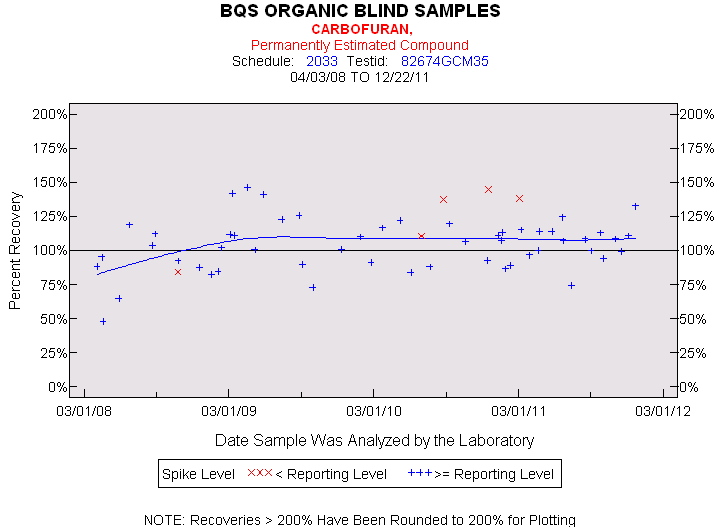
| CARBOFURAN |
| Spike Level | N | Mean | Std-Dev. | Median | F_Pseudo |
|---|---|---|---|---|---|
| < Reporting Level | 5 | 123% | 25% | 138% | 20% |
| >= Reporting Level | 53 | 104% | 19% | 107% | 17% |
| Total | 58 | 105% | 20% | 107% | 18% |
| Miscellaneous Statistics for the Samples |
| CARBOFURAN |
| Characteristic | N | % | % Basis |
|---|---|---|---|
| Plotted | 58 | 95% | Spiked |
| Estimated Values | 58 | 95% | Spiked |
| Deleted Values | 0 | 0% | Spiked + Not Spiked |
| Spiked, Censored | 0 | 0% | Spiked |
| Spiked | 61 | . | |
| False Negatives | 3 | 5% | 3 out of 61 |
| Not Spiked | 122 | . | |
| False Positives | 3 | 2% | 3 out of 122 |
| Statistics for the Plotted Points |
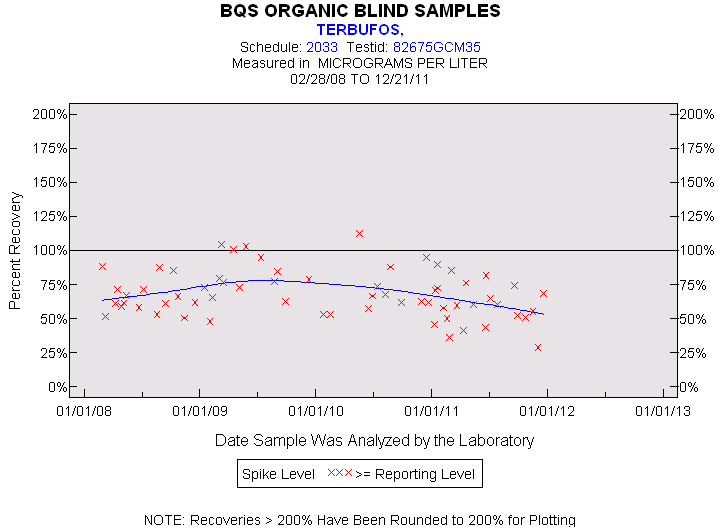
| TERBUFOS |
| Spike Level | N | Mean | Std-Dev. | Median | F_Pseudo |
|---|---|---|---|---|---|
| >= Reporting Level | 65 | 68% | 17% | 66% | 14% |
| Total | 65 | 68% | 17% | 66% | 14% |
| Miscellaneous Statistics for the Samples |
| TERBUFOS |
| Characteristic | N | % | % Basis |
|---|---|---|---|
| Plotted | 65 | 97% | Spiked |
| Estimated Values | 1 | 1% | Spiked |
| Deleted Values | 0 | 0% | Spiked + Not Spiked |
| Spiked, Censored | 0 | 0% | Spiked |
| Spiked | 67 | . | |
| False Negatives | 2 | 3% | 2 out of 67 |
| Not Spiked | 116 | . | |
| False Positives | 2 | 2% | 2 out of 116 |
| Statistics for the Plotted Points |
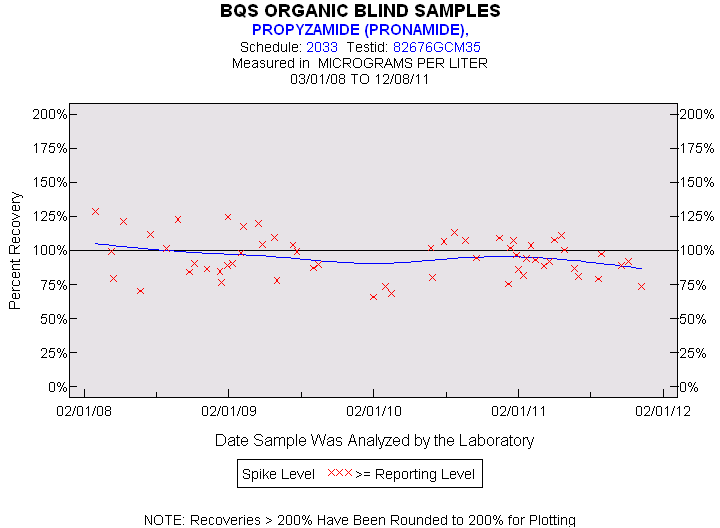
| PROPYZAMIDE (PRONAMIDE) |
| Spike Level | N | Mean | Std-Dev. | Median | F_Pseudo |
|---|---|---|---|---|---|
| >= Reporting Level | 57 | 95% | 15% | 94% | 16% |
| Total | 57 | 95% | 15% | 94% | 16% |
| Miscellaneous Statistics for the Samples |
| PROPYZAMIDE (PRONAMIDE) |
| Characteristic | N | % | % Basis |
|---|---|---|---|
| Plotted | 57 | 97% | Spiked |
| Estimated Values | 1 | 2% | Spiked |
| Deleted Values | 0 | 0% | Spiked + Not Spiked |
| Spiked, Censored | 0 | 0% | Spiked |
| Spiked | 59 | . | |
| False Negatives | 2 | 3% | 2 out of 59 |
| Not Spiked | 124 | . | |
| False Positives | 2 | 2% | 2 out of 124 |
| Statistics for the Plotted Points |
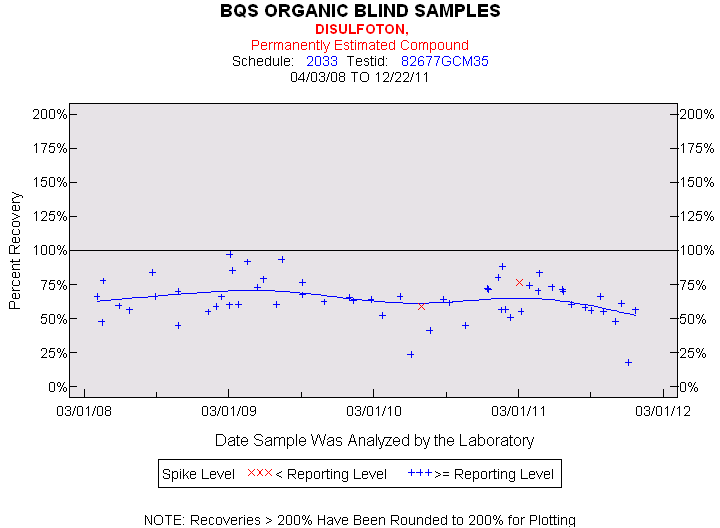
| DISULFOTON |
| Spike Level | N | Mean | Std-Dev. | Median | F_Pseudo |
|---|---|---|---|---|---|
| < Reporting Level | 2 | 68% | 12% | 68% | 13% |
| >= Reporting Level | 57 | 64% | 15% | 64% | 12% |
| Total | 59 | 64% | 15% | 64% | 12% |
| Miscellaneous Statistics for the Samples |
| DISULFOTON |
| Characteristic | N | % | % Basis |
|---|---|---|---|
| Plotted | 59 | 97% | Spiked |
| Estimated Values | 59 | 97% | Spiked |
| Deleted Values | 0 | 0% | Spiked + Not Spiked |
| Spiked, Censored | 0 | 0% | Spiked |
| Spiked | 61 | . | |
| False Negatives | 2 | 3% | 2 out of 61 |
| Not Spiked | 122 | . | |
| False Positives | 2 | 2% | 2 out of 122 |
| Statistics for the Plotted Points |
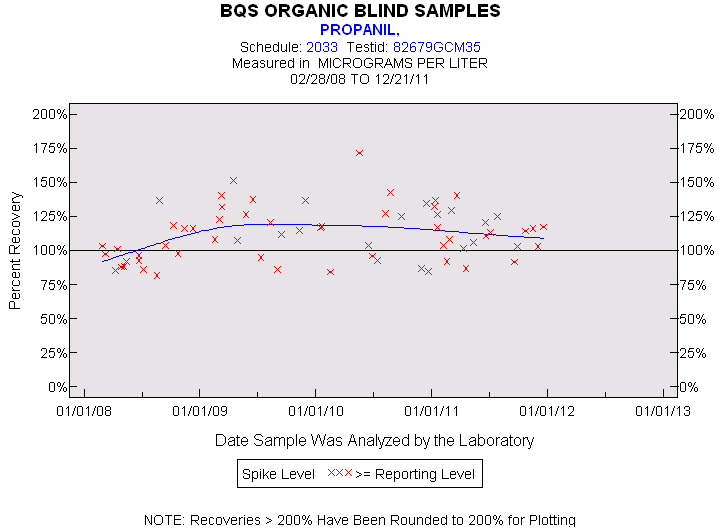
| PROPANIL |
| Spike Level | N | Mean | Std-Dev. | Median | F_Pseudo |
|---|---|---|---|---|---|
| >= Reporting Level | 66 | 112% | 19% | 111% | 22% |
| Total | 66 | 112% | 19% | 111% | 22% |
| Miscellaneous Statistics for the Samples |
| PROPANIL |
| Characteristic | N | % | % Basis |
|---|---|---|---|
| Plotted | 66 | 99% | Spiked |
| Estimated Values | 2 | 3% | Spiked |
| Deleted Values | 0 | 0% | Spiked + Not Spiked |
| Spiked, Censored | 0 | 0% | Spiked |
| Spiked | 67 | . | |
| False Negatives | 1 | 1% | 1 out of 67 |
| Not Spiked | 116 | . | |
| False Positives | 1 | 1% | 1 out of 116 |
| Statistics for the Plotted Points |
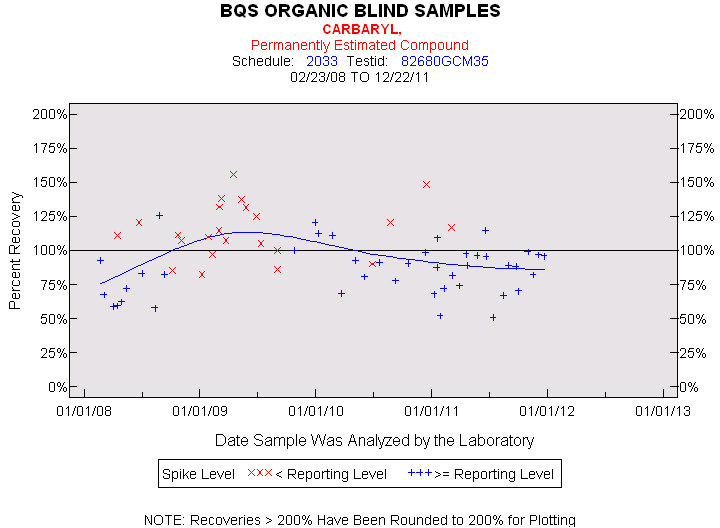
| CARBARYL |
| Spike Level | N | Mean | Std-Dev. | Median | F_Pseudo |
|---|---|---|---|---|---|
| < Reporting Level | 23 | 115% | 20% | 112% | 24% |
| >= Reporting Level | 42 | 85% | 19% | 88% | 20% |
| Total | 65 | 96% | 24% | 96% | 22% |
| Miscellaneous Statistics for the Samples |
| CARBARYL |
| Characteristic | N | % | % Basis |
|---|---|---|---|
| Plotted | 65 | 97% | Spiked |
| Estimated Values | 65 | 97% | Spiked |
| Deleted Values | 0 | 0% | Spiked + Not Spiked |
| Spiked, Censored | 0 | 0% | Spiked |
| Spiked | 67 | . | |
| False Negatives | 2 | 3% | 2 out of 67 |
| Not Spiked | 116 | . | |
| False Positives | 3 | 3% | 3 out of 116 |
| Statistics for the Plotted Points |
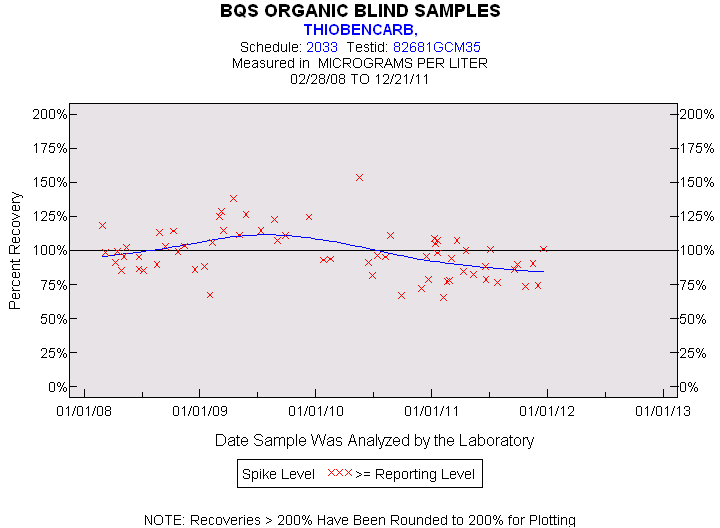
| THIOBENCARB |
| Spike Level | N | Mean | Std-Dev. | Median | F_Pseudo |
|---|---|---|---|---|---|
| >= Reporting Level | 65 | 98% | 18% | 96% | 16% |
| Total | 65 | 98% | 18% | 96% | 16% |
| Miscellaneous Statistics for the Samples |
| THIOBENCARB |
| Characteristic | N | % | % Basis |
|---|---|---|---|
| Plotted | 65 | 97% | Spiked |
| Estimated Values | 0 | 0% | Spiked |
| Deleted Values | 0 | 0% | Spiked + Not Spiked |
| Spiked, Censored | 0 | 0% | Spiked |
| Spiked | 67 | . | |
| False Negatives | 2 | 3% | 2 out of 67 |
| Not Spiked | 116 | . | |
| False Positives | 7 | 6% | 7 out of 116 |
| Statistics for the Plotted Points |
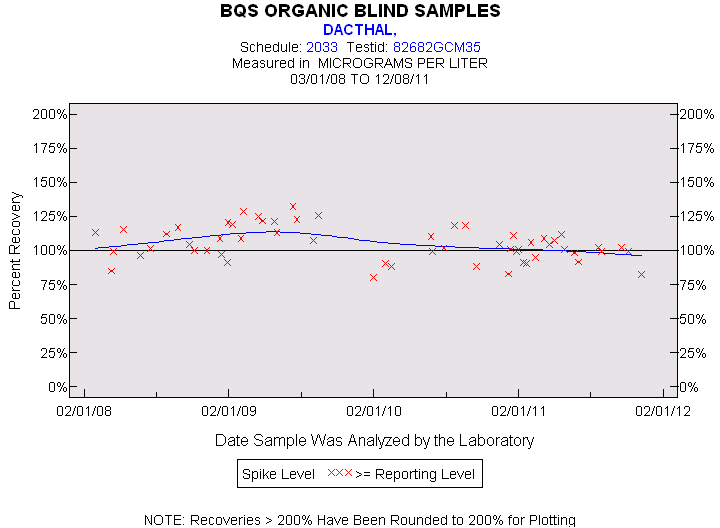
| DACTHAL |
| Spike Level | N | Mean | Std-Dev. | Median | F_Pseudo |
|---|---|---|---|---|---|
| >= Reporting Level | 57 | 105% | 12% | 103% | 11% |
| Total | 57 | 105% | 12% | 103% | 11% |
| Miscellaneous Statistics for the Samples |
| DACTHAL |
| Characteristic | N | % | % Basis |
|---|---|---|---|
| Plotted | 57 | 97% | Spiked |
| Estimated Values | 6 | 10% | Spiked |
| Deleted Values | 0 | 0% | Spiked + Not Spiked |
| Spiked, Censored | 0 | 0% | Spiked |
| Spiked | 59 | . | |
| False Negatives | 2 | 3% | 2 out of 59 |
| Not Spiked | 124 | . | |
| False Positives | 2 | 2% | 2 out of 124 |
| Statistics for the Plotted Points |
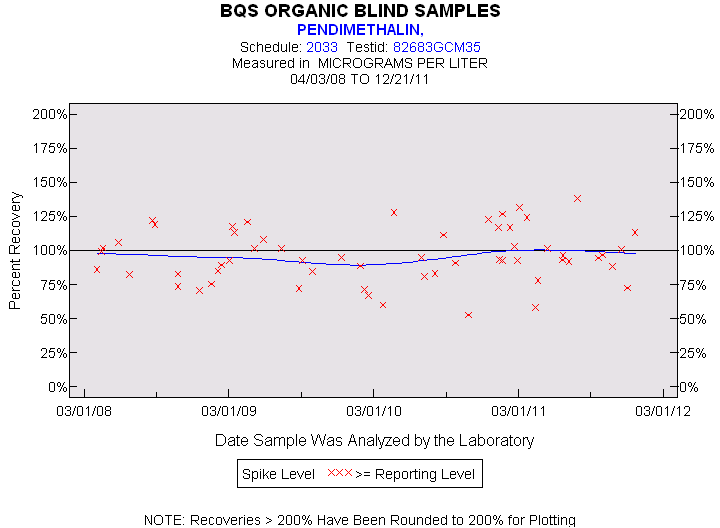
| PENDIMETHALIN |
| Spike Level | N | Mean | Std-Dev. | Median | F_Pseudo |
|---|---|---|---|---|---|
| >= Reporting Level | 58 | 96% | 19% | 94% | 21% |
| Total | 58 | 96% | 19% | 94% | 21% |
| Miscellaneous Statistics for the Samples |
| PENDIMETHALIN |
| Characteristic | N | % | % Basis |
|---|---|---|---|
| Plotted | 58 | 97% | Spiked |
| Estimated Values | 2 | 3% | Spiked |
| Deleted Values | 0 | 0% | Spiked + Not Spiked |
| Spiked, Censored | 0 | 0% | Spiked |
| Spiked | 60 | . | |
| False Negatives | 2 | 3% | 2 out of 60 |
| Not Spiked | 123 | . | |
| False Positives | 2 | 2% | 2 out of 123 |
| Statistics for the Plotted Points |
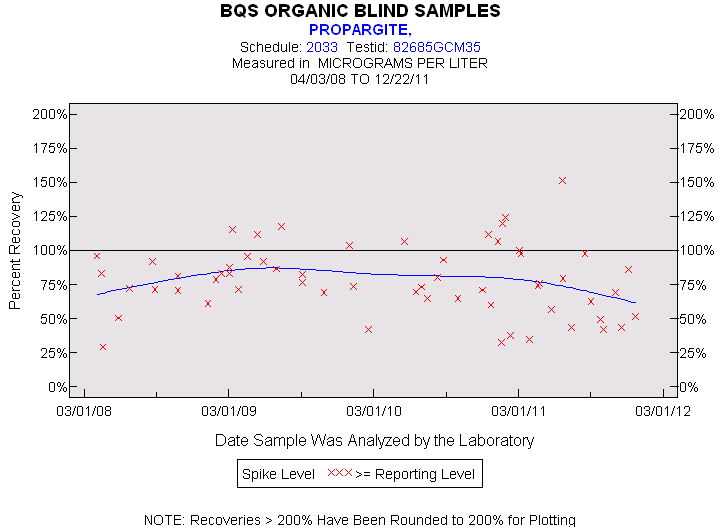
| PROPARGITE |
| Spike Level | N | Mean | Std-Dev. | Median | F_Pseudo |
|---|---|---|---|---|---|
| >= Reporting Level | 59 | 78% | 25% | 77% | 25% |
| Total | 59 | 78% | 25% | 77% | 25% |
| Miscellaneous Statistics for the Samples |
| PROPARGITE |
| Characteristic | N | % | % Basis |
|---|---|---|---|
| Plotted | 59 | 97% | Spiked |
| Estimated Values | 4 | 7% | Spiked |
| Deleted Values | 0 | 0% | Spiked + Not Spiked |
| Spiked, Censored | 0 | 0% | Spiked |
| Spiked | 61 | . | |
| False Negatives | 2 | 3% | 2 out of 61 |
| Not Spiked | 122 | . | |
| False Positives | 2 | 2% | 2 out of 122 |
| Statistics for the Plotted Points |
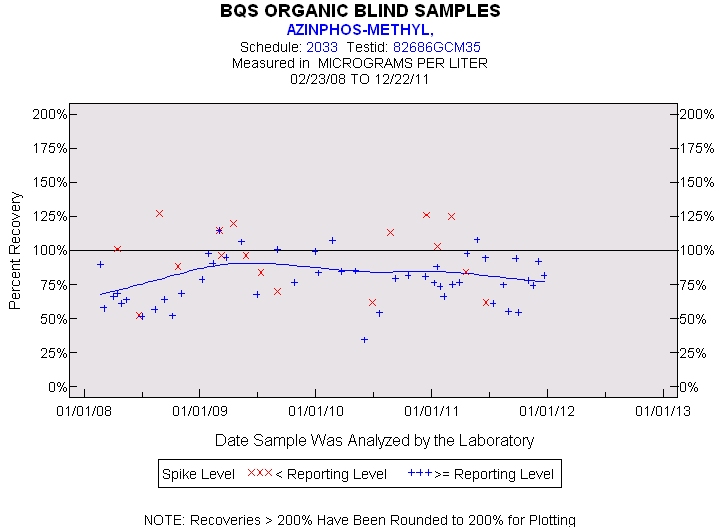
| AZINPHOS-METHYL |
| Spike Level | N | Mean | Std-Dev. | Median | F_Pseudo |
|---|---|---|---|---|---|
| < Reporting Level | 17 | 96% | 24% | 96% | 23% |
| >= Reporting Level | 48 | 78% | 18% | 77% | 19% |
| Total | 65 | 83% | 21% | 82% | 22% |
| Miscellaneous Statistics for the Samples |
| AZINPHOS-METHYL |
| Characteristic | N | % | % Basis |
|---|---|---|---|
| Plotted | 65 | 97% | Spiked |
| Estimated Values | 65 | 97% | Spiked |
| Deleted Values | 0 | 0% | Spiked + Not Spiked |
| Spiked, Censored | 0 | 0% | Spiked |
| Spiked | 67 | . | |
| False Negatives | 2 | 3% | 2 out of 67 |
| Not Spiked | 116 | . | |
| False Positives | 2 | 2% | 2 out of 116 |
| Statistics for the Plotted Points |
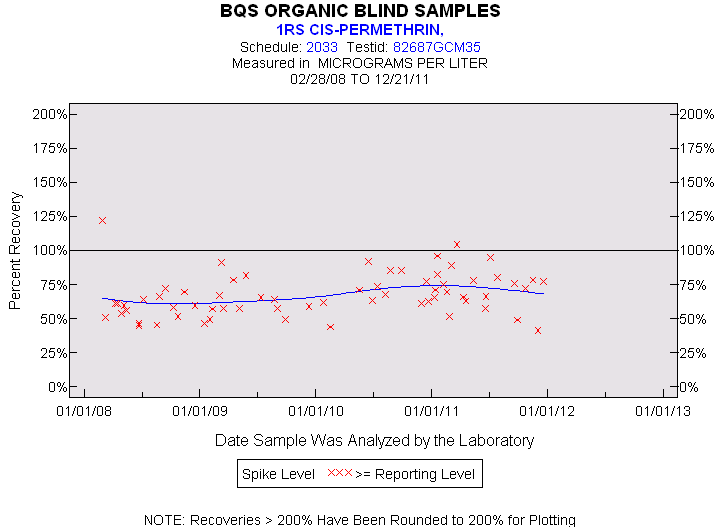
| 1RS CIS-PERMETHRIN |
| Spike Level | N | Mean | Std-Dev. | Median | F_Pseudo |
|---|---|---|---|---|---|
| >= Reporting Level | 65 | 67% | 16% | 65% | 15% |
| Total | 65 | 67% | 16% | 65% | 15% |
| Miscellaneous Statistics for the Samples |
| 1RS CIS-PERMETHRIN |
| Characteristic | N | % | % Basis |
|---|---|---|---|
| Plotted | 65 | 97% | Spiked |
| Estimated Values | 2 | 3% | Spiked |
| Deleted Values | 0 | 0% | Spiked + Not Spiked |
| Spiked, Censored | 0 | 0% | Spiked |
| Spiked | 67 | . | |
| False Negatives | 2 | 3% | 2 out of 67 |
| Not Spiked | 116 | . | |
| False Positives | 2 | 2% | 2 out of 116 |