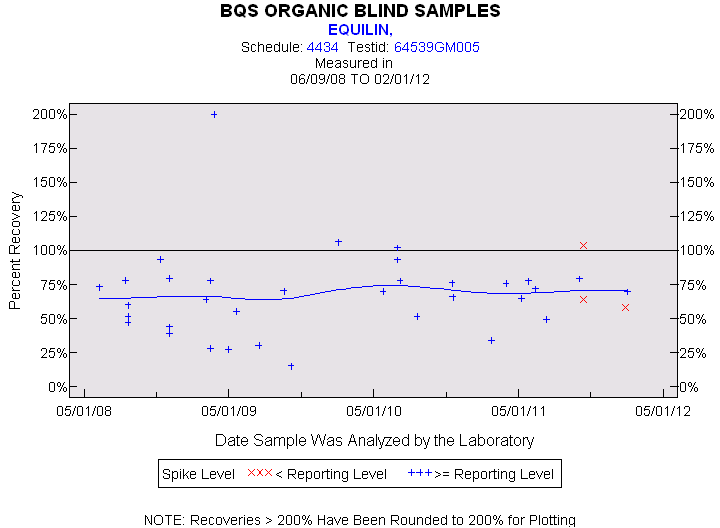
Statistics for the Plotted Points
EQUILIN
Spike Level
N
Mean
Std-Dev.
Median
F_Pseudo
< Reporting Level
3
75%
25%
64%
34%
>= Reporting Level
34
68%
32%
70%
21%
Total
37
68%
31%
70%
19%
Miscellaneous Statistics for the Samples
EQUILIN
Characteristic
N
%
% Basis
Plotted
37
76%
Spiked
Estimated Values
37
76%
Spiked
Deleted Values
2
2%
Spiked + Not Spiked
Spiked, Censored
1
2%
Spiked
Spiked
51
.
False Negatives
11
22%
11 out of 49
Not Spiked
43
.
False Positives
0
0%
0 out of 43