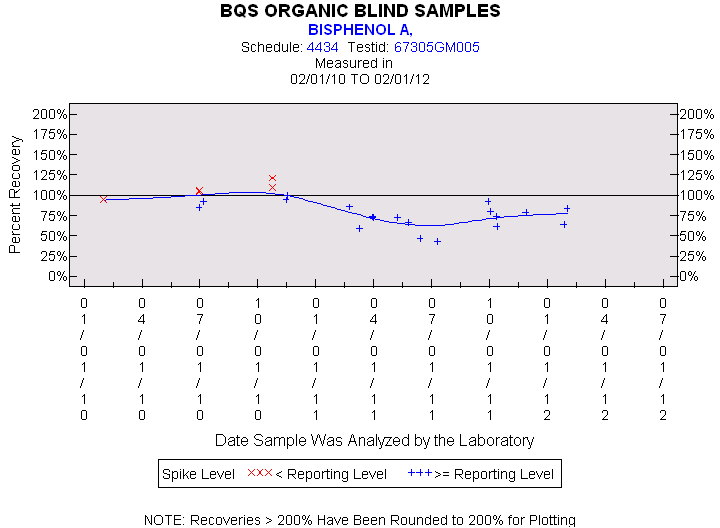
Statistics for the Plotted Points
BISPHENOL A
Spike Level
N
Mean
Std-Dev.
Median
F_Pseudo
< Reporting Level
5
107%
10%
106%
4%
>= Reporting Level
19
75%
16%
74%
16%
Total
24
82%
20%
82%
18%
Miscellaneous Statistics for the Samples
BISPHENOL A
Characteristic
N
%
% Basis
Plotted
24
89%
Spiked
Estimated Values
0
0%
Spiked
Deleted Values
0
0%
Spiked + Not Spiked
Spiked, Censored
3
11%
Spiked
Spiked
27
.
False Negatives
0
0%
0 out of 27
Not Spiked
59
.
False Positives
0
0%
0 out of 59