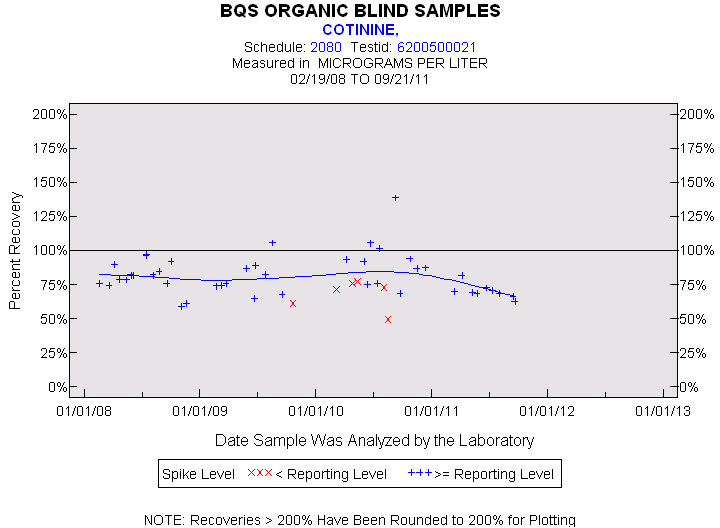
Statistics for the Plotted Points
COTININE
Spike Level
N
Mean
Std-Dev.
Median
F_Pseudo
< Reporting Level
6
68%
11%
72%
10%
>= Reporting Level
44
81%
15%
79%
14%
Total
50
80%
15%
76%
13%
Miscellaneous Statistics for the Samples
COTININE
Characteristic
N
%
% Basis
Plotted
50
91%
Spiked
Estimated Values
6
11%
Spiked
Deleted Values
1
1%
Spiked + Not Spiked
Spiked, Censored
1
2%
Spiked
Spiked
55
.
False Negatives
4
7%
4 out of 55
Not Spiked
46
.
False Positives
0
0%
0 out of 45