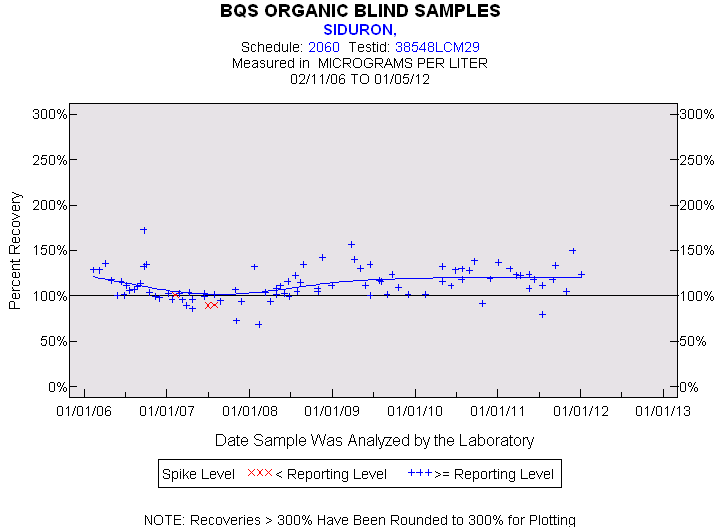
Statistics for the Plotted Points
SIDURON
Spike Level
N
Mean
Std-Dev.
Median
F_Pseudo
< Reporting Level
3
94%
6%
90%
9%
>= Reporting Level
90
113%
17%
111%
16%
Total
93
113%
18%
110%
17%
Miscellaneous Statistics for the Samples
SIDURON
Characteristic
N
%
% Basis
Plotted
93
99%
Spiked
Estimated Values
9
10%
Spiked
Deleted Values
0
0%
Spiked + Not Spiked
Spiked, Censored
1
1%
Spiked
Spiked
94
.
False Negatives
0
0%
0 out of 94
Not Spiked
130
.
False Positives
0
0%
0 out of 130