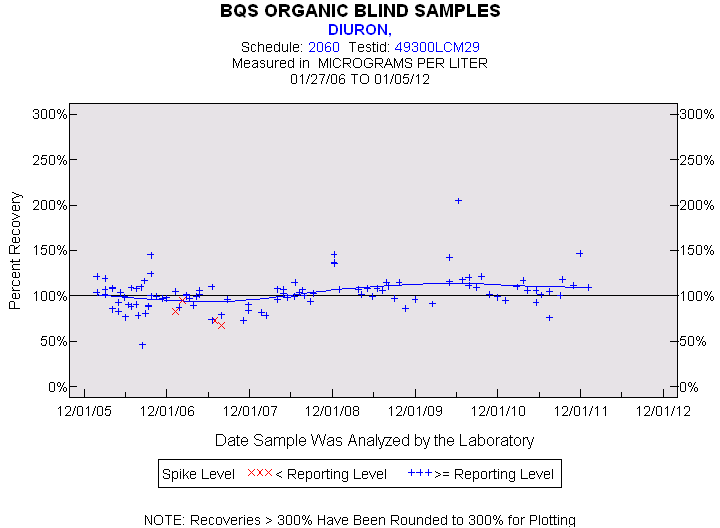
Statistics for the Plotted Points
DIURON
Spike Level
N
Mean
Std-Dev.
Median
F_Pseudo
< Reporting Level
4
80%
12%
78%
14%
>= Reporting Level
102
104%
19%
102%
12%
Total
106
103%
19%
102%
12%
Miscellaneous Statistics for the Samples
DIURON
Characteristic
N
%
% Basis
Plotted
106
100%
Spiked
Estimated Values
14
13%
Spiked
Deleted Values
0
0%
Spiked + Not Spiked
Spiked, Censored
0
0%
Spiked
Spiked
106
.
False Negatives
0
0%
0 out of 106
Not Spiked
118
.
False Positives
0
0%
0 out of 118