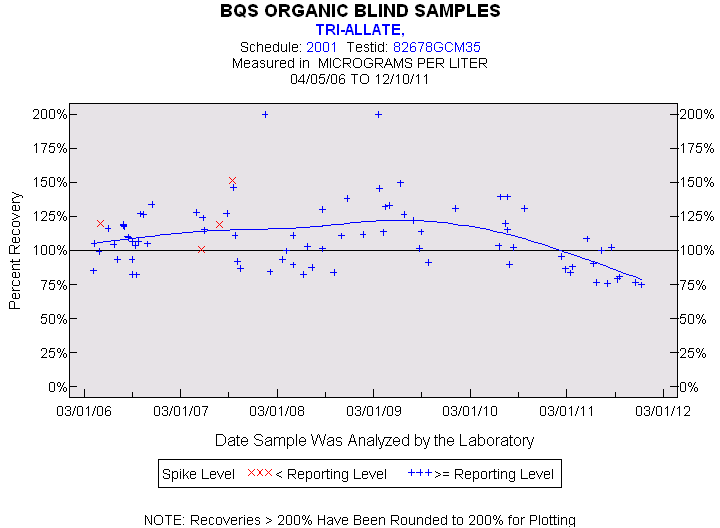
Statistics for the Plotted Points
TRI-ALLATE
Spike Level
N
Mean
Std-Dev.
Median
F_Pseudo
< Reporting Level
4
123%
21%
119%
19%
>= Reporting Level
78
109%
24%
106%
25%
Total
82
110%
24%
107%
24%
Miscellaneous Statistics for the Samples
TRI-ALLATE
Characteristic
N
%
% Basis
Plotted
82
100%
Spiked
Estimated Values
2
2%
Spiked
Deleted Values
1
1%
Spiked + Not Spiked
Spiked, Censored
0
0%
Spiked
Spiked
83
.
False Negatives
0
0%
0 out of 82
Not Spiked
56
.
False Positives
0
0%
0 out of 56