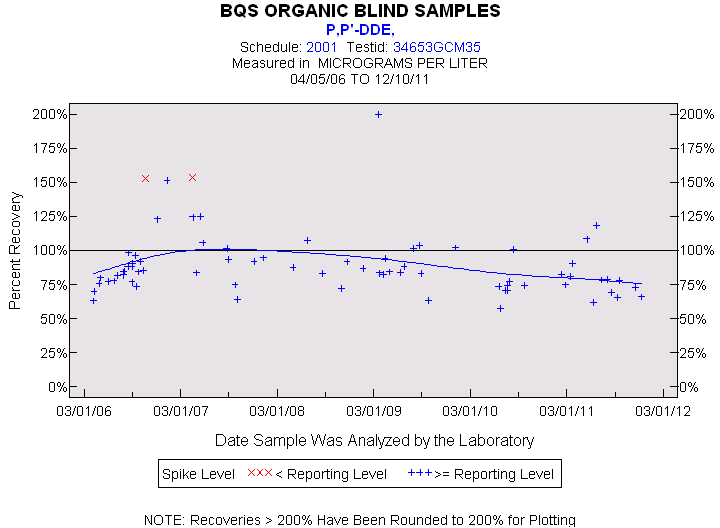
Statistics for the Plotted Points
P,P'-DDE
Spike Level
N
Mean
Std-Dev.
Median
F_Pseudo
< Reporting Level
2
153%
1%
153%
1%
>= Reporting Level
72
88%
21%
84%
14%
Total
74
90%
24%
84%
15%
Miscellaneous Statistics for the Samples
P,P'-DDE
Characteristic
N
%
% Basis
Plotted
74
100%
Spiked
Estimated Values
6
8%
Spiked
Deleted Values
1
1%
Spiked + Not Spiked
Spiked, Censored
0
0%
Spiked
Spiked
74
.
False Negatives
0
0%
0 out of 74
Not Spiked
65
.
False Positives
0
0%
0 out of 64