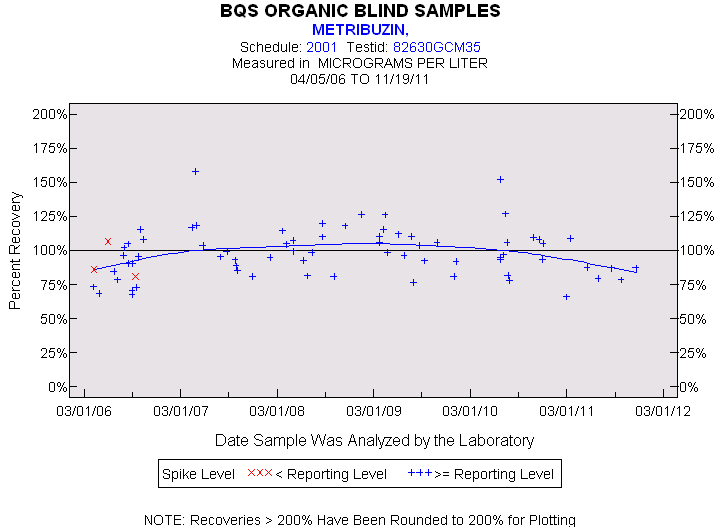
Statistics for the Plotted Points
METRIBUZIN
Spike Level
N
Mean
Std-Dev.
Median
F_Pseudo
< Reporting Level
3
91%
14%
86%
19%
>= Reporting Level
72
98%
18%
96%
16%
Total
75
98%
18%
96%
17%
Miscellaneous Statistics for the Samples
METRIBUZIN
Characteristic
N
%
% Basis
Plotted
75
99%
Spiked
Estimated Values
3
4%
Spiked
Deleted Values
1
1%
Spiked + Not Spiked
Spiked, Censored
1
1%
Spiked
Spiked
76
.
False Negatives
0
0%
0 out of 76
Not Spiked
63
.
False Positives
7
11%
7 out of 62