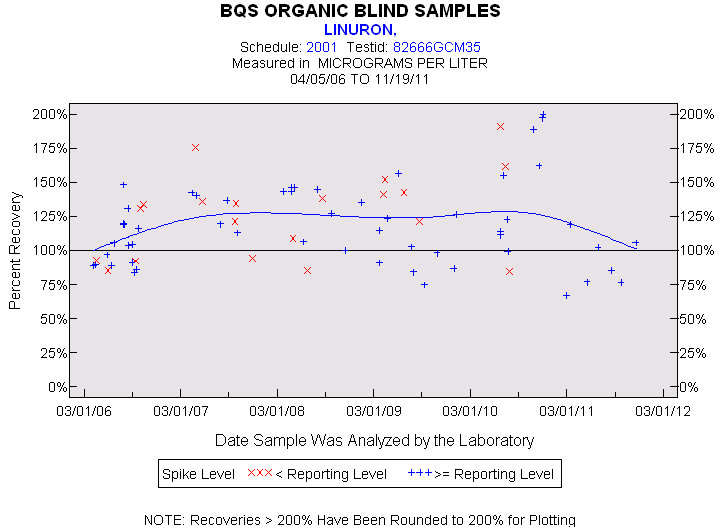
Statistics for the Plotted Points
LINURON
Spike Level
N
Mean
Std-Dev.
Median
F_Pseudo
< Reporting Level
20
126%
31%
132%
36%
>= Reporting Level
56
118%
30%
114%
33%
Total
76
120%
30%
119%
35%
Miscellaneous Statistics for the Samples
LINURON
Characteristic
N
%
% Basis
Plotted
76
100%
Spiked
Estimated Values
12
16%
Spiked
Deleted Values
1
1%
Spiked + Not Spiked
Spiked, Censored
0
0%
Spiked
Spiked
76
.
False Negatives
0
0%
0 out of 76
Not Spiked
63
.
False Positives
1
2%
1 out of 62