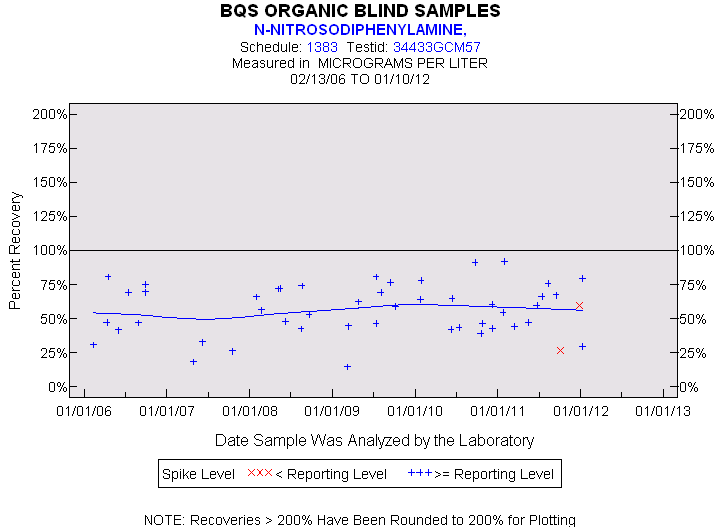
| Statistics for the Plotted Points |
| N-NITROSODIPHENYLAMINE |
| Spike Level | N | Mean | Std-Dev. | Median | F_Pseudo |
|---|---|---|---|---|---|
| < Reporting Level | 2 | 44% | 23% | 44% | 24% |
| >= Reporting Level | 47 | 57% | 18% | 59% | 21% |
| Total | 49 | 56% | 19% | 59% | 19% |
| Miscellaneous Statistics for the Samples |
| N-NITROSODIPHENYLAMINE |
| Characteristic | N | % | % Basis |
|---|---|---|---|
| Plotted | 49 | 94% | Spiked |
| Estimated Values | 12 | 23% | Spiked |
| Deleted Values | 4 | 3% | Spiked + Not Spiked |
| Spiked, Censored | 0 | 0% | Spiked |
| Spiked | 55 | . | |
| False Negatives | 3 | 6% | 3 out of 52 |
| Not Spiked | 89 | . | |
| False Positives | 1 | 1% | 1 out of 88 |