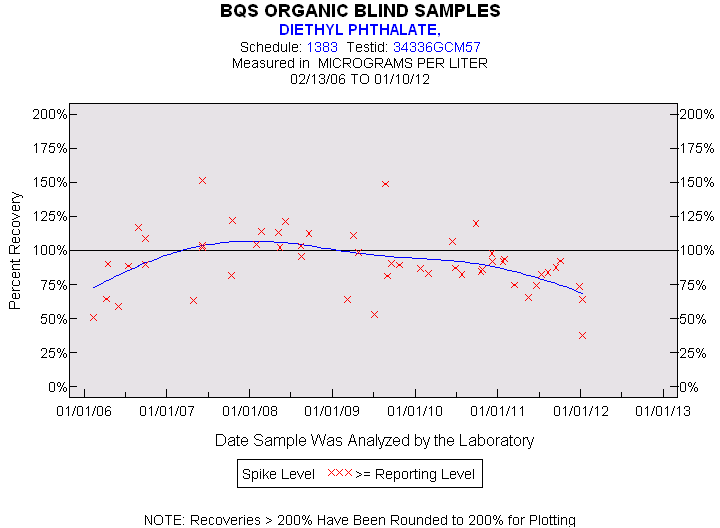
| Statistics for the Plotted Points |
| DIETHYL PHTHALATE |
| Spike Level | N | Mean | Std-Dev. | Median | F_Pseudo |
|---|---|---|---|---|---|
| >= Reporting Level | 52 | 91% | 22% | 90% | 17% |
| Total | 52 | 91% | 22% | 90% | 17% |
| Miscellaneous Statistics for the Samples |
| DIETHYL PHTHALATE |
| Characteristic | N | % | % Basis |
|---|---|---|---|
| Plotted | 52 | 100% | Spiked |
| Estimated Values | 8 | 15% | Spiked |
| Deleted Values | 4 | 3% | Spiked + Not Spiked |
| Spiked, Censored | 0 | 0% | Spiked |
| Spiked | 55 | . | |
| False Negatives | 0 | 0% | 0 out of 52 |
| Not Spiked | 89 | . | |
| False Positives | 1 | 1% | 1 out of 88 |