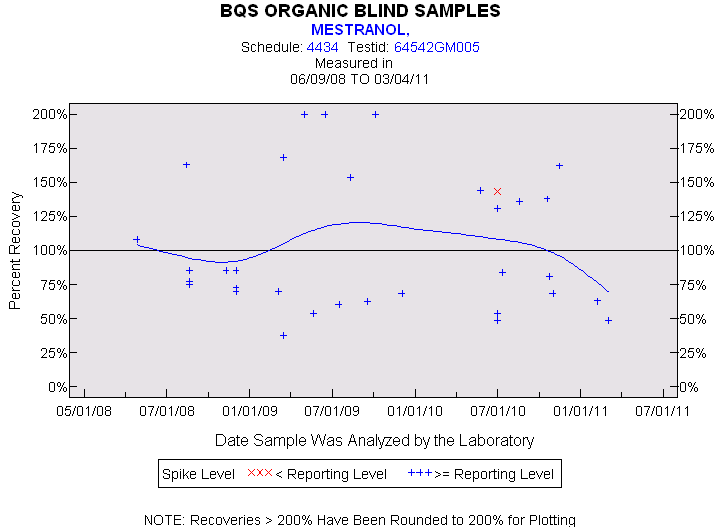
Statistics for the Plotted Points
MESTRANOL
Spike Level
N
Mean
Std-Dev.
Median
F_Pseudo
< Reporting Level
1
143%
.
143%
0%
>= Reporting Level
32
102%
49%
82%
56%
Total
33
103%
49%
84%
55%
Miscellaneous Statistics for the Samples
MESTRANOL
Characteristic
N
%
% Basis
Plotted
33
87%
Spiked
Estimated Values
3
8%
Spiked
Deleted Values
0
0%
Spiked + Not Spiked
Spiked, Censored
2
5%
Spiked
Spiked
38
.
False Negatives
3
8%
3 out of 38
Not Spiked
30
.
False Positives
0
0%
0 out of 30