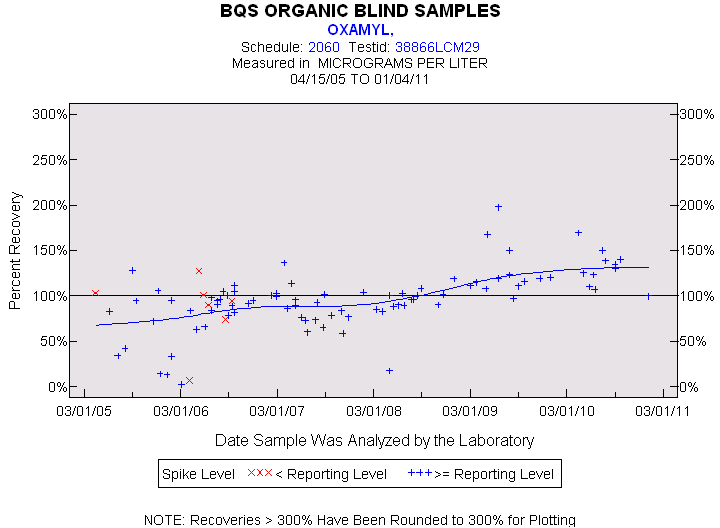
Statistics for the Plotted Points
OXAMYL
Spike Level
N
Mean
Std-Dev.
Median
F_Pseudo
< Reporting Level
7
86%
38%
95%
22%
>= Reporting Level
89
96%
32%
97%
21%
Total
96
96%
33%
97%
21%
Miscellaneous Statistics for the Samples
OXAMYL
Characteristic
N
%
% Basis
Plotted
96
86%
Spiked
Estimated Values
63
56%
Spiked
Deleted Values
4
2%
Spiked + Not Spiked
Spiked, Censored
6
5%
Spiked
Spiked
113
.
False Negatives
10
9%
10 out of 112
Not Spiked
120
.
False Positives
1
1%
1 out of 117