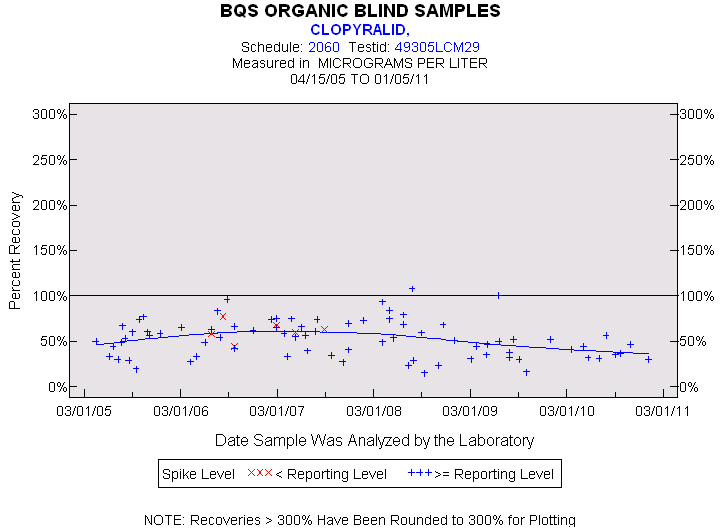
Statistics for the Plotted Points
CLOPYRALID
Spike Level
N
Mean
Std-Dev.
Median
F_Pseudo
< Reporting Level
6
62%
11%
62%
7%
>= Reporting Level
79
53%
20%
52%
24%
Total
85
53%
20%
53%
23%
Miscellaneous Statistics for the Samples
CLOPYRALID
Characteristic
N
%
% Basis
Plotted
85
89%
Spiked
Estimated Values
57
60%
Spiked
Deleted Values
0
0%
Spiked + Not Spiked
Spiked, Censored
2
2%
Spiked
Spiked
95
.
False Negatives
8
8%
8 out of 95
Not Spiked
138
.
False Positives
0
0%
0 out of 138