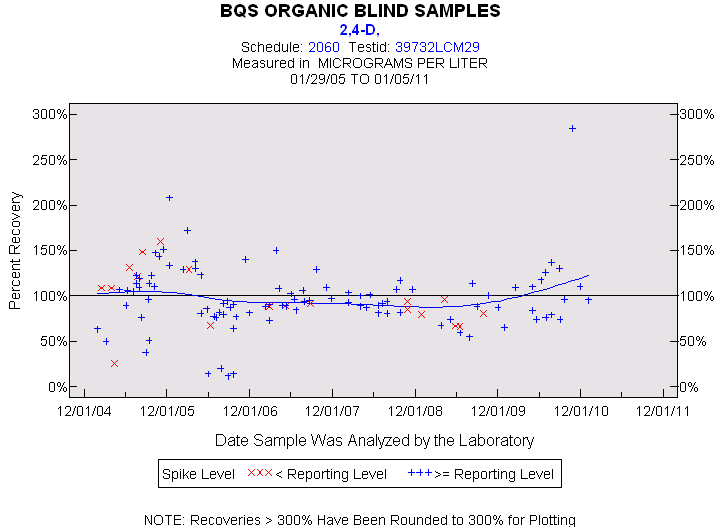
Statistics for the Plotted Points
2,4-D
Spike Level
N
Mean
Std-Dev.
Median
F_Pseudo
< Reporting Level
19
97%
32%
92%
31%
>= Reporting Level
100
98%
36%
94%
23%
Total
119
98%
36%
94%
25%
Miscellaneous Statistics for the Samples
2,4-D
Characteristic
N
%
% Basis
Plotted
119
96%
Spiked
Estimated Values
28
23%
Spiked
Deleted Values
0
0%
Spiked + Not Spiked
Spiked, Censored
2
2%
Spiked
Spiked
124
.
False Negatives
3
2%
3 out of 124
Not Spiked
109
.
False Positives
7
6%
7 out of 109