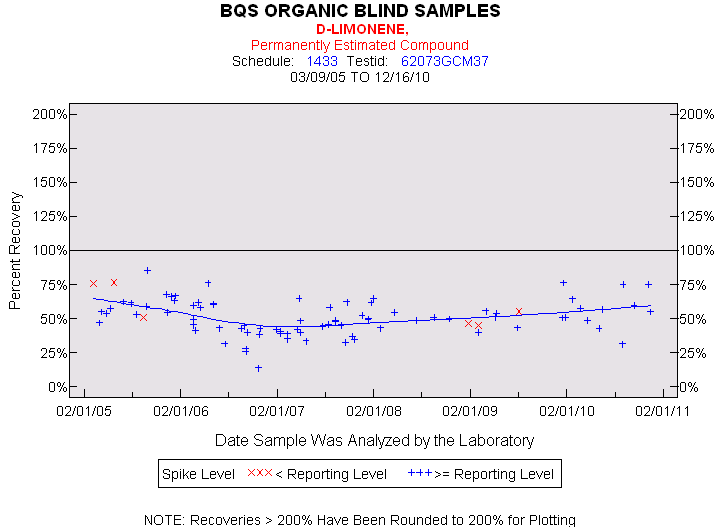
Statistics for the Plotted Points
D-LIMONENE
Spike Level
N
Mean
Std-Dev.
Median
F_Pseudo
< Reporting Level
6
59%
14%
53%
21%
>= Reporting Level
82
51%
13%
50%
13%
Total
88
51%
13%
50%
13%
Miscellaneous Statistics for the Samples
D-LIMONENE
Characteristic
N
%
% Basis
Plotted
88
92%
Spiked
Estimated Values
72
75%
Spiked
Deleted Values
3
1%
Spiked + Not Spiked
Spiked, Censored
5
5%
Spiked
Spiked
97
.
False Negatives
3
3%
3 out of 96
Not Spiked
139
.
False Positives
0
0%
0 out of 137