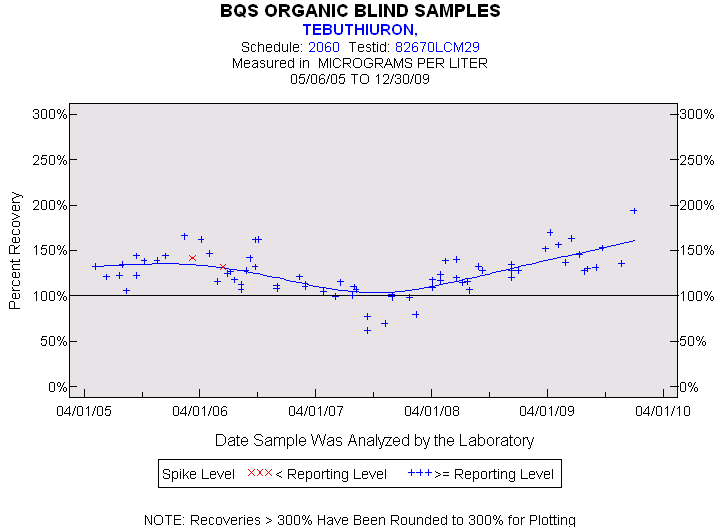
Statistics for the Plotted Points
TEBUTHIURON
Spike Level
N
Mean
Std-Dev.
Median
F_Pseudo
< Reporting Level
2
137%
7%
137%
7%
>= Reporting Level
70
125%
24%
124%
21%
Total
72
126%
23%
126%
21%
Miscellaneous Statistics for the Samples
TEBUTHIURON
Characteristic
N
%
% Basis
Plotted
72
100%
Spiked
Estimated Values
6
8%
Spiked
Deleted Values
0
0%
Spiked + Not Spiked
Spiked, Censored
0
0%
Spiked
Spiked
72
.
False Negatives
0
0%
0 out of 72
Not Spiked
134
.
False Positives
0
0%
0 out of 134