Statistics for the Plotted Points
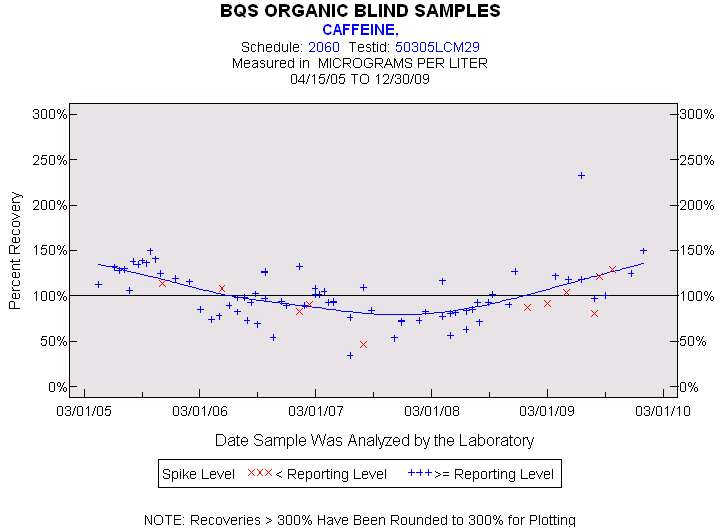
CAFFEINE
Spike Level
N
Mean
Std-Dev.
Median
F_Pseudo
< Reporting Level
11
96%
23%
92%
22%
>= Reporting Level
71
101%
29%
98%
29%
Total
82
101%
29%
97%
27%
Miscellaneous Statistics for the Samples
CAFFEINE
Characteristic
N
%
% Basis
Plotted
82
99%
Spiked
Estimated Values
20
24%
Spiked
Deleted Values
1
0%
Spiked + Not Spiked
Spiked, Censored
1
1%
Spiked
Spiked
84
.
False Negatives
0
0%
0 out of 83
Not Spiked
122
.
False Positives
1
1%
1 out of 122