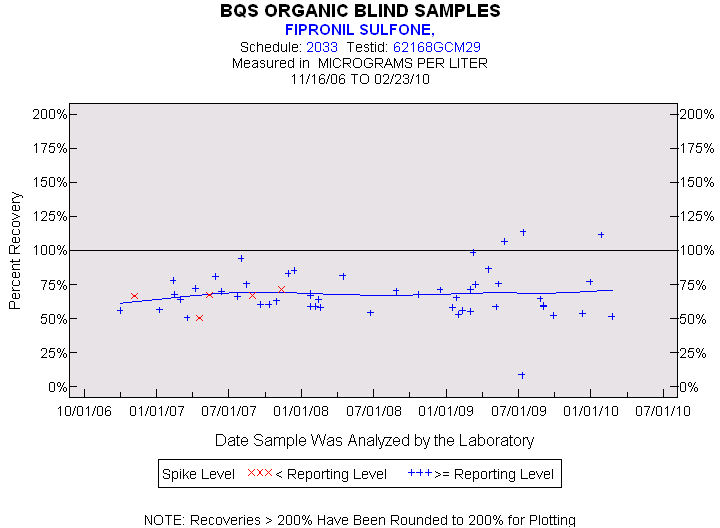
| Statistics for the Plotted Points |
| FIPRONIL SULFONE |
| Spike Level | N | Mean | Std-Dev. | Median | F_Pseudo |
|---|---|---|---|---|---|
| < Reporting Level | 5 | 65% | 8% | 67% | 1% |
| >= Reporting Level | 50 | 68% | 17% | 66% | 13% |
| Total | 55 | 68% | 17% | 67% | 13% |
| Miscellaneous Statistics for the Samples |
| FIPRONIL SULFONE |
| Characteristic | N | % | % Basis |
|---|---|---|---|
| Plotted | 55 | 100% | Spiked |
| Estimated Values | 10 | 18% | Spiked |
| Deleted Values | 2 | 1% | Spiked + Not Spiked |
| Spiked, Censored | 0 | 0% | Spiked |
| Spiked | 55 | . | |
| False Negatives | 0 | 0% | 0 out of 55 |
| Not Spiked | 127 | . | |
| False Positives | 29 | 23% | 29 out of 125 |