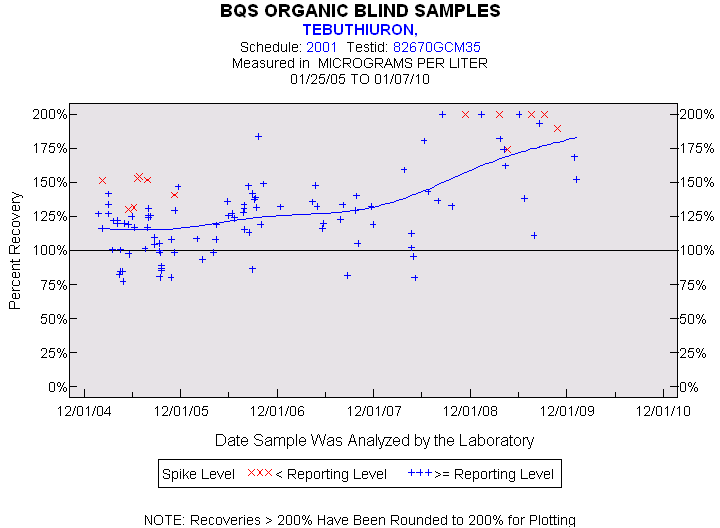
Statistics for the Plotted Points
TEBUTHIURON
Spike Level
N
Mean
Std-Dev.
Median
F_Pseudo
< Reporting Level
13
168%
27%
155%
36%
>= Reporting Level
96
124%
28%
123%
23%
Total
109
129%
31%
127%
25%
Miscellaneous Statistics for the Samples
TEBUTHIURON
Characteristic
N
%
% Basis
Plotted
109
97%
Spiked
Estimated Values
11
10%
Spiked
Deleted Values
1
1%
Spiked + Not Spiked
Spiked, Censored
3
3%
Spiked
Spiked
112
.
False Negatives
0
0%
0 out of 112
Not Spiked
87
.
False Positives
2
2%
2 out of 86