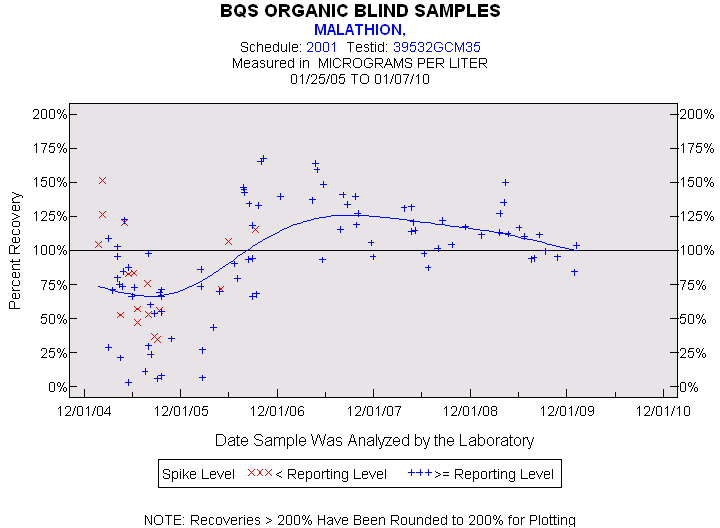
Statistics for the Plotted Points
MALATHION
Spike Level
N
Mean
Std-Dev.
Median
F_Pseudo
< Reporting Level
17
81%
34%
76%
40%
>= Reporting Level
88
95%
40%
98%
38%
Total
105
93%
39%
95%
38%
Miscellaneous Statistics for the Samples
MALATHION
Characteristic
N
%
% Basis
Plotted
105
94%
Spiked
Estimated Values
22
20%
Spiked
Deleted Values
1
1%
Spiked + Not Spiked
Spiked, Censored
3
3%
Spiked
Spiked
112
.
False Negatives
4
4%
4 out of 112
Not Spiked
87
.
False Positives
1
1%
1 out of 86