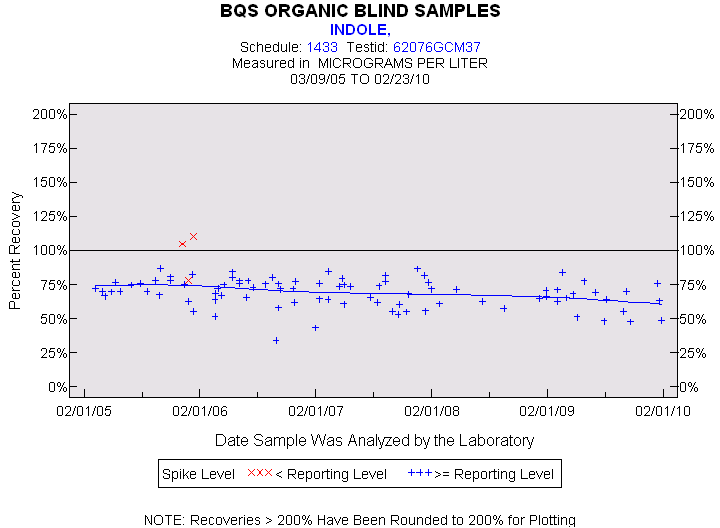
Statistics for the Plotted Points
INDOLE
Spike Level
N
Mean
Std-Dev.
Median
F_Pseudo
< Reporting Level
4
96%
15%
97%
18%
>= Reporting Level
89
69%
10%
70%
10%
Total
93
70%
12%
71%
10%
Miscellaneous Statistics for the Samples
INDOLE
Characteristic
N
%
% Basis
Plotted
93
99%
Spiked
Estimated Values
17
18%
Spiked
Deleted Values
3
1%
Spiked + Not Spiked
Spiked, Censored
0
0%
Spiked
Spiked
95
.
False Negatives
1
1%
1 out of 94
Not Spiked
118
.
False Positives
3
3%
3 out of 116