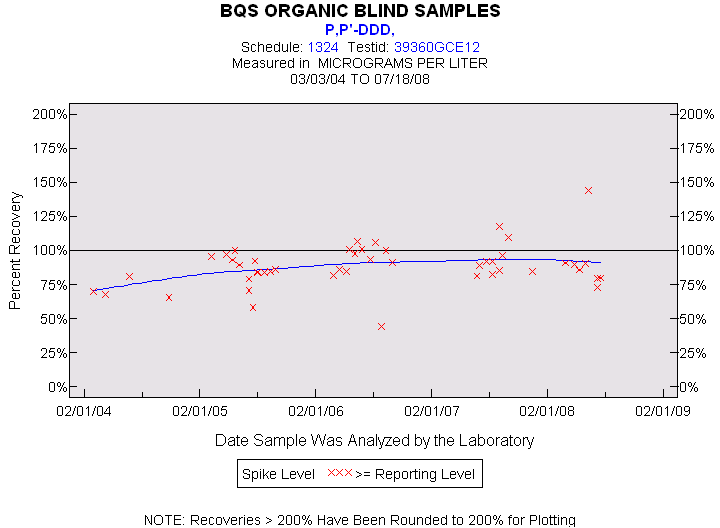
Statistics for the Plotted Points
P,P'-DDD
Spike Level
N
Mean
Std-Dev.
Median
F_Pseudo
>= Reporting Level
48
89%
15%
88%
11%
Total
48
89%
15%
88%
11%
Miscellaneous Statistics for the Samples
P,P'-DDD
Characteristic
N
%
% Basis
Plotted
48
98%
Spiked
Estimated Values
8
16%
Spiked
Deleted Values
0
0%
Spiked + Not Spiked
Spiked, Censored
0
0%
Spiked
Spiked
49
.
False Negatives
1
2%
1 out of 49
Not Spiked
52
.
False Positives
0
0%
0 out of 52