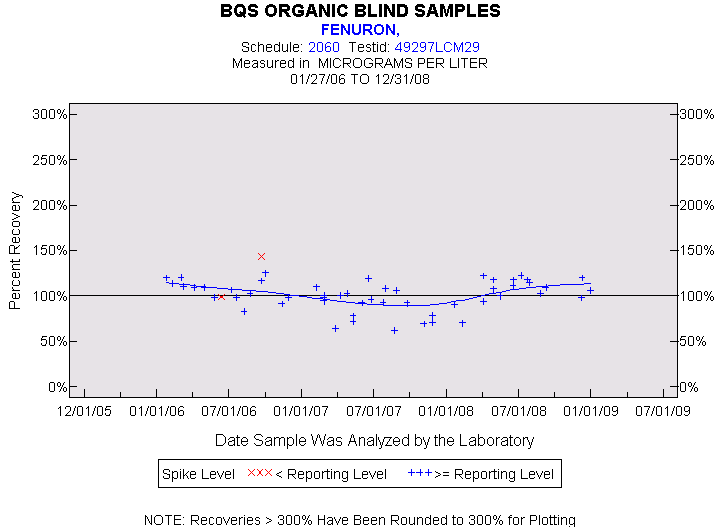
Statistics for the Plotted Points
FENURON
Spike Level
N
Mean
Std-Dev.
Median
F_Pseudo
< Reporting Level
2
121%
31%
121%
33%
>= Reporting Level
52
101%
16%
103%
15%
Total
54
102%
17%
103%
15%
Miscellaneous Statistics for the Samples
FENURON
Characteristic
N
%
% Basis
Plotted
54
93%
Spiked
Estimated Values
11
19%
Spiked
Deleted Values
0
0%
Spiked + Not Spiked
Spiked, Censored
2
3%
Spiked
Spiked
58
.
False Negatives
2
3%
2 out of 58
Not Spiked
83
.
False Positives
0
0%
0 out of 83