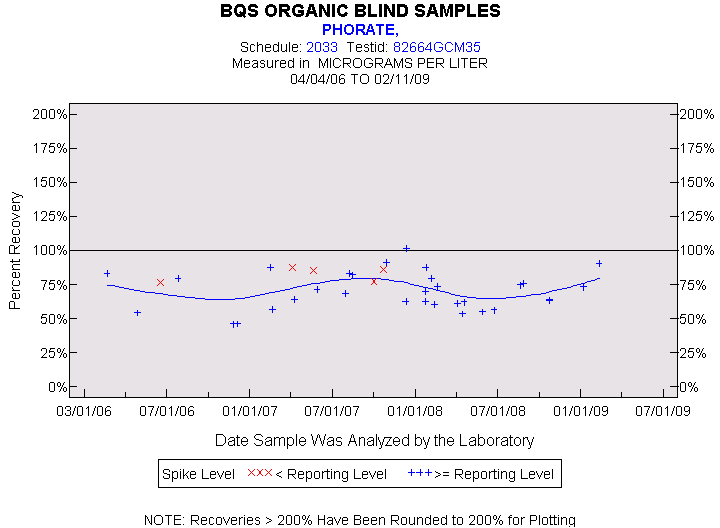
Statistics for the Plotted Points
PHORATE
Spike Level
N
Mean
Std-Dev.
Median
F_Pseudo
< Reporting Level
5
83%
5%
86%
6%
>= Reporting Level
32
70%
14%
69%
15%
Total
37
72%
14%
73%
15%
Miscellaneous Statistics for the Samples
PHORATE
Characteristic
N
%
% Basis
Plotted
37
100%
Spiked
Estimated Values
9
24%
Spiked
Deleted Values
2
2%
Spiked + Not Spiked
Spiked, Censored
0
0%
Spiked
Spiked
37
.
False Negatives
0
0%
0 out of 37
Not Spiked
93
.
False Positives
0
0%
0 out of 91