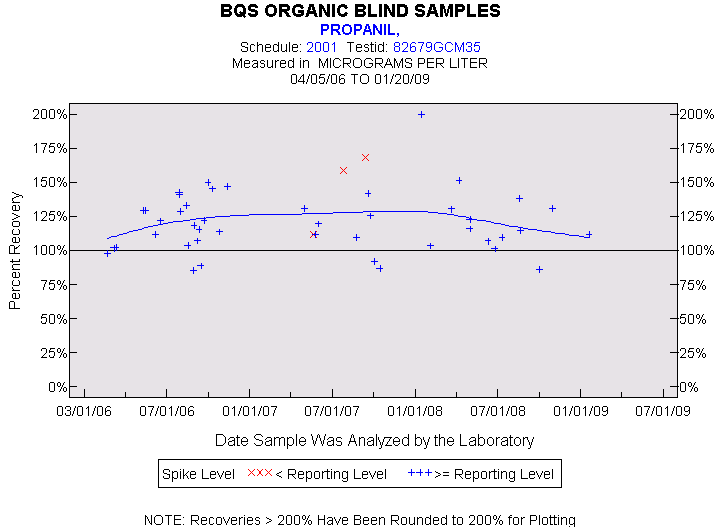
Statistics for the Plotted Points
PROPANIL
Spike Level
N
Mean
Std-Dev.
Median
F_Pseudo
< Reporting Level
3
146%
30%
159%
42%
>= Reporting Level
45
120%
22%
118%
18%
Total
48
122%
23%
119%
21%
Miscellaneous Statistics for the Samples
PROPANIL
Characteristic
N
%
% Basis
Plotted
48
100%
Spiked
Estimated Values
1
2%
Spiked
Deleted Values
1
1%
Spiked + Not Spiked
Spiked, Censored
0
0%
Spiked
Spiked
49
.
False Negatives
0
0%
0 out of 48
Not Spiked
41
.
False Positives
0
0%
0 out of 41