Statistics for the Plotted Points
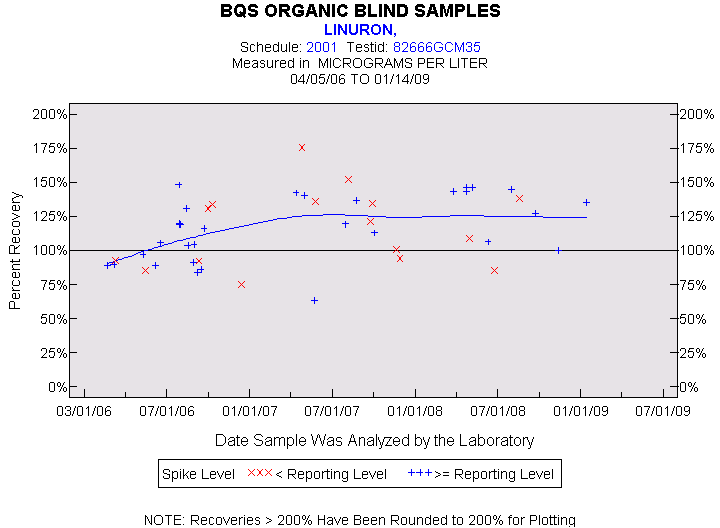
LINURON
Spike Level
N
Mean
Std-Dev.
Median
F_Pseudo
< Reporting Level
16
116%
28%
115%
32%
>= Reporting Level
31
116%
23%
119%
32%
Total
47
116%
25%
119%
32%
Miscellaneous Statistics for the Samples
LINURON
Characteristic
N
%
% Basis
Plotted
47
100%
Spiked
Estimated Values
13
28%
Spiked
Deleted Values
1
1%
Spiked + Not Spiked
Spiked, Censored
0
0%
Spiked
Spiked
47
.
False Negatives
0
0%
0 out of 47
Not Spiked
43
.
False Positives
0
0%
0 out of 42