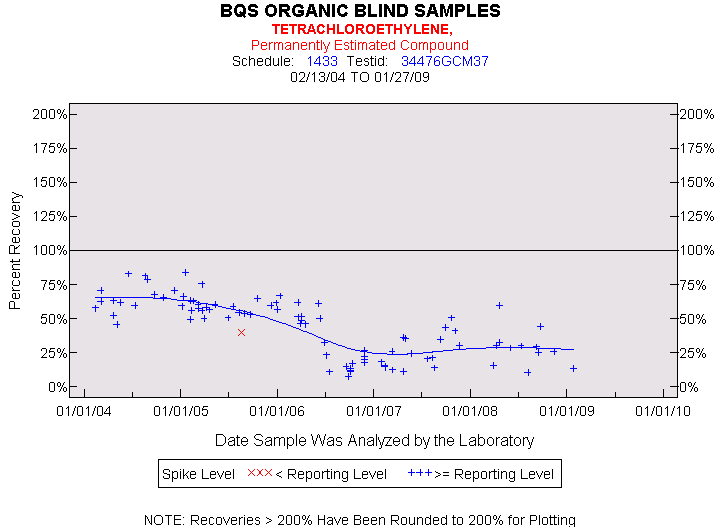
| Statistics for the Plotted Points |
| TETRACHLOROETHYLENE |
| Spike Level | N | Mean | Std-Dev. | Median | F_Pseudo |
|---|---|---|---|---|---|
| < Reporting Level | 1 | 40% | . | 40% | 0% |
| >= Reporting Level | 90 | 43% | 21% | 49% | 27% |
| Total | 91 | 43% | 21% | 49% | 27% |
| Miscellaneous Statistics for the Samples |
| TETRACHLOROETHYLENE |
| Characteristic | N | % | % Basis |
|---|---|---|---|
| Plotted | 91 | 100% | Spiked |
| Estimated Values | 91 | 100% | Spiked |
| Deleted Values | 6 | 3% | Spiked + Not Spiked |
| Spiked, Censored | 0 | 0% | Spiked |
| Spiked | 93 | . | |
| False Negatives | 0 | 0% | 0 out of 91 |
| Not Spiked | 132 | . | |
| False Positives | 1 | 1% | 1 out of 128 |