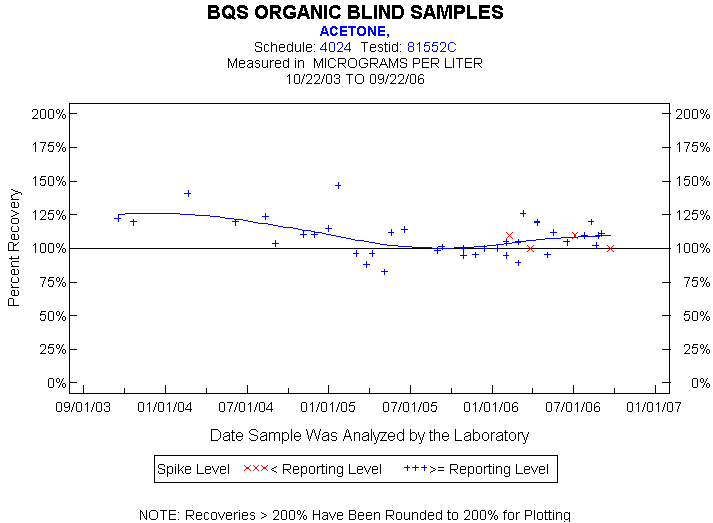
Statistics for the Plotted Points
ACETONE
Spike Level
N
Mean
Std-Dev.
Median
F_Pseudo
< Reporting Level
4
105%
6%
105%
7%
>= Reporting Level
38
108%
14%
107%
15%
Total
42
108%
13%
107%
11%
Miscellaneous Statistics for the Samples
ACETONE
Characteristic
N
%
% Basis
Plotted
42
98%
Spiked
Estimated Values
4
9%
Spiked
Deleted Values
0
0%
Spiked + Not Spiked
Spiked, Censored
0
0%
Spiked
Spiked
43
.
False Negatives
1
2%
1 out of 43
Not Spiked
27
.
False Positives
11
41%
11 out of 27