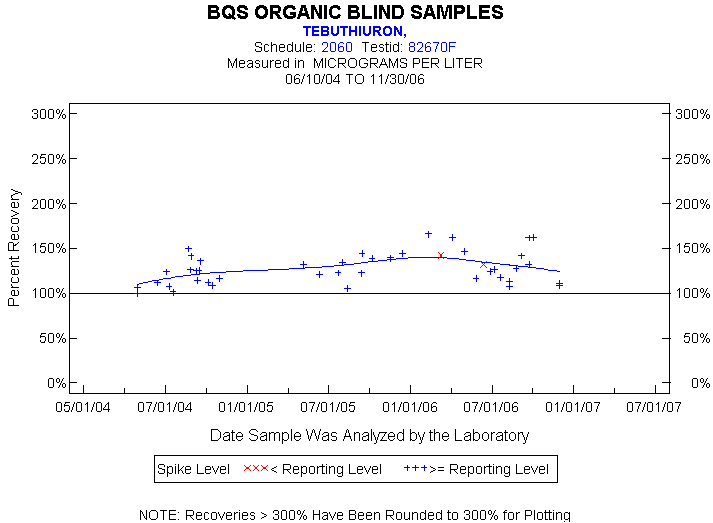
Statistics for the Plotted Points
TEBUTHIURON
Spike Level
N
Mean
Std-Dev.
Median
F_Pseudo
< Reporting Level
2
137%
7%
137%
7%
>= Reporting Level
42
127%
18%
125%
20%
Total
44
128%
17%
125%
21%
Miscellaneous Statistics for the Samples
TEBUTHIURON
Characteristic
N
%
% Basis
Plotted
44
98%
Spiked
Estimated Values
3
7%
Spiked
Deleted Values
0
0%
Spiked + Not Spiked
Spiked, Censored
0
0%
Spiked
Spiked
45
.
False Negatives
1
2%
1 out of 45
Not Spiked
60
.
False Positives
0
0%
0 out of 60