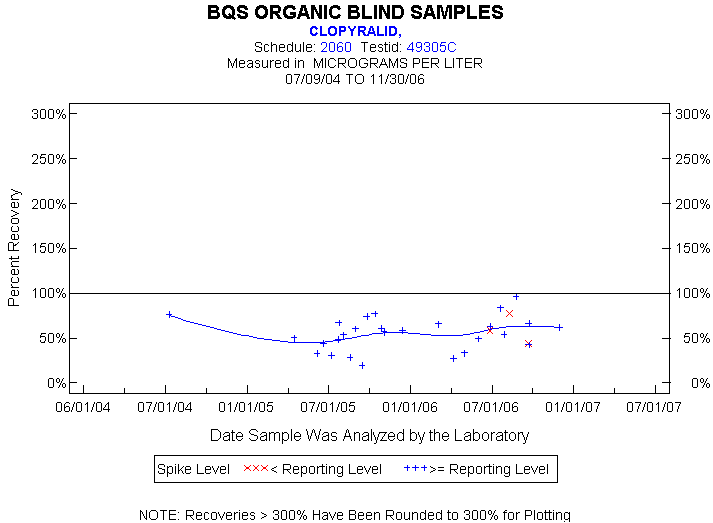
Statistics for the Plotted Points
CLOPYRALID
Spike Level
N
Mean
Std-Dev.
Median
F_Pseudo
< Reporting Level
3
60%
17%
58%
25%
>= Reporting Level
27
55%
19%
57%
18%
Total
30
55%
18%
58%
16%
Miscellaneous Statistics for the Samples
CLOPYRALID
Characteristic
N
%
% Basis
Plotted
30
88%
Spiked
Estimated Values
22
65%
Spiked
Deleted Values
0
0%
Spiked + Not Spiked
Spiked, Censored
2
6%
Spiked
Spiked
34
.
False Negatives
2
6%
2 out of 34
Not Spiked
70
.
False Positives
0
0%
0 out of 70