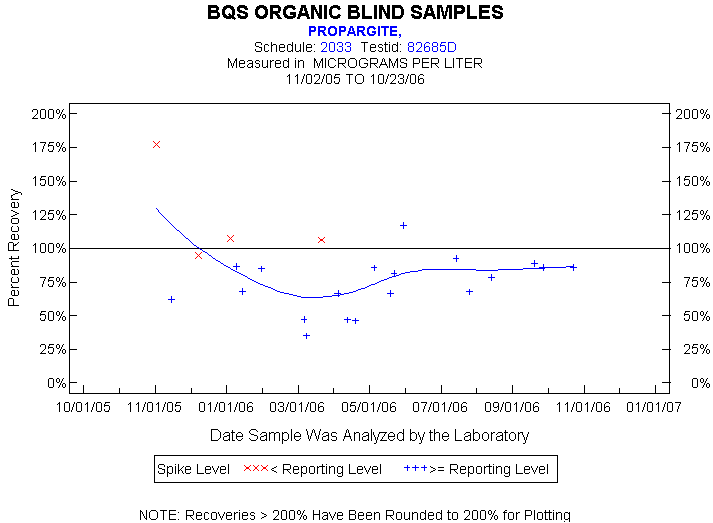
Statistics for the Plotted Points
PROPARGITE
Spike Level
N
Mean
Std-Dev.
Median
F_Pseudo
< Reporting Level
4
122%
38%
107%
31%
>= Reporting Level
19
73%
20%
78%
18%
Total
23
82%
30%
85%
19%
Miscellaneous Statistics for the Samples
PROPARGITE
Characteristic
N
%
% Basis
Plotted
23
96%
Spiked
Estimated Values
7
29%
Spiked
Deleted Values
1
4%
Spiked + Not Spiked
Spiked, Censored
1
4%
Spiked
Spiked
25
.
False Negatives
0
0%
0 out of 24
Not Spiked
0
.
False Positives
0
.
0 out of 0