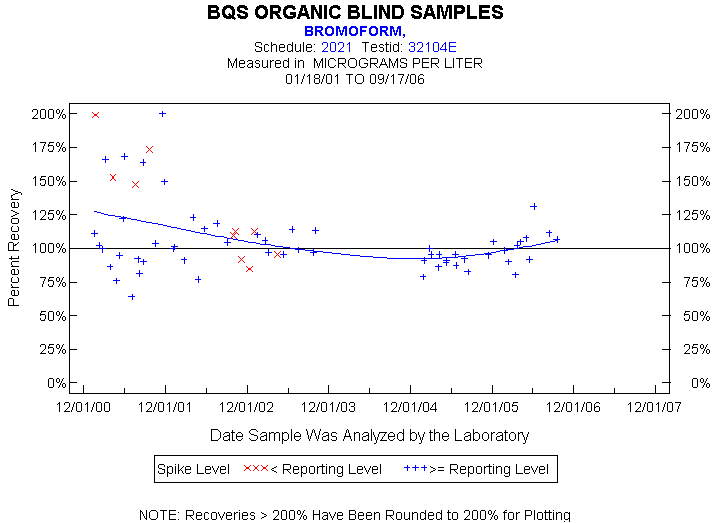
Statistics for the Plotted Points
BROMOFORM
Spike Level
N
Mean
Std-Dev.
Median
F_Pseudo
< Reporting Level
10
128%
38%
112%
42%
>= Reporting Level
57
104%
24%
99%
14%
Total
67
108%
28%
100%
16%
Miscellaneous Statistics for the Samples
BROMOFORM
Characteristic
N
%
% Basis
Plotted
67
96%
Spiked
Estimated Values
12
17%
Spiked
Deleted Values
1
1%
Spiked + Not Spiked
Spiked, Censored
2
3%
Spiked
Spiked
71
.
False Negatives
1
1%
1 out of 70
Not Spiked
108
.
False Positives
0
0%
0 out of 108