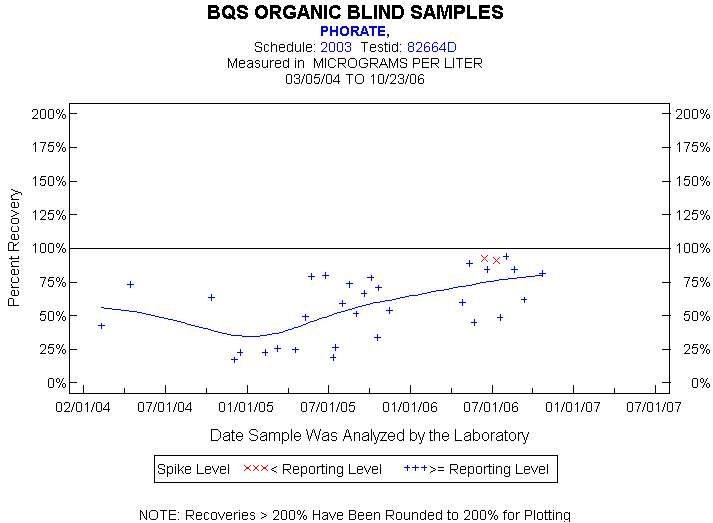
Statistics for the Plotted Points
PHORATE
Spike Level
N
Mean
Std-Dev.
Median
F_Pseudo
< Reporting Level
2
92%
1%
92%
1%
>= Reporting Level
30
56%
24%
59%
33%
Total
32
58%
25%
61%
31%
Miscellaneous Statistics for the Samples
PHORATE
Characteristic
N
%
% Basis
Plotted
32
100%
Spiked
Estimated Values
6
19%
Spiked
Deleted Values
2
3%
Spiked + Not Spiked
Spiked, Censored
0
0%
Spiked
Spiked
33
.
False Negatives
0
0%
0 out of 32
Not Spiked
36
.
False Positives
0
0%
0 out of 35