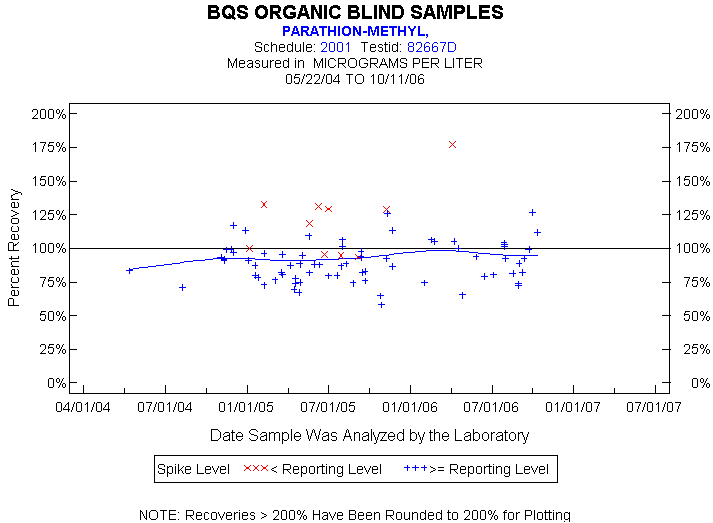
| Statistics for the Plotted Points |
| PARATHION-METHYL |
| Spike Level | N | Mean | Std-Dev. | Median | F_Pseudo |
|---|---|---|---|---|---|
| < Reporting Level | 10 | 120% | 26% | 124% | 27% |
| >= Reporting Level | 74 | 89% | 14% | 89% | 14% |
| Total | 84 | 93% | 19% | 92% | 15% |
| Miscellaneous Statistics for the Samples |
| PARATHION-METHYL |
| Characteristic | N | % | % Basis |
|---|---|---|---|
| Plotted | 84 | 98% | Spiked |
| Estimated Values | 11 | 13% | Spiked |
| Deleted Values | 0 | 0% | Spiked + Not Spiked |
| Spiked, Censored | 1 | 1% | Spiked |
| Spiked | 86 | . | |
| False Negatives | 1 | 1% | 1 out of 86 |
| Not Spiked | 127 | . | |
| False Positives | 0 | 0% | 0 out of 127 |