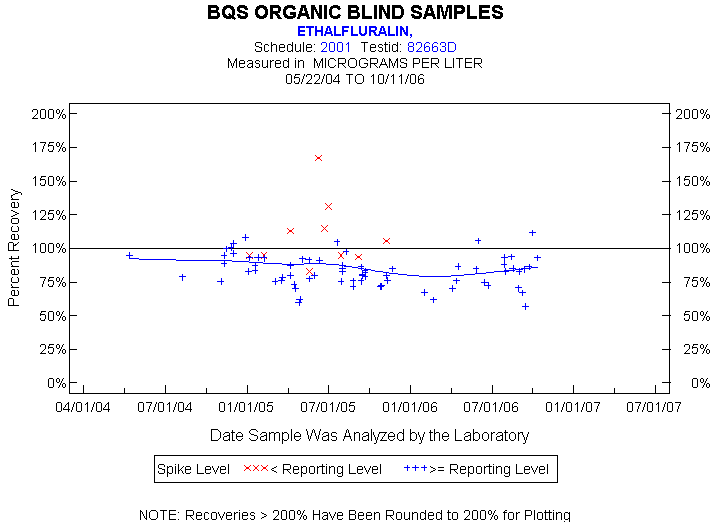
Statistics for the Plotted Points
ETHALFLURALIN
Spike Level
N
Mean
Std-Dev.
Median
F_Pseudo
< Reporting Level
10
109%
25%
100%
15%
>= Reporting Level
75
83%
11%
83%
12%
Total
85
86%
16%
85%
13%
Miscellaneous Statistics for the Samples
ETHALFLURALIN
Characteristic
N
%
% Basis
Plotted
85
99%
Spiked
Estimated Values
8
9%
Spiked
Deleted Values
0
0%
Spiked + Not Spiked
Spiked, Censored
1
1%
Spiked
Spiked
86
.
False Negatives
0
0%
0 out of 86
Not Spiked
127
.
False Positives
0
0%
0 out of 127