Statistics for the Plotted Points
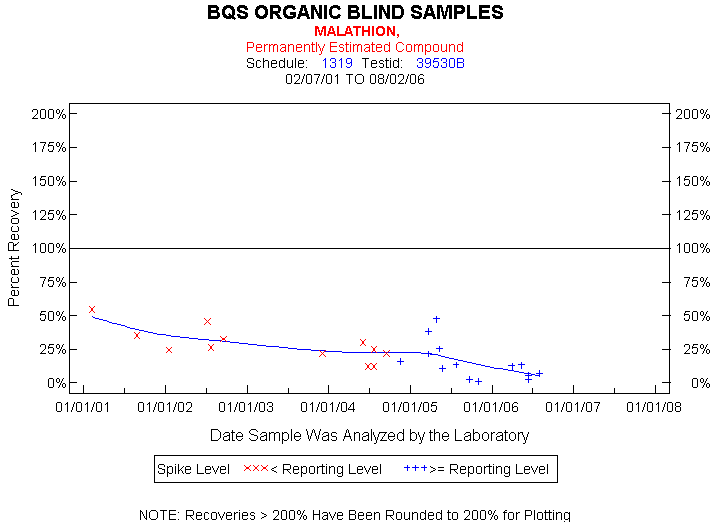
MALATHION
Spike Level
N
Mean
Std-Dev.
Median
F_Pseudo
< Reporting Level
12
29%
12%
26%
9%
>= Reporting Level
14
16%
14%
13%
12%
Total
26
22%
14%
22%
13%
Miscellaneous Statistics for the Samples
MALATHION
Characteristic
N
%
% Basis
Plotted
26
36%
Spiked
Estimated Values
26
36%
Spiked
Deleted Values
2
2%
Spiked + Not Spiked
Spiked, Censored
33
45%
Spiked
Spiked
75
.
False Negatives
14
19%
14 out of 73
Not Spiked
6
.
False Positives
0
0%
0 out of 6