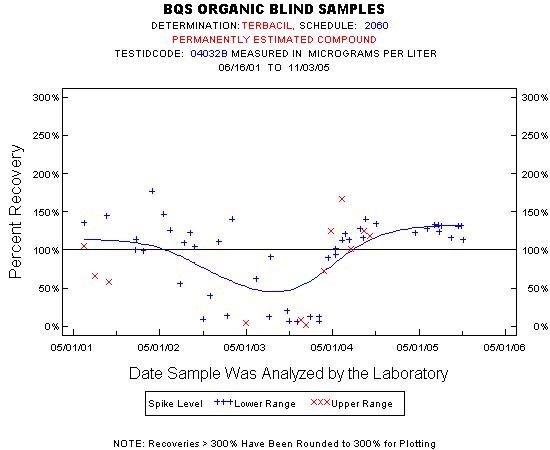
Statistics for the Plotted Points
TERBACIL
Spike Level
N
Mean
Std-Dev.
Median
F_Pseudo
Lower Range
46
96%
48%
114%
51%
Upper Range
12
80%
54%
87%
65%
Total
58
92%
49%
112%
52%
Miscellaneous Statistics for the Samples
TERBACIL
Characteristic
N
%
% Basis
Plotted
58
94%
Spiked
Estimated Values
50
81%
Spiked
Deleted Values
0
0%
Spiked + Not Spiked
Spiked, Censored
1
2%
Spiked
Spiked
62
.
False Negatives
3
5%
3 out of 62
Not Spiked
91
.
False Positives
0
0%
0 out of 91