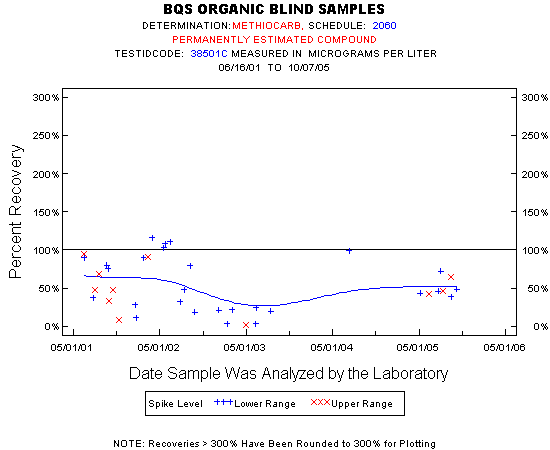
Statistics for the Plotted Points
METHIOCARB
Spike Level
N
Mean
Std-Dev.
Median
F_Pseudo
Lower Range
27
55%
36%
46%
51%
Upper Range
11
50%
29%
47%
26%
Total
38
53%
34%
47%
41%
Miscellaneous Statistics for the Samples
METHIOCARB
Characteristic
N
%
% Basis
Plotted
38
75%
Spiked
Estimated Values
30
59%
Spiked
Deleted Values
0
0%
Spiked + Not Spiked
Spiked, Censored
0
0%
Spiked
Spiked
51
.
False Negatives
13
25%
13 out of 51
Not Spiked
102
.
False Positives
0
0%
0 out of 102